Association of a high-protein and low-glycemic-index diet during pregnancy with offspring growth and obesity until the age of 18 years – a target trial emulation
Christina Sonne Mogensen, Christian Mølgaard, Faidon Magkos, Nina Rica Wium Geiker, Anne Ahrendt Bjerregaard, Charlotta Granström, Thorhallur Ingi Halldorsson, Sjurdur Frodi Olsen

TL;DR
A high-protein, low-glycemic-index diet during pregnancy was linked to higher body weight and BMI in children at 18 years, suggesting long-term effects on growth and obesity risk.
Contribution
This study emulates a target trial to evaluate the long-term impact of a high-protein, low-glycemic-index diet during pregnancy on offspring growth.
Findings
Offspring of mothers on an HPLGI diet had 2.59 kg higher body weight at 18 years.
These offspring also had 0.72 kg/m² higher BMI compared to those from the MPMGI group.
The study highlights the long-term implications of maternal dietary composition on offspring obesity risk.
Abstract
Maternal pre-pregnancy BMI and excessive gestational weight gain (GWG) are associated with offspring obesity. Moreover, maternal dietary patterns, particularly protein intake and glycemic index, influence GWG and fetal development. This study aimed to investigate the association of a high-protein, low-glycemic-index (HPLGI) diet during pregnancy with offspring growth and obesity. Using observational data from the Danish National Birth Cohort, a target trial emulation was conducted to investigate the association of an HPLGI diet during pregnancy on offspring growth up to 18 years of age. A cohort of 17,551 women who met the inclusion criteria was categorized into exposure groups based on their protein intake and glycemic index to emulate the groups in the APPROACH trial. Maternal characteristics varied between the exposure groups, with the HPLGI women exhibiting 1.67 kg higher…
Genes, proteins, chemicals, diseases, species, mutations and cell lines named across the full text — each resolved to its canonical identifier and authoritative record.
Click any figure to enlarge with its caption.
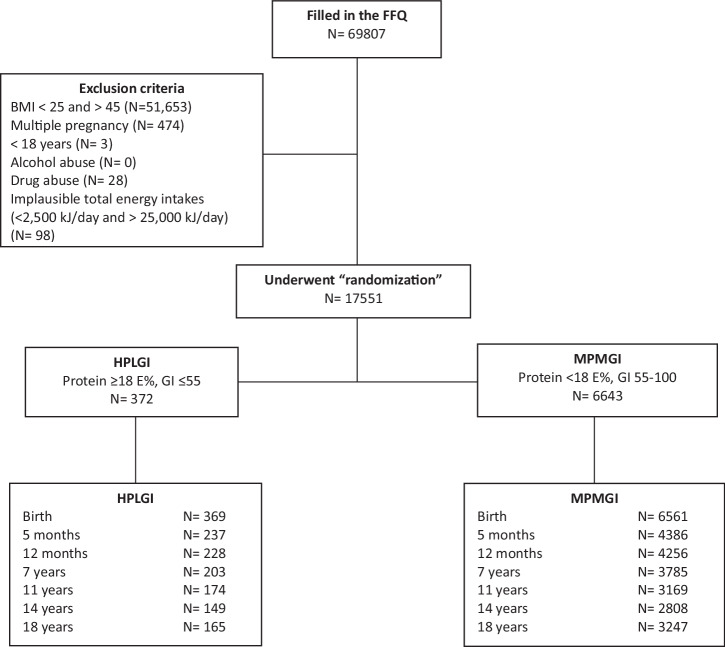 Figure 1
Peer Reviews
No public reviews on file for this paper yet. If you reviewed it on a platform where reviews are public (OpenReview, ICLR, NeurIPS, ICML), you can paste yours below so the community can read it here.
Videos
No videos yet. Explain this paper in a talk, walkthrough, or lecture? Add one.
Taxonomy
TopicsGestational Diabetes Research and Management · Birth, Development, and Health · Obesity, Physical Activity, Diet
Introduction
Individuals with obesity are at higher risk for developing many non-communicable diseases, such as type 2 diabetes, heart disease, and cancer [1]. In Denmark, about 50% of adults and 20% of primary school-aged children are classified as overweight or obese [2, 3]. Globally, the prevalence of childhood obesity has tripled since the 1990s, and children who are overweight are significantly more prone to becoming adults with obesity [4]. Preventing childhood obesity may thus have widespread implications for non-communicable diseases in the whole population.
Pre-pregnancy overweight and excessive gestational weight gain (GWG) increase the risk of the offspring being born large-for-gestational-age and developing overweight later in life [5]. Despite the recommendation for GWG below 9 kg for women with pre-pregnancy obesity, almost 60% of them exceed this threshold [6]. The characteristics of the maternal diet, including low dietary protein intake and low protein-to-carbohydrate ratio, appear to be associated with increased GWG, fetal adiposity, and fetal abdominal fat deposition [7–9]. Research in non-pregnant individuals exploring diets with varying protein-to-carbohydrate ratios and glycemic index (GI) has highlighted the efficacy of a high-protein diet with a low GI in preventing weight regain after weight loss [10]. In pregnant women, high GI diets are associated with an increased risk of excessive GWG, postnatal weight retention, and delivery of large-for-gestational-age infants, who are likely to become adults with elevated BMI [11–13]. Throughout pregnancy, the maternal diet serves as the sole source for the developing fetus. Nevertheless, conflicting results exist regarding the association between maternal protein intake and offspring birth weight, with some studies reporting a positive association [14] and others not [15, 16]. Additionally, studies on maternal protein intake during pregnancy and offspring later weight are also inconclusive [17, 18].
An intervention study—the APPROACH trial—targeting higher protein and lower GI intake among well-nourished overweight and obese pregnant women found significant effects on lower GWG (1.7 kg) [19] and a positive association between GWG and offspring BMI z-score at birth [20]. However, no effect of the intervention diet was found on offspring BMI until the age of 5 years but showed some indication of worse metabolic profile in the offspring compared to controls [21]. Here, we utilize data from the large Danish National Birth Cohort (DNBC) to conduct an emulation of the APPROACH trial. Our aim is to replicate the dietary regimens employed in the APPROACH trial for the purpose of investigating the long-term association of an HPLGI diet during pregnancy on offspring growth up until the age of 18 years within an observational setting of DNBC.
Methods
We first specified the protocol and developed a data analysis strategy for our target trial emulation. Key components are described in Table 1.Table 1. Target Trial Emulation of the APPROACH dietary intervention study.PROTOCOLAPPROACH RCTTARGET TRIAL EMULATIONELIGIBILITY CRITERIAPre-pregnancy BMI 28-45Older 18–45 yearsSingleton pregnancyNo abuse of alcohol or drugs ( >14 units of alcohol per week)No critical or chronic diseasesPre-pregnancy BMI 25–45Older than 18 yearsSingleton pregnancyNo abuse of alcohol or drugs ( >14 units of alcohol per week)Plausible total energy intakes ( >2500 kJ/day and <25,000 kJ/day)TREATMENT STRATEGYHigh-protein (25–28 E%), and low-GI (GI <55) ad libitum diet.Active Comparator: Moderate-protein (protein 18 E%) moderate-GI (no information on restricting glycemic load but guided following the principles of the New Nordic Diet (GI ~60)) ad libitum diet.High-protein ( ≥18 E%) and low-GI (GI ≤55) ad libitum diet.Active Comparator: Moderate-protein (protein <18 E%) moderate-GI (GI >55-100) ad libitum diet.RANDOMIZATIONParticipants were randomly assigned in gestational week 15 in clusters of 4–8 women to either the HPLGI diet or the MPMGI diet.We assumed randomization conditional on the eligibility criteria and the exposure diet, and adjusted for covariates: maternal pre-pregnancy BMI, SES, GWG, parity, offspring sex, and offspring gestational age.OUTCOMEPrimary outcome: Gestational weight gainSecondary outcome:Growth and development of the fetus and child from birth to 9 years of age.Primary outcome:Growth and development of the fetus and child from birth to 18 years of age.Secondary outcome: Gestational weight gainFOLLOW-UPStarts after the randomization in 2013 and ends at the last follow-up visit at 7-9 years of age, expected in 2025.Starts after the dietary questionnaires in 1996 and 2003 and ends with the follow-up of the offspring at 18 years.CAUSAL CONTRASTIntention to treat effect; per-protocol effect.Observational analog of per-protocol effect.ANALYSIS PLANAvailable case analyses of the follow-up of the offspring. The linear mixed model methodology with offspring age as a fixed effect and participant-specific ID as a random effect was used to assess the difference between the HPLGI diet and the MPMGI diet on offspring outcomes.Same as the APPROACH trial + pre-assignment data, including the eligibility criteria and thresholds for the exposure group and post-assignment confounders such as maternal pre-pregnancy BMI, SES, GWG, parity, offspring sex, and offspring gestational age.
Study design and setting
The DNBC is a large prospective cohort study, which enrolled almost 95,000 mother-offspring dyads between 1996 and 2003. During pregnancy, the women completed a food frequency questionnaire (FFQ) in gestational week (GW) 25 [22]. The women gave written informed consent on behalf of themselves and their offspring. The DNBC was conducted according to the guidelines in the Declaration of Helsinki, and the National Committee on Health Research Ethics in Denmark (H-4-2011-045) approved all procedures.
Participants
Among participating women in the DNBC cohort, 69,807 had information on nutrient intake from the FFQ administered in GW 25 (Fig. 1). From these, we selected a sub-cohort based on the APPROACH randomized controlled trial (RCT) inclusion and exclusion criteria: BMI 28–45 kg/m^2^; singleton birth; older than 18 years; and no alcohol or drug abuse. Additionally, we excluded implausible total energy intakes ( <2500 kJ/day and >25,000 kJ/day) ( ~1.0%). All the inclusion criteria were met by 17,551 women (25.1%).Fig. 1. Flow chart.FFQ food frequency questionnaire. HPLGI high-protein low-glycemic-index. MPMGI moderate-protein moderate-glycemic-index.
Modifications of the target trial protocol, to adapt the analyses to the observational setting within DNBC
We applied the design principles of the target trial methodology [23] to replicate the exposure groups of the APPROACH RCT and prolong the follow-up period for offspring growth until the age of 18 years. Nevertheless, we made necessary modifications to the trial protocol, such as a lower protein target and maternal BMI compared to the original trial protocol, to enhance the statistical power of our analysis, while still addressing the same primary objective as the APPROACH RCT (Table 1). The APPROACH RCT excluded women with a chronic disease, such as cancer, diabetes, or gestational diabetes mellitus. However, given the low prevalence rates of chronic diseases in the DNBC cohort, e.g., gestational diabetes mellitus [24], individuals with these conditions were not excluded from the analysis, as their inclusion would not significantly influence our results. Furthermore, we attempted to emulate randomization through the eligibility criteria and by adjusting for confounding variables.
Exposure assessment
A 360-item FFQ was used to collect information on maternal diet in GW 25. All frequencies were computed into times per day. To estimate the intake of each food item in grams, standard portion sizes were multiplied by the daily frequencies. The FFQ had three main components: food frequency, dietary supplements, and other information. The questionnaire was validated against 7-day food diaries and urine nitrogen excretion (n = 88) [25] and developed from the questionnaire used by the Danish Cancer Registry [26]. Specific GI values for each food-item in the FFQ were extracted from published data [27, 28] and were calculated by multiplying available carbohydrates (in grams) for the food item with the GI of the specific food item, summing up, and dividing by the total intake of available carbohydrates. White bread was used as a reference.
Exposure groups
Before the authors had access to outcomes, two exposure groups were defined based on maternal protein intake and GI. According to the hypothesis of the APPROACH RCT, we defined a high-protein low-glycemic index (HPLGI) group as protein ≥18 percent of total energy intake (E%) and GI ≤ 55, and a moderate-protein moderate glycemic index (MPMGI) group as protein <18 E% and GI >55-100. The chosen GI cut-off was determined by the specified threshold in the APPROACH RCT, and the International Standard Organization categorization for low GI [27]. For the MPMGI group, the GI was set to range from 55 to 100 to facilitate differences in GI between the two groups. The protein intake cut-off was selected considering the Nordic nutrition recommendations (dietary protein 10–20 E%) [29], and the high-protein threshold was then set at ≥18 E%. The final exposure groups consisted of 372 mother-offspring dyads in the HPLGI group and 6643 mother-offspring dyads in the MPMGI group (Fig. 1).
Outcome variables
Breastfeeding and GWG were obtained from self-reported questionnaires, 6 months postpartum. GWG was defined based on the questions: “How many kilograms did you gain or lose throughout your pregnancy?” and “How many kilograms did you lose throughout your pregnancy?”. Breastfeeding duration was defined as the duration of any breastfeeding, not distinguishing between exclusive and supplemented breastfeeding, in categories of <1, 1 to <4, 4 to <6, or ≥6 months. Smoking during pregnancy was obtained on telephone interviews in GW 12 and GW 30 (Daily <15 cigarettes, Daily ≥15 cigarettes, Occasionally, or Non-smoker). Offspring weight and length were obtained from The National Patient Registry at birth, 5 months of age, and 12 months of age. Moreover, offspring weight and height were obtained at ages 7 years, 11 years, 14 years, and 18 years by questionnaires. Age- and sex-specific BMI z-scores were calculated by using the WHO Child Growth Standards for offspring aged <5 years and the WHO Growth Reference for those ≥5 years [30, 31]. We further classified the offspring as overweight/obese by using the corresponding age- and sex-specific WHO cutoffs [i.e., 1-1.99 SD as overweight and ≥2 SD as obese] [32].
Covariate assessment
Based on telephone interviews in GW 12 and GW 30 information on the following set of covariates included in our analyses were recorded: Parity (nulliparous or not), socioeconomic status (based on the highest level of professional occupation within the couple and categorized as “high” including high- or medium-level professionals, or skilled workers, or “low” including unskilled workers and others,), pre-pregnancy BMI (calculated as self-reported pre-pregnancy weight in kilograms divided by height in meters squared and categorized into overweight: BMI 25–29.9 kg/m^2^ and obese: BMI ≥ 30 kg/m^2^). Information on the offspring’s gestational age at delivery (days) was extracted from medical records.
Statistics
To ensure that the sample size was adequate for comparing two means with a two-sided test, a power calculation was conducted. With a study population of 369 offspring at birth in the HPLGI group and 6561 offspring in the MPMGI group, and an estimated SD for BMI z-score of 1.16 [33], the difference in BMI z-score between the groups needed to be at least 0.174 SD to be detected with an 80% probability at a p-value of 0.05.
Maternal characteristics are presented as mean (SD) for continuous variables and frequencies for categorical variables. Differences between the HPLGI group and the MPMGI group were analyzed using ANOVA. To assess the differences in offspring outcomes between the HPLGI and MPMGI groups during the first 18 years of life, we conducted an observational analog of a per-protocol analysis, using a linear mixed model with offspring age (birth, 5 months, 12 months, 7 years, 11 years, 14 years, and 18 years) as a fixed effect and participant-specific ID as a random effect. We conducted three models: an unadjusted model (Model 1), a model adjusted for maternal pre-pregnancy BMI, SES, parity, and offspring sex (Model 2), and a fully adjusted model that additionally accounted for GWG and gestational age (Model 3). The residuals of all the models described above were investigated to assess normality. The Sidak correction was used to adjust the significance level for multiple comparisons over time within the group and presented as p-adjusted.
Results
Study participants
Among the 69,807 pregnant women, 17,551 (25.1%) met the inclusion/exclusion criteria. Among these, 372 women were assigned to the HPLGI diet group, and 6643 women were assigned to the MPMGI diet group. Follow-up assessments of offspring growth were completed from birth to 18 years of age, with a follow-up rate from 99% at birth to ~46% at 18 years of age (Fig. 1). Women who dropped out between their offspring’s birth and age of 18 years were, on average, 0.33 years younger (30.3 years ± 4.23) compared to those whose children completed the 18-year questionnaire (30.6 years ± 4.08) (P <0.001). The mothers were similar in terms of weight, height, pre-pregnancy BMI, GWG, energy intake, protein intake (both percentage and grams per day), and glycemic index. Additionally, their offspring had comparable birthweights and BMI z-scores (Table S1).
Women in the HPLGI group had higher pre-pregnancy weight (1.67 kg, 95% CI: 0.46; 2.88) and higher pre-pregnancy BMI (0.49 kg/m^2^, 95% CI: 0.11; 0.86) compared to those in the MPMGI group. Additionally, women who consumed an HPLGI diet had on average 2774 (95% CI: -2998; -2549) kJ/day lower energy intake compared to those in the MPMGI group. GWG was equal among the two groups (P = 0.134) (Table 2).Table 2. Maternal characteristics.NHPLGI (N = 372)NMPMGI (N = 6643)(HPLGI-MPMGI Estimate)P-valueMaternal age at delivery (years)37230.4 (4.06)664330.5 (4.17)−0.06 (−0.50; 0.37)0.776Gestational age (days)372280.5 (12.4)6643280.9 (12.5)−0.42 (−1.73; 0.88)0.526Pre-pregnancy weight (kg)37283.3 (11.6)664381.6 (11.6)1.67 (0.46; 2.88)0.007****Pre-pregnancy height (cm)372168.8 (6.33)6643168.5 (6.05)0.36 (−0.27; 0.99)0.266Pre-pregnancy BMI (kg/m^2^)37229.2 (3.73)664328.7 (3.56)0.49 (0.11; 0.86)0.010BMI categories0.040Overweight (%)25067.2480172.3Obese (%)12232.8184227.7GWG (kg)29112.88 (7.27)542513.52 (7.03)−0.64 (−1.47; 0.20)0.134Parity (%)0.144018248.9291643.9113034.9261839.42+6016.1110816.7Breastfeeding (months)0.981≤16746.2137846.31–43222.167022.54–63524.173124.56+117.62006.7Smoking (%)0.574Daily <15 cigarettes349.166410.0Daily 15+ cigarettes82.21352.0Occasionally4913.272610.9None smoker28175.5511877.0Socioeconomic status (%)****0.016High31584.9527679.6Low5615.1134920.4Energy intake (kJ)3727139 (1643)66439912 (2174)−2774 (−2998;−2549)<0.001Protein intake (%)37219.3 (1.22)664314.9 (1.75)4.35 (4.17; 4.53)<0.001Fat intake (%)37230.5 (5.49)664330.6 (5.74)−0.18 (−0.78; 0.41)0.547Carbohydrate (%)37249.8 (5.87)664354.0 (5.60)−4.24 (−4.82;−3.65)<0.001Fiber (g/day)37216.5 (6.51)664326.1 (7.72)−9.52 (−10.3;−8.72)<0.001Added sugar (g/day)37225.4 (11.7)664345.8 (24,8)−20.38 (−22.9;−17.8)**<0.001**Glycemic index (pr. day)37242.8 (10.95)664376.0 (13.02)−33.19 (−34.54;−31.84)<0.001GWG Gestational weight gain, HPLGI High-protein low-glycemic-index, MPMGI moderate-protein moderate-glycemic-index, BMI Body mass index. Data are presented as mean (standard deviation (SD)) for continuous variables or as numbers (%) for categorical variables. Bold indicates a significant difference from the MPMGI group.
Offspring outcomes
At 18 years of age, offspring born to women who consumed an HPLGI diet had, on average, 2.59 (95% CI: 1.31;3.87) kg higher body weight and 0.72 (95% CI: 0.30;1.14) kg/m^2^ higher BMI compared with offspring born to women in the MPMGI group (Table 3, Model 3). No differences between the HPLGI group and the MPMGI group on offspring outcomes from birth to 14 years of age were found after adjusting the p-value for multiple comparisons.Table 3. Offspring characteristics.Model 1Model 2Model 3HPLGIMPMGI(HPLGI-MPMGI Estimate)P-valueP*-adjustHPLGIMPMGI(HPLGI-MPMGI Estimate)P-valueP*-adjustHPLGIMPMGI(HPLGI-MPMGI Estimate)P-valueP-adjustBody weight, kgBirth3.7 (0.38)3.7 (0.09)−0.04 (−0.80;0.73)0.9211.0003.6 (0.40)3.7 (0.10)−0.16 (−0.92;0.60)0.6771.0003.5 (0.43)3.7 (0.11)−0.18 (−1.04;0.67)0.6731.0005 months7.9 (0.46)7.9 (0.11)0.01 (−0.93;0.94)0.9911.0007.8 (0.46)8.0 (0.12)−0.13 (−1.05;0.80)0.7881.0007.9 (0.52)7.9 (0.13)−0.08 (−1.11;0.96)0.8871.00012 months10.5 (0.47)10.4 (0.11)0.09 (−0.86;1.04)0.8511.00010.4 (0.47)10.4 (0.12)−0.07 (−1.01;0.87)0.8841.00010.4 (0.53)10.4 (0.13)−0.01 (−1.07;1.05)0.9861.0007 years25.9 (0.50)25.9 (0.12)−0.03 (−1.04;0.97)0.9501.00025.9 (0.50)26.0 (0.12)−0.15 (−1.15;0.85)0.7661.00026.0 (0.56)25.9 (0.14)0.03 (−1.09;1.14)0.9641.00011 years41.6 (0.54)42.8 (0.13)−1.21 (−2.29;−0.13)0.0280.18141.6 (0.54)42.9 (0.13)−1.31 (−2.38;−0.24)0.0170.11341.5 (0.60)42.4 (0.15)−0.95 (−2.16;0.26)0.1220.59914 years58.8 (0.58)58.5 (0.13)0.27 (−0.90;1.43)0.6530.99958.8 (0.58)58.6 (0.14)0.20 (−0.95;1.36)0.7311.00058.9 (0.64)58.5 (0.15)0.40 (−0.90; 1.65)0.5620.99718 years73.8 (0.55)73.4 (0.13)0.48 (−0.63;1.58)0.3970.97173.9 (0.55)73.5 (0.13)0.41 (−0.69;1.51)0.4680.98876.1 (0.64)73.5 (0.14)2.59 (1.31;3.87)**<.0001***<0.001Body length/height, cmBirth52.5 (0.30)52.6 (0.07)−0.07 (−0.67;0.52)0.8121.00052.3 (0.29)52.5 (0.08)−0.18 (−0.76;0.40)0.5410.90652.4 (0.33)52.5 (0.08)−0.14 (−0.79;0.50)0.6631.0005 months68.5 (0.35)68.3 (0.08)0.18 (−0.53;0.89)0.6240.99968.3 (0.35)68.2 (0.09)0.08 (−0.61;0.78)0.8181.00068.4 (0.39)68.2 (0.10)0.16 (−0.61;0.93)0.6851.00012 months77.5 (0.36)77.6 (0.08)−0.12 (−0.85;0.60)0.7361.00077.3 (0.35)77.5 (0.09)−0.23 (−0.93;0.48)0.5330.99577.5 (0.39)77.6 (0.10)−0.09 (−0.88;0.69)0.8191.0007 years126.5 (0.38)126.1 (0.09)0.44 (−0.32;1.19)0.2580.877126.4 (0.37)126.0 (0.09)0.36 (−0.38;1.10)0.3410.946126.5 (0.41)125.9 (0.10)0.57 (−0.24;1.39)0.1680.72411 years151.3 (040)151.5 (0.09)−0.27 (−1.07;0.53)0.5040.993151.1 (0.39)151.5 (0.10)−0.39 (−1.12;0.44)0.3960.971151.1 (0.44)151.0 (0.11)0.03 (−0.84;0.91)0.9441.00014 years169.5 (0.43)168.8 (0.10)0.64 (−0.22;1.51)0.1440.663169.4 (0.42)168.8 (0.10)0.62 (−0.22;1.47)0.1490.677169.5 (0.46)168.7 (0.11)0.77 (−0.15;1.69)0.1010.52618 years174.9 (0.41)174.9 (0.09)−0.04 (−0.86;0.79)0.9281.000174.9 (0.41)174.9 (0.10)−0.03 (−0.84;0.78)0.9491.000175.4 (0.47)175.0 (0.11)0.33 (−0.60;1.26)0.4840.990BMI**Birth13.16 (0.13)13.28 (0.03)−0.12 (−0.37;0.14)0.3640.95813.16 (0.13)13.29 (0.03)−0.13 (−0.38;0.13)0.3200.93313.12 (0.14)13.30 (0.04)−0.19 (−0.47;0.10)0.2040.7985 months13.15 (0.15)13.32 (0.04)−0.16 (−0.47;0.15)0.3040.92113.15 (0.15)13.32 (0.04)−0.17 (−0.48;0.14)0.2750.89513.11 (0.17)13.33 (0.04)−0.22 (−0.56;0.13)0.2240.83012 months13.17 (0.16)13.31 (0.04)−0.14 (−0.45;0.18)0.3990.97213.16 (0.16)13.31 (0.04)−0.16 (−0.47;0.16)0.3320.94113.11 (0.18)13.32 (0.04)−0.21 (−0.56;0.14)0.2380.8517 years13.13 (0.16)13.34 (0.04)−0.21 (−0.54;0.12)0.2030.79613.13 (0.16)13.36 (0.04)−0.23 (−0.56;0.10)0.1720.73313.10 (0.18)13.36 (0.04)−0.27 (−0.63;0.10)0.1530.68811 years18.08 (0.18)18.51 (0.04)−0.43 (−0.78;−0.08)0.0170.11518.08 (0.18)18.52 (0.04)−0.44 (−0.79;−0.09)0.0150.09718.11 (0.20)18.44 (0.05)−0.33 (−0.73;0.07)0.1040.53514 years20.43 (0.19)20.47 (0.04)−0.04 (−0.42;0.34)0.8461.00020.43 (0.19)20.48 (0.05)−0.46 (−0.42;0.33)0.8121.00020.47 (0.21)20.47 (0.05)−0.01 (−0.42;0.41)0.9821.00018 years24.06 (0.18)23.93 (0.04)0.13 (−0.23;0.49)0.4870.99124.04 (0.18)23.94 (0.04)0.11 (−0.25;0.47)0.5590.99724.64 (0.21)23.92 (0.05)0.72 (0.30;1.14)**0.0010.005****BMI z−score (0−228 months)Birth−0.24 (0.06)−0.14 (0.01)−0.10 (−0.02;0.22)0.0950.501−0.24 (0.06)−0.14 (0.02)−0.11 (−0.23;0.01)0.0750.419−0.28 (0.07)−0.12 (0.02)−0.17 (−0.30;−0.03)0.0150.1025 months−0.31 (0.07)−0.23 (0.02)−0.08 (−0.06;0.23)0.2630.882−0.31 (0.08)−0.22 (0.02)−0.09 (−0.23;0.06)0.2350.847−0.28 (0.08)−0.24 (0.02)0.04 (−0.20;0.12)0.6060.99912 months0.51 (0.07)0.39 (0.02)0.13 (−0.28;0.02)0.0840.4600.50 (0.07)0.39 (0.02)0.11 (−0.03;0.26)0.1310.6250.52 (0.08)0.38 (0.02)0.14 (−0.02;0.30)0.0930.4967 years0.29 (0.08)0.32 (0.02)−0.03 (−0.12;0.19)0.6861.0000.30 (0.08)0.33 (0.02)−0.03 (−0.18;0.12)0.6851.0000.32 (0.09)0.32 (0.02)−0.00 (−0.17;0.17)0.9661.00011 years0.16 (0.08)0.31 (0.02)−0.15 (−0.02;0.31)0.0810.4480.16 (0.08)0.32 (0.02)−0.15 (−0.32;0.01)0.0700.3970.20 (0.09)0.31 (0.02)−0.11 (−0.29;0.08)0.2620.88114 years0.21 (0.09)0.20 (0.02)0.01 (−0.19; 0.17)0.9091.0000.22 (0.09)0.21 (0.02)0.01 (−0.17;0.18)0.9451.0000.21 (0.10)0.21 (0.02)0.01 (−0.19;0.19)0.9401.00018 years0.60 (0.08)0.54 (0.02)0.06 (−0.23; 0.11)0.4810.9900.60 (0.08)0.55 (0.02)0.05 (−0.11;0.22)0.5320.9950.75 (0.10)0.54 (0.02)0.20 (0.01:0.40)0.0400.248Weight z−score (0−120 months)Birth0.67 (0.06)0.75 (0.01)−0.08 (−0.19;0.03)0.1500.4790.65 (0.06)0.74 (0.02)−0.09 (−0.20;0.03)0.1310.4290.65 (0.06)0.76 (0.02)−0.11 (−0.23;0.01)0.0680.2475 months0.51 (0.07)0.57 (0.02)−0.06 (−0.19;0.08)0.4160.8830.50 (0.07)0.55 (0.02)−0.05 (−0.19;0.08)0.4230.8890.56 (0.07)0.56 (0.02)0.00 (−0.14;0.14)0.9791.00012 months0.81 (0.07)0.79 (0.02)0.02 (−0.11;0.16)0.7530.9960.79 (0.07)0.77 (0.02)0.02 (−0.12;0.15)0.8100.9990.85 (0.07)0.77 (0.02)0.08 (−0.07;0.22)0.3020.7627 years0.79 (0.07)0.73 (0.02)0.05 (−0.09;0.19)0.4650.9180.77 (0.07)0.72 (0.02)0.05 (−0.09;0.19)0.4500.9090.81 (0.07)0.72 (0.02)0.09 (−0.06;0.24)0.2280.645Length z−score (0−228 months)**Birth1.58 (0.06)1.63 (0.01)−0.05 (−0.17;0.07)0.4350.9821.56 (0.06)1.61 (0.02)−0.05 (−0.17;0.07)0.3960.9711.61 (0.07)1.64 (0.02)−0.03 (−0.16;0.11)0.7551.0005 months1.33 (0.07)1.33 (0.02)0.00 (−0.14;0.15)0.9661.0001.31 (0.07)1.31 (0.02)0.01 (−0.14;0.15)0.9381.0001.36 (0.08)1.33 (0.02)0.03 (−0.12;0.19)0.6491.00012 months0.80 (0.07)0.91 (0.02)−0.11 (−0.25;0.03)0.1330.6310.78 (0.07)0.89 (0.02)−0.11 (−0.25;0.04)0.1470.6710.85 (0.08)0.90 (0.02)−0.05 (−0.21;0.11)0.5580.9947 years0.96 (0.07)0.86 (0.02)0.11 (−0.04;0.26)0.1640.7150.94 (0.08)0.84 (0.02)0.10 (−0.05;0.25)0.1750.7410.97 (0.08)0.85 (0.02)0.12 (−0.04;0.29)0.1270.65311 years0.83 (0.08)0.79 (0.02)0.04 (−0.11;0.20)0.5780.9980.81 (0.08)0.77 (0.02)0.05 (−0.11;0.20)0.5750.9980.86 (0.09)0.77 (0.02)0.09 (−0.09;0.26)0.3120.94114 years0.93 (0.08)0.88 (0.02)0.05 (−0.12;0.22)0.5520.9960.92 (0.08)0.86 (0.02)0.05 (−0.12;0.22)0.5450.9960.96 (0.09)0.87 (0.02)0.09 (−0.09;0.27)0.3360.95018 years0.84 (0.08)0.90 (0.02)−0.06 (−0.23;0.10)0.4460.9840.83 (0.08)0.89 (0.02)−0.06 (−0.22;0.10)0.4810.9900.84 (0.09)0.90 (0.02)−0.05 (−0.24;0.13)0.6060.997Data are presented as estimated means (SE). The difference between groups is presented as the estimated means from the HPLGI-MPMGI with 95% confidence intervals (CI). HPLGI: high-protein low–glycemic index; MPMGI: moderate-protein moderate–glycemic index. (Model 1) unadjusted, (model 2) adjusted for pre-pregnancy BMI, parity, socioeconomic status, and offspring sex, (Model 3) Model 2 + GWG and gestational age. *Adjusted with the Sidak correction. Bold indicates a significant difference from the MPMGI group.
Moreover, using the WHO age- and sex-specific categories for underweight, normal weight, overweight, or obesity, we found no difference between the groups at different ages (Table 4).Table 4. Obesity categories.HPLGIMPMGIP-valueBirth0.900Underweight, n (%)19 (5.15)354 (5.40)Normal weight, n (%)344 (93.23)6095 (92.89)Overweight, n (%)6 (1.63)100 (1.52)Obese, n (%)0 (0.00)12 (0.18)5 months0.800Underweight, n (%)17 (7.17)250 (5.70)Normal weight, n (%)214 (90.30)4025 (91.77)Overweight, n (%)5 (2.11)93 (2.12)Obese, n (%)1 (0.42)18 (0.41)12 months0.700Underweight, n (%)4 (1.75)87 (2.04)Normal weight, n (%)208 (91.23)3872 (90.98)Overweight, n (%)12 (5.26)253 (5.94)Obese, n (%)4 (1.75)44 (1.03)7 years0.400Underweight, n (%)3 (1.46)62 (1.63)Normal weight, n (%)148 (72.2)2796 (73.50)Overweight, n (%)46 (22.44)711 (18.69)Obese, n (%)8 (3.90)235 (6.18)11 years0.300Underweight, n (%)7 (4.02)84 (2.65)Normal weight, n (%)127 (72.99)2201 (69.45)Overweight, n (%)29 (16.67)686 (21.65)Obese, n (%)11 (6.32)198 (6.25)14 years0.900Underweight, n (%)2 (1.34)61 (2.17)Normal weight, n (%)115 (77.18)2134 (76.00)Overweight, n (%)26 (17.45)499 (17.77)Obese, n (%)6 (4.03)114 (4.06)18 years0.500Underweight, n (%)3 (1.82)43 (1.32)Normal weight, n (%)108 (65.45)2208 (68.00)Overweight, n (%)40 (24.24)657 (20.23)Obese, n (%)14 (10.44)339 (8.48)Data are presented as numbers (%) of participants in each obesity category; underweight, normal weight, overweight, or obese. HPLGI high-protein low–glycemic index, MPMGI moderate-protein moderate–glycemic index.
Discussion
This population-based cohort study found that offspring born to women who consumed an HPLGI diet during pregnancy exhibited higher body weight and BMI at 18 years of age compared to those born to women who consumed an MPMGI diet during pregnancy. Moreover, offspring from the HPLGI group had a higher BMI z-score at 18 years, but this difference disappeared after adjusting the p-value for multiple comparisons.
In the APPROACH RCT, offspring born to women who consumed an HPLGI diet during their pregnancy exhibited unfavorable effects in their lipid blood markers at 3 and 5 years of age compared with offspring born to women on an MPMGI diet [21]. Collectively, these observations suggest that while an HPLGI diet may have a positive impact on maternal outcomes, such as limited GWG and reduced pregnancy complications [19], it may have an unfavorable impact on long-term offspring outcomes. However, differences in BMI z-scores between the two APPROACH groups did not reach statistical significance [21], consistent with our findings on BMI z-scores in early childhood from the present study.
It is well documented that elevated maternal blood glucose levels are associated with excessive fetal growth, cord blood serum C-peptide, as well as other adverse pregnancy outcomes [34, 35]. Implementing a low GI diet during pregnancy has been associated with reduced birth weight, decreased incidence of macrosomia, and lower risk of offspring being born large-for-gestational-age among women with a high risk of gestational diabetes mellitus [36]. The potential mechanisms underlying the benefits of a low-GI diet may include the attenuated rise of postprandial glucose levels, which in turn reduces hyperinsulinemia [37] and oxidative stress [38]. Studies examining the effects of low GI diets and high GI diets indicate that offspring born to women following a low-GI diet during pregnancy tend to have a lower ponderal index, a marker of adiposity at birth [39, 40]. Additionally, another study examined differences in offspring BMI z-score across GI quantiles of the maternal diet found that children born to women with higher GI intake (Q4: GI 111-1603) during pregnancy had higher BMI z-scores at 7 years compared to those in the lowest GI quantile (Q1: GI 6-63) [41]. These observations support the concept that exposure to elevated glucose levels in utero can influence fetal growth and development [42, 43]. Despite the apparent benefits of a low GI diet during pregnancy on offspring health, our study did not support these findings. One possible explanation could be the interaction between the high protein and low GI, leading to a masking effects. High-protein foods tend to have a lower GI due to their slower digestion and absorption rates. This could potentially counteract the expected benefits of low GI foods.
However, ensuring adequate maternal protein intake during pregnancy is important to ensure sufficient amino acid availability for fetal growth and development. Consequently, there is ongoing speculation regarding the impact of increased maternal protein consumption during pregnancy on fetal development. Both excessive and insufficient maternal protein intake can result in adverse pregnancy outcomes such as impaired fetal growth [44]. However, it is hypothesized that heightened exposure to protein during fetal development might impact the offspring’s future protein needs and appetite regulation, potentially leading to calorie overconsumption in an attempt to meet the ‘upregulated’ protein needs, which can lead to weight gain [45]. Additionally, the overall protein intake during infancy (from birth to 2 y) appears to be associated with later obesity outcomes during childhood or adolescence [46, 47]. This suggests that offspring with prolonged exposure to high protein during infancy, and potentially exposure to high protein in their early environment, may be associated with the development of overweight and obesity in the long term. The association between an HPLGI diet during pregnancy with higher offspring body weight and BMI at 18 years, but not earlier in life, is noteworthy. This pattern may reflect a latent effect of maternal nutrition that only emerges during late adolescence, a period marked by significant hormonal and metabolic changes, presenting a challenge to metabolic homeostasis [48]. Similarly, this delayed effect has been observed with other early-life exposures, such as breastfeeding [49]. In another Danish cohort, an association between protein intake (substituted for carbohydrate) during pregnancy and the risk of offspring being overweight at 19–21 years of age was found [18], consistent with our findings at 18 years in the DNBC. Thus, the possibility exists that the influence of protein exposure in utero on the risk of obesity in the offspring manifests later in life, potentially explaining the higher weight and BMI observed in our study at 18 years. On the other hand, adequate protein intake is needed for the regulation of muscle mass, which is a major component of fat-free mass. In the Generation R study, including 2694 Dutch mother-offspring dyads, an association was found between maternal protein intake during pregnancy and higher offspring fat-free mass index, but not BMI or fat mass index at 6 years, measured by DEXA [17]. This highlights the limitation of BMI and BMI z-score as these metrics do not account for body composition, particularly when considering the impact of high protein diets on fat-free mass [50]. Moreover, while our primary focus was on protein intake and glycemic index, other dietary components may have contributed to the observed associations. For instance, lower fiber intake—often associated with high-protein, low-glycemic-index diets—may influence long-term metabolic outcomes through mechanisms involving gut microbiota, insulin sensitivity, and appetite regulation [51]. These mechanisms could contribute to an unfavorable intrauterine environment, potentially predisposing offspring to increased adiposity in late adolescence.
The generalizability of the findings from the DNBC may be limited due to lifestyle differences in the late 1990s, notably lower rates of obesity, and lower intakes of protein. In the present study, women in the HPLGI group had higher pre-pregnancy BMI and significantly lower energy intake compared with women in the MLMGI group, while gaining the same weight during pregnancy. It is well-documented that higher BMI is associated with a higher tendency for underreporting [52]. If indeed the HPLGI group is underreporting their dietary intake, this could potentially introduce a bias regarding the percent contribution of protein to total energy. Furthermore, all dietary data were self-reported in an FFQ by the women in GW 25. To enhance accuracy, the most extreme measures of energy intake were excluded, thus reducing the magnitude of measurement error. Moreover, offspring height and weight measurements were self-reported at 7 years, 11 years, 14 years, and 18 years by questionnaires, but the extent of potential misreporting in weight may have been less apparent due to the varying time intervals between the initial exposure (during pregnancy) and subsequent assessments (from birth to 18 years of age). However, this does not negate the possibility that such factors could be linked to misreporting. Additionally, environmental and lifestyle factors throughout childhood and adolescence may have influenced growth trajectories, potentially attenuating, amplifying, or delaying the associations with maternal diet. However, detailed data on these factors were not available for inclusion in the present analysis. We acknowledge that GWG and gestational age may lie on the causal pathway, and adjusting for them can introduce bias. However, the inclusion of these variables in the fully adjusted model (Model 3) was intended to isolate the association between the HPLGI diet and offspring outcomes, minimizing the influence of these potentially confounding factors. Despite these limitations, this cohort is a unique source of valuable longitudinal data with repeated measurements that allowed us to use detailed dietary information collected during pregnancy and offspring markers of adiposity from birth to the age of 18 years, while controlling for potential confounders.
In summary, this population-based cohort study suggests that offspring born to women who consumed an HPLGI diet during pregnancy exhibited higher body weight and BMI at 18 years of age compared to those born to women consuming an MPMGI diet. Further research may be needed to explore these findings and clarify the potential mechanisms and implications of maternal diet during pregnancy on offspring health outcomes.
Supplementary information
Supplementary material
The reference list from the paper itself. Each links out to its DOI / PubMed record.
- 1Halldorsson TI, Birgisdottir BE, Brantsaeter AL, Meltzer HM, Haugen M, Thorsdottir I, et al. Old Question Revisited: Are High-Protein Diets Safe in Pregnancy? Nutrients. 2021;13:440.10.3390/nu 13020440 PMC 791119833572843 · doi ↗ · pubmed ↗
- 2Mogensen CS, Magkos F, Zingenberg H, Geiker NRW. Effect of a high-protein and low-glycaemic index diet during pregnancy in women with overweight or obesity on offspring metabolic health-A randomized controlled trial. Pediatr Obes. 2024:e 13191.10.1111/ijpo.13191 PMC 1193671039622527 · doi ↗ · pubmed ↗
- 3Geirsdóttir OG, Pajari AM Protein - a scoping review for Nordic Nutrition Recommendations 2023. Food Nutr Res. 2023;67.10.29219/fnr.v 67.10261 PMC 1077064938187790 · doi ↗ · pubmed ↗
- 4Tang M. Protein Intake during the First Two Years of Life and Its Association with Growth and Risk of Overweight. Int J Environ Res Public Health. 2018;15:1742.10.3390/ijerph 15081742 PMC 612158030110887 · doi ↗ · pubmed ↗