The association between skeletal muscle mass and functional capacity outcomes in Chinese older adults: a national community-based study
Lin Chen, Xiaoqiang Lu, Zhongxin Zhu

TL;DR
This study finds that muscle mass in older adults is linked to better daily functioning, with specific thresholds and differences between men and women.
Contribution
The study identifies sex-specific thresholds of skeletal muscle mass that influence functional capacity in older adults.
Findings
Higher appendicular skeletal muscle mass index is inversely associated with lower BADL and IADL scores.
Thresholds of 6.2 kg/m² for men and 5.2 kg/m² for women mark significant changes in functional capacity associations.
Stronger associations were observed in men, urban residents, and those with stroke or cardiovascular disease.
Abstract
Maintaining functional independence in older adults is a critical public health objective. Although skeletal muscle mass is recognized as a key contributor to functional capacity outcomes, the exact relationship between them among community-dwelling older adults requires further investigation. This cross-sectional study analyzed data from 13,322 participants aged ≥65 years from the 2018 Chinese Longitudinal Healthy Longevity Survey (CLHLS). Appendicular skeletal muscle mass index (ASMI) was calculated using a validated anthropometric equation, while functional capacity outcomes were assessed using basic and instrumental activities of daily living (BADL/IADL) scores. Multivariable linear regression, generalized additive models, and threshold effect analysis were employed to evaluate associations, with adjustments for demographic, socioeconomic, lifestyle, and comorbidity factors. In…
Genes, proteins, chemicals, diseases, species, mutations and cell lines named across the full text — each resolved to its canonical identifier and authoritative record.
Click any figure to enlarge with its caption.
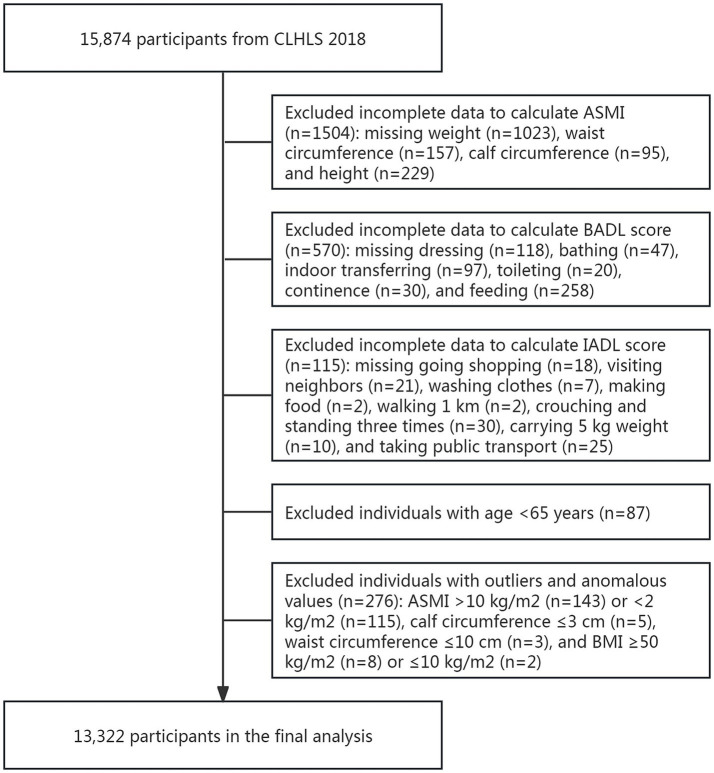 Figure 1
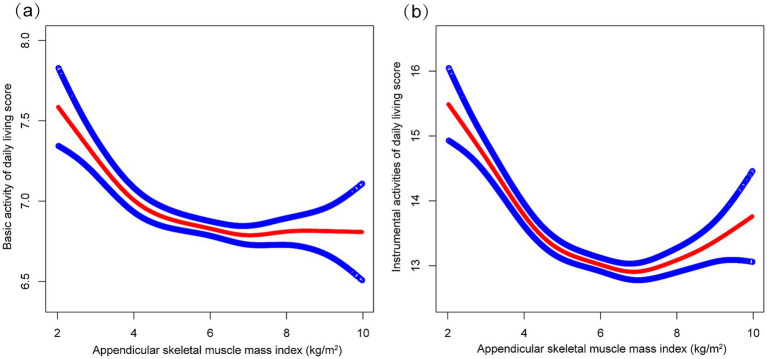 Figure 2
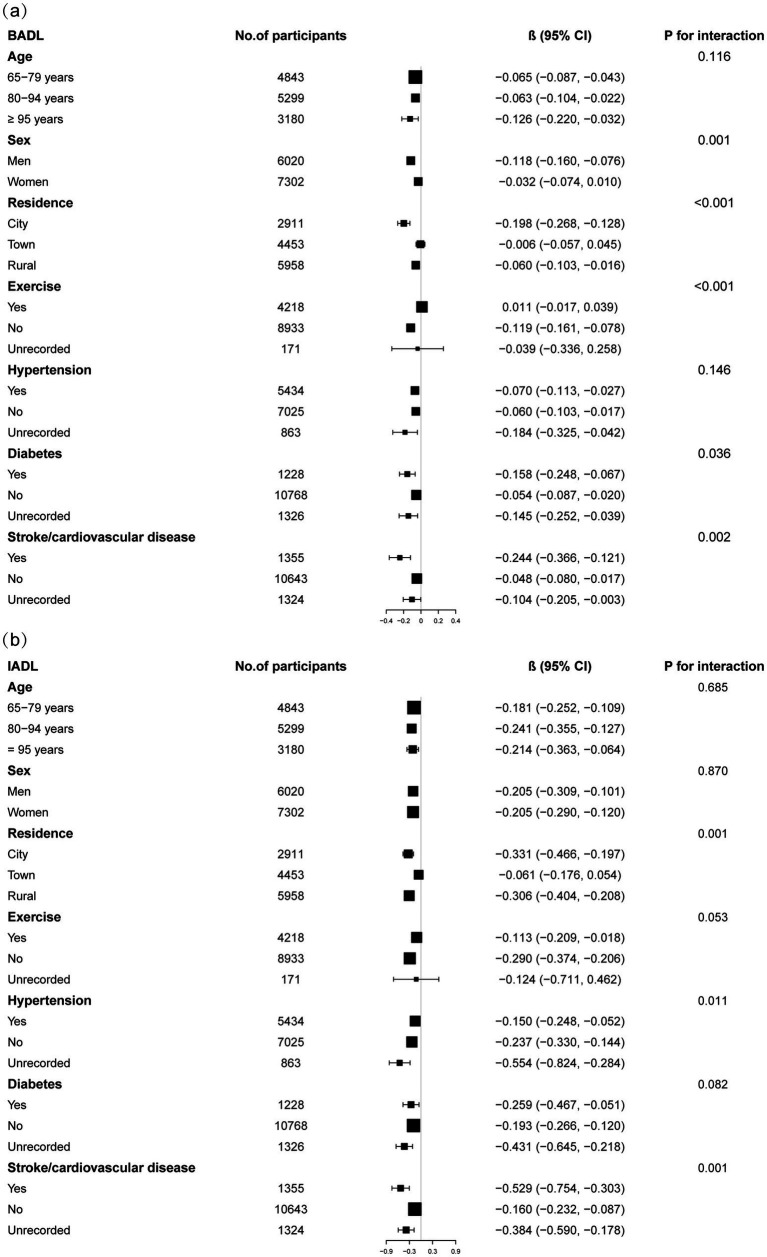 Figure 3
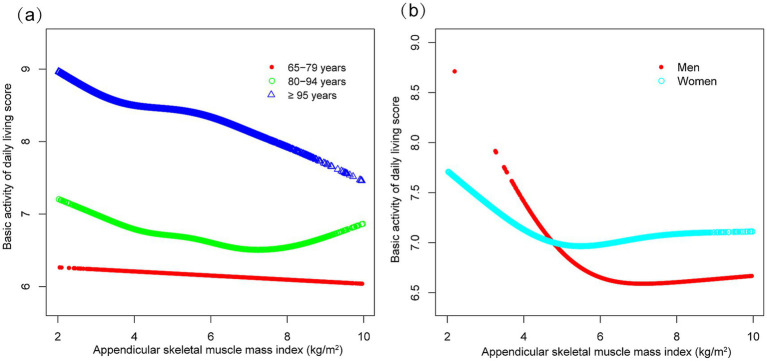 Figure 4
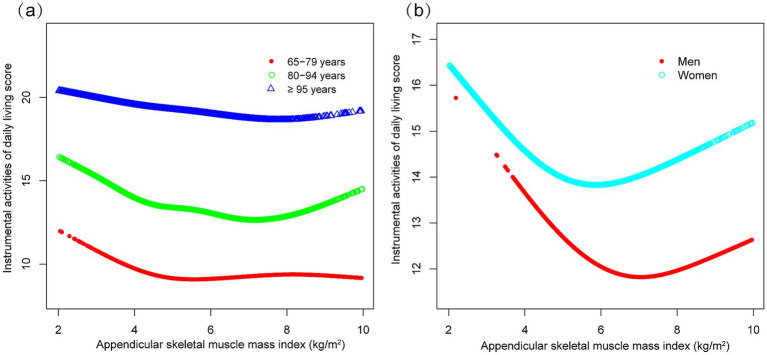 Figure 5
| Appendicular skeletal muscle mass index | Q1 | Q2 | Q3 | Q4 | |
|---|---|---|---|---|---|
| Age (years) | 91.9 ± 10.1 | 85.4 ± 10.9 | 82.3 ± 10.6 | 79.3 ± 9.9 | <0.001 |
| Sex (%) | <0.001 | ||||
| Men | 3.6 | 28.8 | 64.6 | 83.8 | |
| Women | 96.4 | 71.2 | 35.4 | 16.2 | |
| Years of schooling (%) | <0.001 | ||||
| 0 | 68.9 | 46.5 | 30.2 | 20.0 | |
| 1 to 6 | 13.8 | 27.8 | 35.7 | 34.6 | |
| ≥ 7 | 3.4 | 11.2 | 19.3 | 31.1 | |
| Unrecorded | 14.0 | 14.5 | 14.8 | 14.4 | |
| Marriage status (%) | <0.001 | ||||
| Married | 15.3 | 35.0 | 51.2 | 63.4 | |
| Separated/divorced/widowed/never married | 83.9 | 64.0 | 47.7 | 35.8 | |
| Unrecorded | 0.8 | 1.0 | 1.0 | 0.8 | |
| Residence (%) | <0.001 | ||||
| City | 14.1 | 19.4 | 23.8 | 30.1 | |
| Town | 34.5 | 34.9 | 33.0 | 31.3 | |
| Rural | 51.4 | 45.7 | 43.2 | 38.7 | |
| Annual household income (%) | <0.001 | ||||
| < 10,000 yuan | 27.1 | 26.3 | 25.4 | 21.7 | |
| 10,000 to 30,000 yuan | 27.1 | 24.7 | 22.5 | 22.3 | |
| 30,001to 60,000 yuan | 17.2 | 16.7 | 17.7 | 18.0 | |
| > 60,000 yuan | 18.6 | 23.3 | 26.6 | 31.4 | |
| Unrecorded | 10.0 | 9.0 | 7.7 | 6.6 | |
| Exercise (%) | <0.001 | ||||
| Yes | 18.6 | 29.2 | 36.4 | 42.3 | |
| No | 79.7 | 69.7 | 62.4 | 56.4 | |
| Not recorded | 1.6 | 1.1 | 1.2 | 1.3 | |
| Smoke (%) | <0.001 | ||||
| Yes | 5.2 | 12.0 | 21.5 | 23.1 | |
| No | 93.9 | 86.6 | 77.7 | 76.1 | |
| Not recorded | 0.9 | 1.4 | 0.8 | 0.8 | |
| Drink (%) | <0.001 | ||||
| Yes | 6.7 | 10.2 | 17.2 | 24.3 | |
| No | 91.4 | 88.5 | 81.6 | 74.6 | |
| Not recorded | 1.9 | 1.3 | 1.2 | 1.2 | |
| Hypertension (%) | <0.001 | ||||
| Yes | 30.9 | 41.0 | 41.2 | 50.0 | |
| No | 60.8 | 52.2 | 52.6 | 45.3 | |
| Not recorded | 8.3 | 6.8 | 6.1 | 4.6 | |
| Diabetes (%) | <0.001 | ||||
| Yes | 4.4 | 8.7 | 10.3 | 13.4 | |
| No | 83.9 | 80.7 | 80.4 | 78.3 | |
| Not recorded | 11.6 | 10.6 | 9.3 | 8.3 | |
| Stroke/cardiovascular disease (%) | <0.001 | ||||
| Yes | 6.4 | 10.4 | 10.7 | 13.2 | |
| No | 82.0 | 79.6 | 79.5 | 78.5 | |
| Not recorded | 11.6 | 10.0 | 9.8 | 8.3 | |
| Cancer (%) | <0.001 | ||||
| Yes | 1.0 | 1.2 | 1.5 | 1.7 | |
| No | 81.4 | 83.5 | 83.4 | 85.0 | |
| Not recorded | 17.6 | 15.3 | 15.1 | 13.4 | |
| Dementia (%) | <0.001 | ||||
| Yes | 3.2 | 1.6 | 1.3 | 0.9 | |
| No | 84.9 | 87.7 | 88.7 | 89.9 | |
| Not recorded | 11.9 | 10.7 | 10.0 | 9.2 | |
| Basic activity of daily living score | 7.6 ± 2.8 | 6.9 ± 2.2 | 6.6 ± 1.8 | 6.4 ± 1.5 | <0.001 |
| Instrumental activities of daily living score | 16.7 ± 6.0 | 13.5 ± 5.9 | 12.0 ± 5.3 | 11.0 ± 4.8 | <0.001 |
| Model 11 β (95% CI) | Model 22 β (95% CI) | Model 33 β (95% CI) | |
|---|---|---|---|
| BADL score | −0.288 (−0.311, −0.264) *** | −0.050 (−0.081, −0.020) ** | −0.072 (−0.103, −0.042) *** |
| ASMI quartile | |||
| Q1 | Reference | Reference | Reference |
| Q2 | −0.661 (−0.764, −0.558) | −0.167 (−0.269, −0.065) | −0.175 (−0.273, −0.077) |
| Q3 | −0.992 (−1.095, −0.889) | −0.225 (−0.342, −0.107) | −0.258 (−0.372, −0.145) |
| Q4 | −1.152 (−1.254, −1.049) | −0.143 (−0.274, −0.013) | −0.218 (−0.346, −0.090) |
| P for trend | <0.001 | 0.042 | 0.001 |
| IADL score | −1.367 (−1.427, −1.307) *** | −0.198 (−0.265, −0.131) *** | −0.225 (−0.290, −0.159) *** |
| ASMI quartile | |||
| Q1 | Reference | Reference | Reference |
| Q2 | −3.145 (−3.411, −2.880) | −0.797 (−1.020, −0.574) | −0.796 (−1.009, −0.583) |
| Q3 | −4.700 (−4.966, −4.435) | −1.002 (−1.258, −0.745) | −0.995 (−1.241, −0.748) |
| Q4 | −5.614 (−5.880, −5.349) | −0.753 (−1.038, −0.468) | −0.812 (−1.089, −0.534) |
| P for trend | <0.001 | <0.001 | <0.001 |
| Adjusted | |
|---|---|
| BADL score | |
| Men | |
| Inflection point | 6.2 |
| ASMI < 6.2 | −0.400 (−0.515, −0.285), <0.001 |
| ASMI > 6.2 | −0.018 (−0.075, 0.039), 0.542 |
| Log likelihood ratio | <0.001 |
| Women | |
| Inflection point | 5.2 |
| ASMI < 5.2 | −0.152 (−0.226, −0.079), <0.001 |
| ASMI > 5.2 | 0.091 (0.016, 0.165), 0.017 |
| Log likelihood ratio | <0.001 |
| IADL score | |
| Men | |
| Inflection point | 6.2 |
| ASMI < 6.2 | −1.009 (−1.293, −0.724), <0.001 |
| ASMI > 6.2 | 0.081 (−0.059, 0.222), 0.256 |
| Log likelihood ratio | <0.001 |
| Women | |
| Inflection point | 5.2 |
| ASMI < 5.2 | −0.692 (−0.839, −0.545), <0.001 |
| ASMI > 5.2 | 0.291 (0.143, 0.439), <0.001 |
| Log-likelihood ratio | <0.001 |
Peer Reviews
No public reviews on file for this paper yet. If you reviewed it on a platform where reviews are public (OpenReview, ICLR, NeurIPS, ICML), you can paste yours below so the community can read it here.
Videos
No videos yet. Explain this paper in a talk, walkthrough, or lecture? Add one.
Taxonomy
TopicsNutrition and Health in Aging · Body Composition Measurement Techniques · Frailty in Older Adults
Introduction
The global demographic transition toward population aging represents one of the most significant public health challenges of the 21st century, with China undergoing this transformation at an unprecedented scale and pace (1). Epidemiological data reveal a striking acceleration in aging dynamics: between 1990 and 2022, the proportion of China’s population aged ≥65 years increased 2.7-fold (from 5.57 to 14.9%), while the absolute number grew 3.3-fold (from 64 to 210 million individuals) (2). This demographic shift coincides with substantial gains in life expectancy (from 68.55 years in 1990 to 77.7 years in 2019), which is projected to reach 81.3 years by 2035 (3). Of particular concern are projections indicating that the disabled older adults population (≥65 years) will triple from 11.4 million in 2010 to 34.8 million by 2030, underscoring an urgent need for interventions that preserve functional autonomy to mitigate socioeconomic burdens (4).
Within this context, sarcopenia has emerged as a pivotal geriatric syndrome, characterized by the progressive, generalized loss of skeletal muscle mass and function (5). Contemporary understanding recognizes skeletal muscle not only as a contractile organ, but as a sophisticated endocrine platform that secretes myokines and exerkines capable of systemic metabolic regulation (6, 7). The musculoskeletal system’s dual roles in mechanical support and biochemical signaling make its age-related decline particularly consequential, with sarcopenia directly contributing to disability, frailty, and diminished quality of life (8, 9).
Although skeletal muscle mass is well-established as a contributor to physical capacity, growing evidence highlights the nuanced and complex nature of this relationship, particularly among older adults, where empirical studies have reported considerable inconsistencies (10, 11). For example, one systematic review concluded that the association between muscle mass and physical performance is weak or negligible (11). In contrast, a more recent comprehensive review demonstrated that reduced muscle mass is significantly associated with an increased risk of functional decline in older adults (10). Current clinical models predominantly assume linear relationships, potentially overlooking critical non-linear dynamics such as threshold effects and interactive mechanisms that could substantially improve intervention strategies. To better understand these complex associations, our study was designed to investigate the non-linear relationship between skeletal muscle mass and functional capacity in older adults.
Methods
Study design and population
We conducted a cross-sectional analysis using data from the 2018 wave of the Chinese Longitudinal Healthy Longevity Survey (CLHLS). Trained interviewers collected data through standardized face-to-face interviews. The study protocol was approved by the Biomedical Ethics Committee of Peking University, and all participants provided written informed consent. Publicly available data can be accessed through the CLHLS repository (https://opendata.pku.edu.cn/dataverse/pku/).
From the initial sample (n = 15,874), we excluded participants with: (1) missing appendicular skeletal muscle index (ASMI, n = 1,504) measurements, (2) incomplete assessments of either basic activities of daily living (BADL, n = 570) or instrumental activities of daily living (IADL, n = 115) scores, (3) age < 65 years (n = 87); and outliers or anomalous values (n = 276). The final analytical sample comprised 13,322 participants (Figure 1).
The flowchart of the participants selection.
Variables
Appendicular skeletal muscle mass (ASM) was calculated using the validated Kawakami equation: ASM (kg) = 2.955 × sex (men = 1, women = 0) + 0.255 × weight (kg) - 0.130 × waist circumference (cm) + 0.308 × calf circumference (cm) + 0.081 × height (cm) - 11.897 (12). To account for body size, ASM was normalized by height squared to derive the ASMI (kg/m^2^).
Functional capacity outcomes were assessed using two validated scales. The BADL scale evaluated six domains: (1) dressing, (2) bathing, (3) indoor transferring, (4), toileting, (5) continence, and (6) feeding. The IADL scale assessed eight higher-level functional domains: (1) going shopping, (2) visiting neighbors, (3) washing clothes, (4) making food, (5) walking one kilometer, (6) crouching and standing three times, (7) carryng five kg weight, and (8) taking public transportation. In the present study, all items were scored on a 3-point scale (1 = fully independent to 3 = completely dependent), generating total scores ranging 6–18 for BADL and 8–24 for IADL, where higher scores indicated greater functional dependence.
The analysis adjusted for multiple potential confounders across four categories: (1) demographic factors including age (65–79, 80–94, and ≥95 years), sex, years of schooling (0, 1 to 6, or ≥ years), marital status (married, separated/divorced/widowed/never married), and residence (city, town, rural); (2) socioeconomic status measured by annual household income (<10,000; 10,000 to 30,000; 30,001 to 60,000; or >60,000 yuan); (3) lifestyle factors including status of exercise, smoke and drink; and (4) comorbidities including hypertension, diabetes, stroke or cardiovascular disease, cancer, and dementia.
Statistical analyses
Participants were stratified into quartiles based on ASMI for baseline comparisons. Continuous variables were expressed as mean ± standard deviation, while categorical variables were presented as percentages. Between-group comparisons were performed using ANOVA for normally distributed continuous variables, Kruskal-Wallis tests for non-normally distributed continuous variables, and χ^2^ tests for categorical variables. The association between ASMI and functional capacity was examined using a series of progressively adjusted linear regression models: (1) an unadjusted model assessing crude associations; (2) a model adjusted for age and sex; and (3) a fully adjusted model incorporating demographic, socioeconomic, lifestyle, and comorbidity factors. To assess potential nonlinear associations, generalized additive models with smoothing splines were used for exploratory analysis. Where significant nonlinearity was indicated, piecewise linear regression was employed to identify and quantify threshold effects. Subgroup analyses were conducted to examine potential effect modifications by testing relevant interaction terms. All analyses were performed using R version 3.4.3 and EmpowerStats software. A two-tailed p-value < 0.05 was considered statistically significant.
Results
Study population characteristics
The characteristics of participants stratified by ASMI quartiles are presented in Table 1. Age exhibited a significant inverse trend, declining from 91.9 ± 10.1 years in Q1 to 79.3 ± 9.9 years in Q4. Sex distribution varied markedly, with men representing only 3.6% of Q1 but 83.8% of Q4. Higher ASMI was associated with greater educational level and elevated household income. Lifestyle behaviors also differed: regular exercise increased from 18.6% (Q1) to 42.3% (Q4), while smoking (Q1: 5.2%; Q4: 23.1%) and drinking (Q1: 6.7%; Q4: 24.3%) were more prevalent in higher quartiles. Comorbidities, including hypertension, diabetes, and stroke/cardiovascular disease, were more frequent in participants with higher ASMI. In contrast, dementia prevalence decreased from 3.2% (Q1) to 0.9% (Q4). Functional capacity outcomes showed poorer scores in both BADL (7.6 ± 2.8 in Q1 vs. 6.4 ± 1.5 in Q4) and IADL (16.7 ± 6.0 in Q1 vs. 11.0 ± 4.8 in Q4) among higher ASMI groups.
Associations between ASMI and BADL/IADL scores
As shown in Table 2, multivariable regression analyses demonstrated significant inverse associations between ASMI and functional capacity outcomes, for both BADL (Model 3: β = −0.072, 95% CI: −0.103 to −0.042) and IADL scores (Model 3: β = −0.225, 95% CI: −0.290 to −0.159) across all models. Trend analyses confirmed these patterns, showing significant dose–response relationships, with Q3 demonstrating the strongest effects for both BADL and IADL scores in the fully adjusted model. These nonlinear relationships were further supported by the patterns illustrated in Figure 2.
The correrations of appendicular skeletal muscle index with basic activities of daily living score (a) and instrumental activities of daily living score (b). Higher scores indicate greater functional dependence. Age, sex, years of schooling, marriage status, residence, household income per year, status of exercise, smoke, drink, hypertension, diabetes, stroke/cardiovascular disease, cancer, and dementia were adjusted.
Subgroup analysis
Subgroup analyses indicated differential associations between ASMI and functional decline (BADL/IADL) across demographic and clinical factors (Figure 3). For BADL (Figure 3a), significant interactions were observed for sex, residence, exercise, diabetes, and stroke/cardiovascular disease, with stronger negative effects in men (β = −0.118, 95% CI: −0.160 to −0.076), city residents (β = −0.198, 95% CI: −0.268 to −0.128), non-exercisers (β = −0.119, 95% CI: −0.161 to −0.078), diabetics (β = −0.158, 95% CI: −0.248 to −0.067), and stroke/cardiovascular patients (β = −0.244, 95% CI: −0.366 to −0.121). IADL (Figure 3b) showed significant interactions with residence, hypertension, and those with stroke/cardiovascular disease, with urban residents (β = −0.331, 95% CI: −0.466 to −0.197) and those with stroke/cardiovascular diseases (β = −0.529, 95% CI: −0.754 to −0.303) exhibiting steeper declines. Potential U-shaped nonlinear relationships stratified by age and sex are further illustrated in Figures 4, 5.
Subgroup analysis of the correrations of appendicular skeletal muscle index with basic activities of daily living score (a) and instrumental activities of daily living score (b). Higher scores indicate greater functional dependence. Age, sex, years of schooling, marriage status, residence, household income per year, status of exercise, smoke, drink, hypertension, diabetes, stroke/cardiovascular disease, cancer, and dementia were adjusted. In the subgroup analysis, the model is not adjusted for the stratification variable itself.
Curve associations between appendicular skeletal muscle index and basic activities of daily living score, stratified by age (a) and sex (b). Higher scores indicate greater functional dependence. Age, sex, years of schooling, marriage status, residence, household income per year, status of exercise, smoke, drink, hypertension, diabetes, stroke/cardiovascular disease, cancer, and dementia were adjusted. In the subgroup analysis, the model is not adjusted for the stratification variable itself.
Curve associations between appendicular skeletal muscle index and instrumental activities of daily living score, stratified by age (a) and sex (b). Higher scores indicate greater functional dependence. Age, sex, years of schooling, marriage status, residence, household income per year, status of exercise, smoke, drink, hypertension, diabetes, stroke/cardiovascular disease, cancer, and dementia were adjusted. In the subgroup analysis, the model is not adjusted for the stratification variable itself.
Threshold effect analysis
Threshold effect analysis revealed significant sex-specific associations between ASMI and functional capacity measures (Table 3). Distinct inflection points were observed at 6.2 kg/m^2^ for men and 5.2 kg/m^2^ for women. In men, ASMI demonstrated strong inverse associations with both BADL (β = −0.400, 95% CI: −0.515 to −0.285) and IADL scores (β = −1.009, 95% CI: −1.293 to −0.724) below the 6.2 kg/m^2^ threshold. Above this threshold, these associations became non-significant (BADL: β = −0.018, 95% CI: −0.075 to 0.039; IADL: β = 0.081, 95% CI: −0.059 to 0.222). Women exhibited a comparable pattern below the 5.2 kg/m^2^ threshold, with negative associations for both BADL (β = −0.152, 95% CI: −0.226 to −0.079) and IADL (β = −0.692, 95% CI: −0.839 to −0.545). Above this threshold, the relationships became positive (BADL: β = 0.091, 95% CI: 0.016 to 0.165; IADL: β = 0.291, 95% CI: 0.143 to 0.439). The robustness of these threshold effects was confirmed by log-likelihood ratio tests (all p < 0.001).
Discussion
Our cross-sectional study reveals a non-linear association between ASMI and functional capacity in older adults, characterized by sex-specific inflection points at 6.2 kg/m^2^ for men and 5.2 kg/m^2^ for women. These findings challenge the prevailing linear paradigm of muscle mass-function relationships and support the development of threshold-based, sex-specific interventions to mitigate functional decline in aging populations.
Skeletal muscle mass is a well-established determinant of physical function in older adults, and its decline is linked to adverse health outcomes, including disability and reduced quality of life (13, 14). The loss of muscle mass reflects not only structural deterioration but also functional impairment, manifesting as diminished muscle strength and power—critical factors for maintaining independence (15, 16). However, inconsistencies persist in the literature, with some studies reporting no significant association between muscle mass and functional decline (17). These discrepancies may stem from methodological heterogeneity, including variations in muscle mass quantification, differences in body size normalization, and divergent definitions of functional outcomes.
The Asian Working Group for Sarcopenia recommends calf circumference as a practical screening tool for muscle mass loss in community settings (18). Although anthropometric proxies such as calf circumference and predictive algorithms provide convenient estimates, their accuracy in determining total-body skeletal muscle mass remains limited, prompting ongoing investigations into more sophisticated measurement techniques (19, 20). Our use of a validated equation that incorporates calf circumference as a key variable, aligns with previous studies in Asian populations (12, 21, 22). Notably, skeletal muscle mass plays a critical role in functional prognosis across diverse clinical settings, including acute stroke recovery (23), and demonstrates sex- and location-dependent associations with disability risk (24) —findings that corroborate our stratified analyses.
Our identified thresholds (6.2 kg/m^2^ for men and 5.2 kg/m^2^ for women) provide important context when compared with established sarcopenia diagnostic criteria. The Asian Working Group for Sarcopenia 2019 consensus recommends ASMI cut-offs of <7.0 kg/m^2^ for men and <5.4 kg/m^2^ for women (18), while the European Working Group on Sarcopenia suggests <7.0 kg/m^2^ for men and <5.5 kg/m^2^ for women (25). Our anthropometrically derived thresholds are notably lower, which may reflect methodological differences between anthropometric estimation and direct measurement techniques, as well as our focus on functional outcomes rather than sarcopenia diagnosis. Importantly, our thresholds represent inflection points for functional capacity rather than diagnostic cut-offs, suggesting that functional decline may begin at muscle mass levels below current diagnostic thresholds. For screening applications, the Kawakami equation used in this study provides a practical and cost-efficient tool for estimating muscle mass in community settings. In contrast to resource-intensive techniques such as dual-energy X-ray absorptiometry or bioelectrical impedance analysis, this approach utilizes readily obtainable anthropometric parameters, enabling scalable deployment in primary care, community health programs, and large-scale public health initiatives. For intervention strategies, older adults with muscle mass below the identified sex-specific thresholds may benefit from intensive, multimodal interventions incorporating progressive resistance training, dietary protein optimization, and task-specific functional exercises.
The age-related decline in skeletal muscle mass and function is driven by multifaceted biological mechanisms, including reductions in muscle fiber number and size, as well as qualitative alterations in muscle proteins (26). Myokines, which are secreted by muscle cells during contraction, play a pivotal role in regulating muscle metabolism and systemic physical function through autocrine and endocrine signaling (27). Concurrently, mitochondrial dysfunction in aging muscle contributes to deficits in exercise performance, gait stability, and insulin sensitivity, even among physically active older adults (28). Interventions such as combined strength training and tai chi have demonstrated efficacy in augmenting muscle mass in sarcopenic individuals (29), while high-protein dietary strategies can mitigate muscle loss during energy deficit (30). These findings underscore the potential for targeted lifestyle interventions to ameliorate functional decline.
Our study leverages a large sample and rigorous adjustment for confounders. However, several limitations warrant consideration. First, the cross-sectional design precludes causal inference, as the observed associations may reflect reverse causation or bidirectional relationships between muscle mass and functional capacity. Longitudinal studies with repeated measures are needed to clarify temporal sequences, establish causality, and address these concerns. Second, our reliance on anthropometric equations rather than direct measurement methods introduces potential measurement error and may lead to overestimation or underestimation of true muscle mass in individual cases. Therefore, the identified thresholds should be interpreted with considerable caution in clinical settings and require validation using gold-standard measurement techniques. Third, our subgroup analyses, while informative, were exploratory and not adjusted for multiple comparisons. These findings should therefore be interpreted as generating hypotheses for future validation rather than confirming definitive subgroup differences. Fourth, although the BADL/IADL scales are validated, they may not fully capture the multidimensional nature of functional decline in older adults. These scales primarily assess basic tasks and may miss important domains such as balance, gait speed, endurance, and cognitive-motor integration. Fifth, our decision not to independently adjust for BMI or waist circumference as covariates—guided by the validated Kawakami equation methodology—may introduce potential confounding by adiposity in the muscle mass–function relationship, particularly given the positive associations observed above the sex-specific thresholds.
Conclusion
Our findings identify critical inflection points in the muscle mass-function relationship, suggesting that maintaining ASMI above sex-specific values (6.2 kg/m^2^ for men; 5.2 kg/m^2^ for women) is correlated with preserved autonomy in older adults. These observations highlight the potential value of moving beyond uniform recommendations toward precision strategies tailored to individual biomechanical and metabolic profiles. The results offer actionable insights for clinical practice and public health policy focused on supporting functional independence in aging populations.
The reference list from the paper itself. Each links out to its DOI / PubMed record.
- 1Gruber J Lin M Yang H Yi J. China's social health Insurance in the era of rapid population aging. JAMA Health Forum. (2025) 6:e 251105. doi: 10.1001/jamahealthforum.2025.1105, PMID: 40279110 · doi ↗ · pubmed ↗
- 2Wang H Qin D Fang L Liu H Song P. Addressing healthy aging in China: practices and prospects. Biosci Trends. (2024) 18:212–8. doi: 10.5582/bst.2024.01180, PMID: 38987161 · doi ↗ · pubmed ↗
- 3Bai R Liu Y Zhang L Dong W Bai Z Zhou M. Projections of future life expectancy in China up to 2035: a modelling study. Lancet Public Health. (2023) 8:e 915–22. doi: 10.1016/S 2468-2667(22)00338-3, PMID: 37004714 PMC 10188127 · doi ↗ · pubmed ↗
- 4Han Y Hu K Wu Y Fang Y. Future life expectancy with disability among elderly Chinese individuals: a forecast based on trends in stroke and dementia. Public Health. (2021) 198:62–8. doi: 10.1016/j.puhe.2021.06.013, PMID: 34364000 · doi ↗ · pubmed ↗
- 5Sayer AA Cooper R Arai H Cawthon PM Ntsama Essomba MJ Fielding RA. Sarcopenia. Nat Rev Dis Primers. (2024) 10:68. doi: 10.1038/s 41572-024-00550-w, PMID: 39300120 · doi ↗ · pubmed ↗
- 6Saponaro F Bertolini A Baragatti R Galfo L Chiellini G Saba A. Myokines and microbiota: new perspectives in the endocrine muscle-gut Axis. Nutrients. (2024) 16:4032. doi: 10.3390/nu 16234032, PMID: 39683426 PMC 11643575 · doi ↗ · pubmed ↗
- 7Nunes EA Stokes T Mc Kendry J Currier BS Phillips SM. Disuse-induced skeletal muscle atrophy in disease and nondisease states in humans: mechanisms, prevention, and recovery strategies. Am J Physiol Cell Physiol. (2022) 322:C 1068–c 1084. doi: 10.1152/ajpcell.00425.2021, PMID: 35476500 · doi ↗ · pubmed ↗
- 8Gauvain JB Mandigout S Pambet M Monseu M Gillain P Gautier J. Correlation between muscle mass and physical activity level in older adults at risk of falling: the FITNESS study. J Frailty Aging. (2024) 13:240–7. doi: 10.14283/jfa.2024.53, PMID: 39082768 · doi ↗ · pubmed ↗