Prognostic Implications of Thrombocytopenia in Chinese Patients With Newly Diagnosed Multiple Myeloma
Xiaojing Li, Xiaohui Lai, Xiaolin Wang, Qiang Liu, Xin Liu, Luqun Wang, Jun Peng, Ping Chen, Hai Zhou

TL;DR
Thrombocytopenia is linked to worse outcomes in Chinese patients with newly diagnosed multiple myeloma, even with modern treatments.
Contribution
Identifies thrombocytopenia as an independent prognostic factor in Chinese NDMM patients using a validated nomogram model.
Findings
Thrombocytopenia is associated with significantly worse progression-free and overall survival in NDMM patients.
A nomogram model incorporating thrombocytopenia and other factors accurately predicts PFS in NDMM patients.
NAIT improves overall response rates but not survival in thrombocytopenic NDMM patients.
Abstract
Thrombocytopenia is less common but shows high risk of early mortality in newly diagnosed multiple myeloma (NDMM) patients. In the era of novel agents‐based induction therapy (NAIT), it is unclear whether NAIT can overcome the poor prognosis associated with thrombocytopenia. To evaluate the prognostic implications of thrombocytopenia in NDMM patients. We retrospectively analyzed 1363 NDMM patients baseline characteristics, treatment response and survival, further performed regression analysis, constructed a nomogram model to predict progression free survival (PFS), and further internally validated this model. Overall, 211 (15.48%) NDMM patients were harboring thrombocytopenia, with advanced disease stages and worse outcomes. Their PFS (15 months vs 21.5 months, p < 0.001)and overall survival (47 months vs 77 months, p < 0.001) were significantly inferior compared with patients…
Genes, proteins, chemicals, diseases, species, mutations and cell lines named across the full text — each resolved to its canonical identifier and authoritative record.
Click any figure to enlarge with its caption.
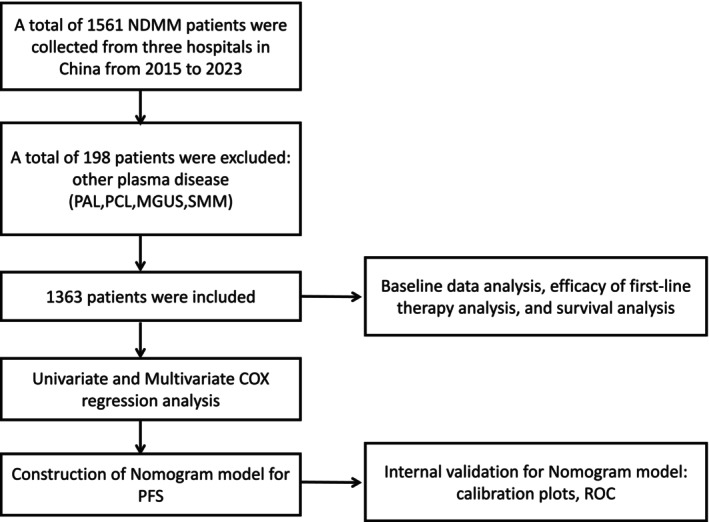 FIGURE 1
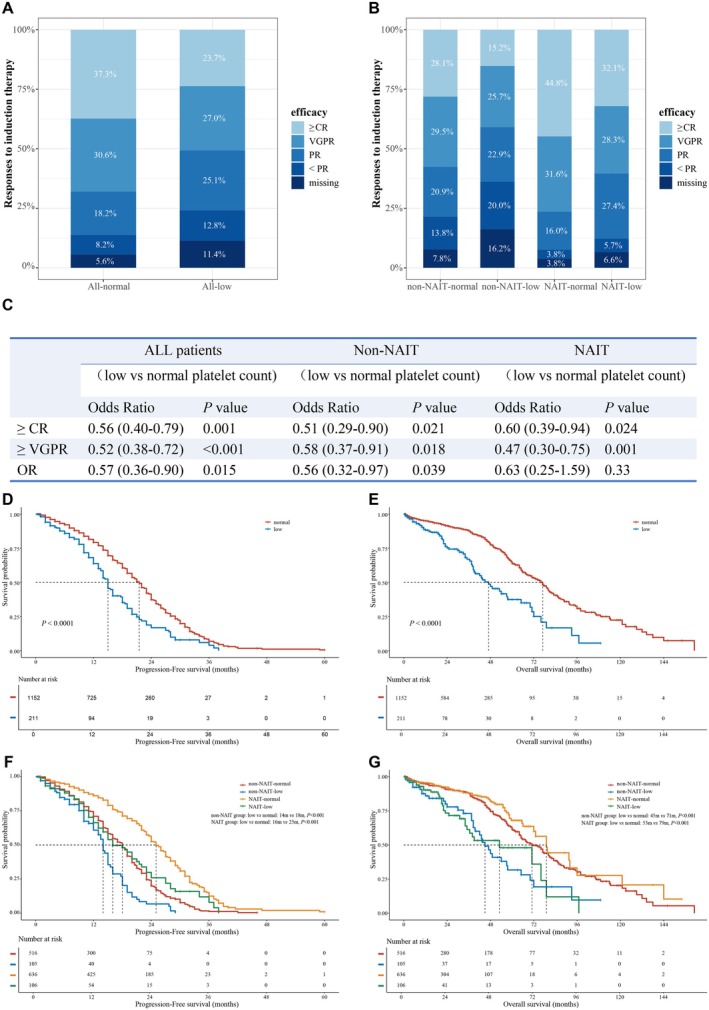 FIGURE 2
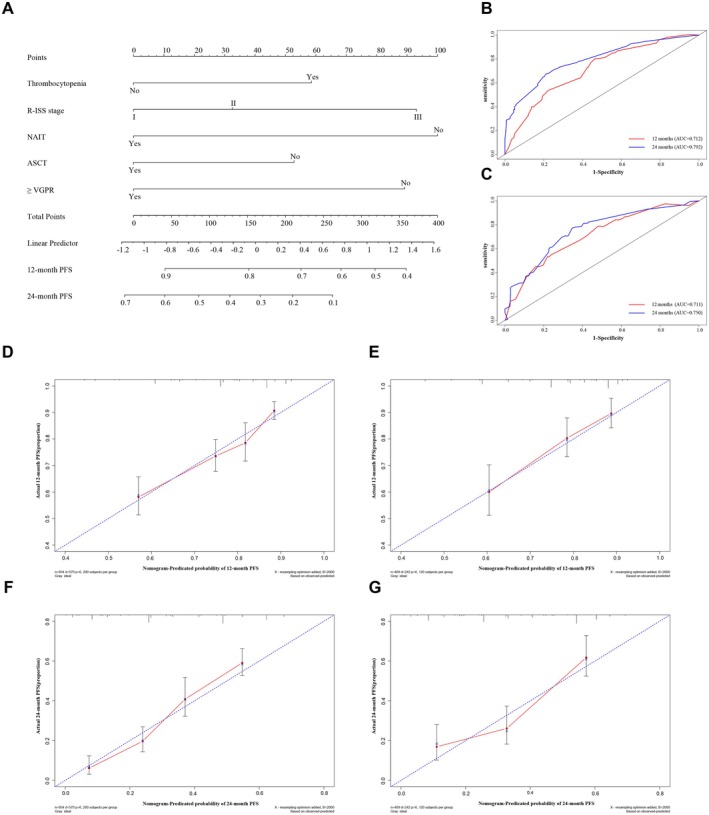 FIGURE 3
| Patients' characteristics | All patients ( | Patients without thrombocytopenia ( | Patients with thrombocytopenia ( |
|
|---|---|---|---|---|
| Sex | 0.006 | |||
| Female | 610 | 534 (46.4%) | 76 (36.0%) | |
| Male | 753 | 618 (53.6%) | 135 (64.0%) | |
| Age (Years) | 0.003 | |||
| < 60 | 668 | 577 (50.1%) | 91 (43.1%) | |
| 60–70 | 516 | 439 (38.1%) | 77 (36.5%) | |
| > 70 | 179 | 136 (11.8%) | 43 (20.4%) | |
| BMPCs (%) | < 0.001 | |||
| < 60 | 1147 | 995 (86.4%) | 152 (72.0%) | |
| ≥ 60 | 182 | 131 (11.4%) | 51 (24.2%) | |
| Missing | 34 | 26 (2.3%) | 8 (3.8%) | |
| Serum calcium (mmol/L) | 0.183 | |||
| < 2.65 | 1200 | 1020 (88.5%) | 180 (85.3%) | |
| ≥ 2.65 | 163 | 132 (11.5%) | 31 (14.7%) | |
| Serum creatinine (umol/L) | < 0.001 | |||
| < 177 | 1125 | 970 (84.2%) | 155 (73.5%) | |
| ≥ 177 | 238 | 182 (15.8%) | 56 (26.5%) | |
| Hb (g/L) | < 0.001 | |||
| ≥ 85 | 857 | 803 (69.7%) | 54 (25.6%) | |
| < 85 | 506 | 349 (30.3%) | 157 (74.4%) | |
| Bone destruction | 0.704 | |||
| < 3 sites | 686 | 578 (50.2%) | 108 (51.2%) | |
| ≥ 3 sites | 570 | 486 (42.2%) | 84 (39.8%) | |
| Missing | 107 | 88 (7.6%) | 19 (9.0%) | |
| DS stage | < 0.001 | |||
| I | 94 | 92 (8.0%) | 2 (0.9%) | |
| II | 338 | 315 (27.3%) | 23 (10.9%) | |
| III | 907 | 721 (62.6%) | 186 (88.2%) | |
| Missing | 24 | 24 (2.1%) | 0 (0.0%) | |
| β2‐MG (mg/L) | < 0.001 | |||
| < 5.5 | 784 | 716 (62.2%) | 68 (32.2%) | |
| ≥ 5.5 | 575 | 433 (37.6%) | 142 (67.3%) | |
| Missing | 4 | 3 (0.3%) | 1 (0.5%) | |
| Albumin (g/L) | < 0.001 | |||
| ≥ 35 | 804 | 710 (61.6%) | 94 (44.5%) | |
| < 35 | 559 | 442 (38.4%) | 117 (55.5%) | |
| ISS stage | < 0.001 | |||
| I | 356 | 337 (29.3%) | 19 (9.0%) | |
| II | 428 | 379 (32.9%) | 49 (23.2%) | |
| III | 575 | 433 (37.6%) | 142 (67.3%) | |
| Missing | 4 | 3 (0.3%) | 1 (0.5%) | |
| LDH | < 0.001 | |||
| Normal | 1047 | 911 (79.1%) | 136 (64.5%) | |
| Elevated | 316 | 241 (20.9%) | 75 (35.5%) | |
| HRCA | < 0.001 | |||
| No | 406 | 364 (31.6%) | 42 (19.9%) | |
| Yes | 503 | 403 (35.0%) | 100 (47.4%) | |
| Missing | 454 | 385 (33.4%) | 69 (32.7%) | |
| R‐ISS stage | < 0.001 | |||
| I | 160 | 155 (13.5%) | 5 (2.4%) | |
| II | 697 | 615 (53.4%) | 82 (38.9%) | |
| III | 271 | 188 (16.3%) | 83 (39.3%) | |
| Missing | 235 | 194 (16.8%) | 41 (19.4%) | |
| Treatment | 0.183 | |||
| Non‐NAIT | 621 | 516 (44.8%) | 105 (49.8%) | |
| NAIT | 742 | 636 (55.2%) | 106 (50.2%) | |
| VRD | 418 | 373 (58.6%) | 45 (42.5%) | |
| VTD | 170 | 140 (22.0%) | 30 (28.3%) | |
| VPD | 13 | 11 (1.7%) | 2 (1.9%) | |
| IRD/ITD | 33 | 27 (4.2%) | 6 (5.7%) | |
| KRD/KPD | 13 | 11 (1.7%) | 2 (1.9%) | |
| DVD/DKD/DID | 53 | 40 (6.3%) | 13 (12.3%) | |
| DRD/DPD | 15 | 13 (2.0%) | 2 (1.9%) | |
| DVRD/DKRD | 27 | 21 (3.3%) | 6 (5.7%) | |
| ASCT | 0.033 | |||
| No | 1032 | 860 (74.7%) | 172 (81.5%) | |
| Yes | 331 | 292 (25.3%) | 39 (18.5%) | |
| Response | < 0.001 | |||
| < PR | 122 | 95 (8.2%) | 27 (12.8%) | |
| PR | 263 | 210 (18.2%) | 53 (25.1%) | |
| VGPR | 410 | 353 (30.6%) | 57 (27.0%) | |
| CR and sCR | 480 | 430 (37.3%) | 50 (23.7%) | |
| Missing | 88 | 64 (5.6%) | 24 (11.4%) |
| Variables | Univariate analysis | Multivariate analysis | ||
|---|---|---|---|---|
| Hazard ratio (95% CI) |
| Hazard ratio (95% CI) |
| |
| Male | 1.01 (0.88–1.16) | 0.867 | — | — |
| Age > 60 years | 0.95 (0.83–1.09) | 0.488 | — | — |
| Thrombocytopenia | 1.76 (1.46–2.13) |
| 1.40 (1.14–1.72) |
|
| Ca ≥ 2.65 mmol/L | 1.34 (1.09–1.65) |
| 1.20 (0.96–1.50) | 0.107 |
| Cr ≥ 177umol/L | 1.40 (1.17–1.67) |
| 0.99 (0.81–1.22) | 0.94 |
| Hb < 85 g/L | 1.46 (1.27–1.69) |
| 1.18 (1.00–1.39) | 0.055 |
| Bone destruction < 3 sites | reference | |||
| Bone destruction ≥ 3 sites | 1.10 (0.95–1.27) | 0.19 | — | — |
| Missing | 1.26 (0.96–1.65) | 0.09 | ||
| ISS I | reference | |||
| ISS II | 1.10 (0.91–1.32) | 0.326 | 1.04 (0.80–1.35) | 0.764 |
| ISS III | 1.60 (1.35–1.90) |
| 1.01 (0.77–1.31) | 0.953 |
| R‐ISS I | reference | |||
| R‐ISS II | 1.37 (1.09–1.74) |
| 1.13 (0.83–1.55) | 0.431 |
| R‐ISS III | 2.38 (1.84–3.09) |
| 1.60 (1.13–2.28) |
|
| Missing | 1.59 (1.22–2.08) | 0.001 | 1.13 (0.84–1.52) | 0.427 |
| NAIT | 0.47 (0.41–0.54) |
| 0.52 (0.45–0.60) |
|
| ASCT | 0.59 (0.50–0.70) |
| 0.71 (0.60–0.85) |
|
| < VGPR | Reference | |||
| ≥ VGPR | 0.44 (0.38–0.52) |
| 0.53 (0.45–0.62) |
|
| Missing | 0.82 (0.59–1.13) | 0.215 | 0.83 (0.60–1.14) | 0.244 |
- —National Natural Science Foundation of China10.13039/501100001809
- —Taishan Scholar Foundation of Shandong Province10.13039/501100010029
- —Joint Funds for the Innovation of Science and Technology, Fujian Province
Peer Reviews
No public reviews on file for this paper yet. If you reviewed it on a platform where reviews are public (OpenReview, ICLR, NeurIPS, ICML), you can paste yours below so the community can read it here.
Videos
No videos yet. Explain this paper in a talk, walkthrough, or lecture? Add one.
Taxonomy
TopicsMultiple Myeloma Research and Treatments · Myeloproliferative Neoplasms: Diagnosis and Treatment · Platelet Disorders and Treatments
Introduction
1
Multiple myeloma (MM) is the second most common hematological malignancy, characterized by abnormal plasma cell proliferation and, consequently, leading to end‐organ damage [1, 2, 3, 4]. Anemia and thrombocytopenia can be seen in a subset of newly diagnosed MM (NDMM) patients [5]. Thrombocytopenia is less common but shows a high risk of early mortality [6]. In the development of the International Staging System (ISS) for MM in 2005, platelet count was applied in the preliminary prognostic factor analysis, univariate and multivariate survival analysis, and was found to be a powerful predictor of survival [7]. However, platelet count was not incorporated into ISS, and the prognostic value of thrombocytopenia in NDMM patients might have been underestimated. After nearly two decades with a great revolution in myeloma treatment and improvement of survival, Mao et al. developed an individualized and weighted myeloma prognostic score system (MPSS) in NDMM patients [8]. Thrombocytopenia was integrated into MPSS and assigned a point equal to that of ISS stage III and two or more high‐risk cytogenetic abnormalities (HRCA). Recent studies presented similar results that thrombocytopenia at diagnosis was linked to poor prognosis in MM patients [9, 10]. These previous reports highlighted the importance of thrombocytopenia in the risk stratification of NDMM patients.
Current international guidelines favor triplet or quadruplet induction regimens consisting of proteasome inhibitors, immunomodulatory agents, and monoclonal antibodies. Adequate induction therapy greatly improves the prognosis and survival of NDMM patients [11, 12]. Proteasome inhibitors combined with lenalidomide and dexamethasone are strongly recommended as the standard frontline induction regimens based on the superior progression‐free survival (PFS) and overall survival (OS) in the previously reported blockbuster studies in NDMM patients [13, 14, 15, 16, 17, 18, 19]. Recent studies have focused on whether the addition of monoclonal antibodies to triplet induction regimens can further improve the efficacy. Overall, the quadruplet regimens achieved better outcomes than the triplet regimens [20, 21, 22, 23]. However, it is unclear whether triplet or quadruplet induction regimens are sufficient for NDMM patients with thrombocytopenia.
This study aimed to evaluate the prognostic implications of thrombocytopenia in NDMM patients. We analyzed the baseline clinical features, responses to frontline induction therapy, and survival between NDMM patients with and without thrombocytopenia. Based on the results of Cox regression analysis, we constructed a nomogram to predict 12‐ and 24‐month PFS, and further validated this model.
Methods
2
Study Design and Participants
2.1
We conducted a retrospective, multi‐center study and enrolled 1363 NDMM patients who received induction therapies from three hospitals in China between January 2015 and December 2023. Diagnosis was in accordance with the International Myeloma Working Group (IMWG) criteria [24]. Patients diagnosed as primary amyloidosis (PAL), plasma cell leukemia (PCL), monoclonal gammopathy of undetermined significance (MGUS), and smoldering multiple myeloma (SMM) were excluded. The primary endpoint was PFS, and the secondary endpoints were responses and OS. The study was approved by the Ethical Committee of Qilu Hospital of Shandong University and conducted in accordance with the Declaration of Helsinki. Informed consents were obtained from patients before recruitment.
Thrombocytopenia was defined as an absolute platelet count less than 100,000/uL in peripheral blood in NDMM patients. Novel agents accessible to Chinese MM patients included proteasome inhibitors (bortezomib, ixazomib, and carfilzomib), immunomodulatory agents (thalidomide, lenalidomide, and pomalidomide), and anti‐CD38 monoclonal antibodies (daratumumab). In this study, novel agent‐based induction therapy (NAIT) was defined as a triplet or quadruplet induction regimen consisting of at least two novel agents and accompanying steroids.
IMWG consensus criteria for response assessment were used to evaluate the response and progression [25]. Patients were categorized as having stringent complete response (sCR), complete response (CR), very good partial response (VGPR), partial response (PR), stable disease (SD), and progressive disease (PD).
PFS was defined as the duration from diagnosis to disease progression, first relapse, death, or the end of follow‐up, whichever comes first. OS was defined as the duration from diagnosis to death or the end of follow‐up. Moreover, if patients' outcomes were not present at the end of follow‐up, such case information was defined as censored data [26].
Statistical Analysis
2.2
Baseline clinical characteristics of NDMM patients with low and normal platelet count were compared using the Chi‐square test and Fisher's exact test. Probabilities for PFS and OS were estimated using the Kaplan–Meier curve, and differences were tested for statistical significance using the two‐sided log‐rank test. We used univariate logistic regression analysis to investigate the impact of induction regimens and platelet count on efficacy, as well as univariate Cox regression analysis to evaluate the effects of variables on PFS and OS. Moreover, variables with statistical significance in the univariate Cox regression analysis and meeting the proportionality assumption were included in the subsequent multivariate Cox regression analysis. Missing data were considered as dummy variables.
The dataset was interpolated to form a complete dataset by random forest interpolation and later divided into the training and validation sets in a ratio of 7:3. Based on the results of multivariate Cox regression analysis, we constructed a nomogram for PFS in the complete dataset. Calibration plots and time‐dependent Receiver Operating Characteristic (ROC) curves were used to evaluate the predictive accuracy and conformity in training and validation datasets.
All statistical tests were two‐sided, and p values less than 0.05 were considered significant. All statistical analyses were performed in SPSS software version 26.0 (IBBM Corp). The Kaplan–Meier survival curves, the nomogram, time‐dependent ROC curve, and the calibration curves were constructed in R software version 4.3.3 (R Project for Statistical Computing, Vienna, Austria).
Results
3
Patient Characteristics
3.1
As shown in Figure 1, 1363 NDMM patients were analyzed. The incidence of thrombocytopenia in NDMM patients was 15.48% (211/1363, Table 1). The gerontal NDMM patients with thrombocytopenia were more than those with a normal platelet count, especially those over 70 years (20.4% vs 11.8%, p = 0.003). NDMM patients with thrombocytopenia presented a larger number of bone marrow plasma cells (p < 0.001), more advanced Durie‐Salmon (DS) stage (more severe anemia and hypercalcemia, p < 0.001), ISS stage [lower albumin and higher β2‐microglobulin (β2‐MG) levels, p < 0.001] and revised ISS (R‐ISS) stage [higher lactate dehydrogenase (LDH) levels and more patients with HRCA, p < 0.001] than patients with a normal platelet count (Table 1). NDMM patients with and without thrombocytopenia received comparable induction regimens. The most commonly used induction therapy was bortezomib, lenalidomide, and dexamethasone (VRD); the second most commonly used therapy was bortezomib, thalidomide, and dexamethasone (VTD); and then the triplet therapy consisting of daratumumab and proteasome inhibitors. After induction therapy, patients with a normal platelet count receiving autologous stem cell transplantation (ASCT) were a little more than patients with thrombocytopenia (25.3% vs 18.5%, p = 0.033). Interestingly, the ratio of males to females in NDMM patients with thrombocytopenia was 1.78, while this ratio was 1.16 in patients with a normal platelet count.
The flow diagram of the study. Abbreviations: MGUS, monoclonal gammopathy of undetermined significance; NDMM, newly diagnosed multiple myeloma; PAL, primary amyloidosis; PCL, plasma cell leukemia; PFS, progression‐free survival; ROC, Receiver operating characteristic analysis; SMM, smoldering multiple myeloma.
Responses to Induction Therapy
3.2
The overall response rates (ORR) were 86.1% and 75.8% in NDMM patients with normal and low platelet counts, respectively (p = 0.015, Figure 2A,C). NDMM patients with normal platelet counts achieved significantly better deep response (≥ VGPR) than thrombocytopenic patients (67.9% vs. 50.7%, p < 0.001, Figure 2A,C). The rate of sCR plus CR (≥ CR) in patients with normal platelet counts was also significantly higher than that in patients with thrombocytopenia (37.3% vs 23.7%, p = 0.001, Figure 2A,C). These results suggest that NDMM patients with thrombocytopenia have significantly worse efficacy.
Responses and survival of NDMM patients with and without thrombocytopenia. (A) Responses to induction therapy among patients with normal and low platelet counts. (B) Responses of patients with and without thrombocytopenia receiving non‐NAIT and NAIT regimens, respectively. (C) Univariate logistic analysis of the effect of platelet count on efficacy in all patients, patients receiving non‐NAIT and NAIT regimens, respectively. (D) Progression‐free survival (PFS) between NDMM patients with normal and low platelet counts. (E) Overall survival (OS) between NDMM patients with normal and low platelet counts. (F) Progression‐free survival (PFS) of NDMM patients with normal and low platelet counts receiving non‐NAIT and NAIT regimens, respectively. (G) Overall survival (OS) of NDMM patients with normal and low platelet counts receiving non‐NAIT and NAIT regimens, respectively. NDMM, newly diagnosed multiple myeloma; NAIT, novel agents‐based induction therapy; CR, complete response; VGPR, very good partial response; PR, partial response; OR, overall response.
NAIT regimens induced remarkably superior efficacy than non‐NAIT therapies in NDMM patients with normal and low platelet counts (Figure S1 and Table S1). To evaluate whether NAIT regimens showed benefits in NDMM patients with thrombocytopenia, we next analyzed the responses to NAIT in NDMM patients and found that the deep response (≥ VGPR) rate in patients with thrombocytopenia was significantly lower than that in patients with normal platelet counts (60.4% vs 76.4%, p = 0.001, Figure 2B,C), however, no significant difference was observed in OR rates between patients with or without thrombocytopenia (87.8% vs 92.4%, p = 0.33, Figure 2B,C). This indicates that NAIT can improve overall response but not deep response in NDMM patients with thrombocytopenia.
In NDMM patients receiving non‐NAIT regimens, both overall and deep response rates in patients with thrombocytopenia were significantly lower than those in patients without thrombocytopenia (ORR: 63.8% vs 78.5%, p = 0.039; ≥ VGPR: 40.9% vs 57.6%, p = 0.018; respectively, Figure 2B,C).
Survival Outcomes
3.3
With a median follow‐up of 27 months, both PFS and OS in NDMM patients with thrombocytopenia were significantly worse than those in patients with normal platelet counts (median PFS: 15 vs 21.5 months, p < 0.001; median OS: 47 vs 77 months, p < 0.001, respectively; Figure 2D,E). In subgroup analyses of survival, PFS, and OS of patients in different DS, ISS, and R‐ISS stages were compared between patients with and without thrombocytopenia (Figure S2). In general, the outcomes in patients with thrombocytopenia at different stages were inferior to those in patients with normal platelet counts.
Induction regimens and platelet counts were included in Kaplan–Meier analysis to further investigate the impacts of these two factors on PFS and OS. As shown in Figure 2F,G, among patients with NAIT regimens, both PFS and OS of patients with thrombocytopenia were significantly shorter than those of patients with normal platelet counts (median PFS: 16 vs 25 months, p < 0.001, median OS: 53 vs 79 months, p < 0.001, respectively). In patients with non‐NAIT regimens, the outcomes of patients with thrombocytopenia were also significantly worse than those of patients with normal platelet counts (median PFS: 14 vs 18 months, p < 0.001; median OS: 45 vs 71 months, p < 0.001, respectively). Neither NAIT nor non‐NAIT regimens improved the survival of patients with thrombocytopenia.
Univariate and multivariate Cox analyses for PFS and OS were presented in Tables 2 and S2, respectively. In the multivariate analysis for PFS (Table 2), thrombocytopenia [hazard ratio (95% confidence interval, 95% CI) 1.40 (1.14–1.72), p = 0.001] and R‐ISS III [1.60 (1.13–2.28), p = 0.009] were associated with worse PFS. In contrast, NAIT [0.52 (0.45–0.60), p < 0.001], ASCT [0.71 (0.60–0.85), p < 0.001], and achieving deep response (≥ VGPR) [0.53 (0.45–0.62), p < 0.001] were associated with better PFS. Similarly, in the multivariate analysis for OS (Table S2), thrombocytopenia [1.74 (1.29–2.35), p < 0.001] and R‐ISS stage III [2.07 (1.10–3.90), p = 0.023] were associated with worse OS. In contrast, ASCT [0.69 (0.49–0.97), p = 0.033] and achieving deep response (≥ VGPR) [0.57 (0.45–0.73), p < 0.001] were associated with better OS.
Nomogram Construction and Validation
3.4
Based on the results of multivariate regression analysis, thrombocytopenia, R‐ISS stage, NAIT, ASCT, and deep response (≥ VGPR) were used to construct a nomogram predicting 12 and 24‐month PFS in the complete dataset (Figure 3A). The baseline characteristics of the training group and validation group were presented in Table S3 with no significant bias. ROC analysis was used to assess the discrimination of the nomogram. The area under the curve (AUC) for the training nomogram model demonstrated values of 0.712 at 12 months and 0.792 at 24 months, whereas the validation nomogram model yielded AUCs of 0.711 and 0.750 at 12 and 24‐month intervals, respectively (Figure 3B,C). The calibration curves for the probability of 12 and 24‐month PFS demonstrated a good agreement between the actual reported and the predicted PFS (Figure 3D–G). Our nomogram model effectively predicted PFS for NDMM patients.
The nomogram for the prediction of PFS in NDMM patients. (A) Thrombocytopenia, R‐ISS stage, NAIT, ASCT, and deep response (≥ VGPR) were used to construct a nomogram predicting 12 and 24‐month PFS. (B) The area under the curve (AUC) for the training nomogram model demonstrated values of 0.712 at 12 months and 0.792 at 24 months. (C) The validation nomogram model yielded AUC of 0.711 at 12 months and 0.750 at 24 months. (D‐G) Calibration curves of the nomogram in terms of the agreement between predicted and observed 12‐month PFS in the training group (D) and validation group (E), and 24‐month PFS in the training group (F) and in the validation group (G), respectively. PFS, progression‐free survival; NDMM, newly diagnosed multiple myeloma; R‐ISS, Revised International Staging System; NAIT, novel agents‐based induction therapy; ASCT, autologous stem cell transplantation; VGPR, very good partial response.
Discussion
4
In this multicenter retrospective study, we analyzed the clinical characteristics, responses to induction therapy, and survival of NDMM patients with and without thrombocytopenia, performed regression analysis, and constructed a nomogram model to predict PFS. We found that NDMM patients with thrombocytopenia showed a larger number of bone marrow plasma cells, more advanced disease stages, and worse outcomes than patients without thrombocytopenia. NAIT could improve overall response, but not deep response or survival in NDMM patients with thrombocytopenia. Multivariate regression analysis proposed that thrombocytopenia, together with R‐ISS stage III, NAIT, ASCT, and deep response, were significantly correlated with survival.
Thrombocytopenia is less common in NDMM patients, and its cut‐off value varies across different studies. This study, conducted in China, defined thrombocytopenia as a platelet count of less than 100,000/uL. In this situation, the incidence of thrombocytopenia in NDMM patients was approximately 15%, which was in line with previously reported data [7, 8, 10]. The presence of thrombocytopenia in NDMM patients significantly correlated with invasive clinical manifestations, including high myeloma burden, severe anemia, low albumin levels, renal failure, and elevated β2‐MG and LDH levels. These factors, along with HRCA, are important indicators for MM disease staging and risk stratification. Charalampous et al. analyzed the association of thrombocytopenia with disease burden, HRCA, and survival in NDMM patients from Mayo Clinic and found that thrombocytopenia was associated with mortality independently [10]. They demonstrated that thrombocytopenia was significantly associated with t (4;14) and t (14;16) [10]. Due to the cost and accessibility of the fluorescence in situ hybridization (FISH) test, part of the NDMM patients in our study failed to complete the FISH test, resulting in some missing data in the risk stratification of cytogenetics. We failed to present the exact correlation between thrombocytopenia and a specific cytogenetic abnormality. However, we found that NDMM patients with thrombocytopenia had a higher proportion of HRCA based on the available data. Compared to NDMM patients with normal platelet counts, those with thrombocytopenia were more frequently classified into DS stage III, ISS stage III, and R‐ISS stage III. Moreover, thrombocytopenic patients in stage III demonstrated the worst OS and PFS. These findings are consistent with previous studies indicating that thrombocytopenic patients carry a higher tumor burden, more aggressive disease, and an overall poor prognosis [9, 10]. Platelets, which are components of blood, are differentiated and matured from hematopoietic stem cells [27]. The number of platelets reflects the hematopoietic function and maturation status of the bone marrow [28]. Meanwhile, plasma cell malignant proliferation and cytokine secretion, which form a negative microenvironment [29, 30], can decrease platelet production [9].
Interestingly, our study demonstrated that male NDMM patients were more likely to have thrombocytopenia. Other studies reported similar results that the percentage of male patients with thrombocytopenia was higher than that of female myeloma patients [9, 10], suggesting that male patients were susceptible to thrombocytopenia at diagnosis. This observation may be attributed to the potential role of androgens in upregulating thrombopoietin (TPO) synthesis [31]. Notably, multiple studies have demonstrated an inverse correlation between circulating TPO levels and platelet counts in multiple myeloma [32, 33]. NDMM patients with or without thrombocytopenia in our study received comparable induction regimens. However, the percentage of NDMM patients with normal platelet count receiving ASCT was a little higher than that of patients with thrombocytopenia, mainly due to the better performance status and younger age in patients with normal platelet count.
Survival in MM patients has improved significantly during the past two decades in China and around the world [34, 35, 36, 37]. Numerous combinations for initial therapy have been developed based on novel agents that have shown apparent efficacy [12, 38]. Recent studies have established and further consolidated triplet and quadruplet regimens in the management of MM patients [39, 40, 41, 42]. The most commonly recommended induction regimens are triplet and quadruplet regimens consisting of proteasome inhibitors, immunomodulatory agents, and monoclonal antibodies [3, 37]. To investigate whether NAIT can overcome the poor prognosis associated with thrombocytopenia, we compared the outcomes and survival of NDMM patients with and without thrombocytopenia receiving NAIT regimens. We found that NDMM patients with thrombocytopenia had poor outcomes and survival. NAIT significantly improved the ORR of patients with thrombocytopenia close to that of patients with a normal platelet count. But unfortunately, NAIT failed to achieve a satisfactory deep response and thus did not prolong their survival in NDMM patients with thrombocytopenia. NDMM patients with a normal platelet count who received NAIT had the longest PFS and OS, followed by those with a normal platelet count receiving non‐NAIT and those with thrombocytopenia receiving NAIT, respectively. NDMM patients with thrombocytopenia who received non‐NAIT had the worst survival. NAIT regimens induced better outcomes and improved survival of NDMM patients compared with non‐NAIT treatments. The improvement of the quality of response is associated with better disease control and longer survival [43, 44, 45]. The achievement of maximal response should be strongly considered in eligible patients.
The prognosis evaluation and risk stratification of MM patients were complex and variable [46, 47, 48, 49, 50]. We performed univariate and multivariate analyses for PFS and OS, and found that thrombocytopenia, R‐ISS stage III, NAIT, ASCT, and deep response were significantly correlated with survival. These five factors were used to construct a nomogram to predict 12 and 24‐month PFS with reliable predictive ability. Recently, Maura F et al. integrated clinical, genomic, and therapeutic data to build a model predicting individualized risk in NDMM patients [51]. This model is an online available tool including patients' demographics, ISS, IGH translocations, genomics, induction, and post‐induction therapies. They developed an individualized risk‐prediction model enabling personally tailored therapeutic decisions for NDMM patients. In our study, induction therapy, response to induction therapy, and ASCT were also included in the construction of the nomogram model based on the results of multivariate Cox regression analysis, and these factors played important roles in predicting PFS. Most existing risk stratification models in multiple myeloma have not included platelet count as a laboratory feature [37, 52], unless the MPSS risk model, which incorporates platelet count and improves the risk estimation in NDMM patients [8]. The inclusion of thrombocytopenia as a high‐risk factor in the prognosis of multiple myeloma is controversial. Our results suggest that NDMM patients with thrombocytopenia have poor prognosis, similar to that of patients with high‐risk MM [47, 52].
Our findings are based on a retrospective observational study, which has certain limitations. First, the most commonly used two induction therapies in our study are VRD and VTD. The percentage of patients receiving induction regimens consisting of daratumumab and carfilzomib is relatively low. Therefore, the effects of regimens composed of monoclonal antibodies, new generation proteasome inhibitors, and immunomodulatory agents in NDMM patients with thrombocytopenia need to be further confirmed. Second, we used random forest interpolation in constructing the nomogram and dummy variables in multifactor Cox regression to deal with some missing data. Although good internal verification results are obtained, this model needs to be further validated by external data.
In conclusion, thrombocytopenia in NDMM patients significantly affects responses to induction therapy and survival. Thrombocytopenia should be regarded as an independent prognostic factor in the risk stratification of Chinese NDMM patients.
Author Contributions
All data are available from the corresponding author upon reasonable request. CRediT authorship contribution statement: Hai Zhou: conceptualization, methodology, data curation, funding acquisition, project administration, writing, original draft, writing, review and editing, supervision, and resources. Ping Chen: conceptualization, methodology, data curation, funding acquisition, project administration, writing, original draft, writing, review and editing, supervision, and resources. Xiaojing Li: methodology, software, data curation, investigation, validation, formal analysis, writing, original draft, writing, review and editing. Xiaohui Lai: data curation, investigation, validation, and writing, review and editing. Xiaolin Wang: data curation, investigation, validation, and writing, review and editing. Qiang Liu: validation, and writing, review and editing. Xin Liu: validation, and writing, review and editing. Luqun Wang: validation, and writing, review and editing. Jun Peng: validation, funding acquisition, and writing, review and editing.
Conflicts of Interest
The authors declare no conflicts of interest.
Supporting information
Figure S1. Responses of NDMM patients receiving non‐NAIT and NAIT regimens. Figure S2. Progression‐free survival (PFS) and overall survival (OS) of NDMM patients in different DS (A and B), ISS (C and D), and R‐ISS (E and F) stages were compared between patients with and without thrombocytopenia. Table S1. Univariate logistic analysis of the effect of induction therapies on efficacy in all patients, patients with normal and low platelet count, respectively. Table S2. Univariate and multivariate Cox analyses for overall survival (OS). Table S3. Baseline characteristics for the entire cohort, training group, and validation group after random forest interpolation.
The reference list from the paper itself. Each links out to its DOI / PubMed record.
- 1A. J. Cowan , C. Allen , A. Barac , et al., “Global Burden of Multiple Myeloma: A Systematic Analysis for the Global Burden of Disease Study 2016,” JAMA Oncology 4, no. 9 (2018): 1221–1227.29800065 10.1001/jamaoncol.2018.2128 PMC 6143021 · doi ↗ · pubmed ↗
- 2N. van de Donk , C. Pawlyn , and K. L. Yong , “Multiple myeloma,” Lancet 397, no. 10272 (2021): 410–427.33516340 10.1016/S 0140-6736(21)00135-5 · doi ↗ · pubmed ↗
- 3A. J. Cowan , D. J. Green , M. Kwok , et al., “Diagnosis and Management of Multiple Myeloma: A Review,” JAMA 327, no. 5 (2022): 464–477.35103762 10.1001/jama.2022.0003 · doi ↗ · pubmed ↗
- 4J. Liu , W. Liu , L. Mi , et al., “Incidence and Mortality of Multiple Myeloma in China, 2006‐2016: An Analysis of the Global Burden of Disease Study 2016,” Journal of Hematology & Oncology 12, no. 1 (2019): 136.31823802 10.1186/s 13045-019-0807-5PMC 6905074 · doi ↗ · pubmed ↗
- 5R. A. Kyle , M. A. Gertz , T. E. Witzig , et al., “Review of 1027 Patients With Newly Diagnosed Multiple Myeloma,” Mayo Clinic Proceedings 78, no. 1 (2003): 21–33.12528874 10.4065/78.1.21 · doi ↗ · pubmed ↗
- 6H. Terebelo , S. Srinivasan , M. Narang , et al., “Recognition of Early Mortality in Multiple Myeloma by a Prediction Matrix,” American Journal of Hematology 92, no. 9 (2017): 915–923.28543165 10.1002/ajh.24796 PMC 5601204 · doi ↗ · pubmed ↗
- 7P. R. Greipp , J. San Miguel , B. G. Durie , et al., “International Staging System for Multiple Myeloma,” Journal of Clinical Oncology 23, no. 15 (2005): 3412–3420.15809451 10.1200/JCO.2005.04.242 · doi ↗ · pubmed ↗
- 8X. Mao , W. Yan , D. Mery , et al., “Development and Validation of an Individualized and Weighted Myeloma Prognostic Score System (MPSS) in Patients With Newly Diagnosed Multiple Myeloma,” American Journal of Hematology 99, no. 4 (2024): 523–533.38247315 10.1002/ajh.27207 PMC 10947864 · doi ↗ · pubmed ↗