Evaluating the Impact of Preoperative Motor Response and Dural Opening Timing on Outcome Prediction in Patients With Severe Brain Injuries and Intradural Pathologies: An Observational Study
A Sathia Prabhu, Kapil Patil

TL;DR
This study compares the usefulness of preoperative motor scores and GCS in predicting outcomes for severe brain injury patients and finds they are similarly effective.
Contribution
The study introduces the preoperative motor score as a comparable alternative to the GCS for outcome prediction in severe TBI patients.
Findings
Good recovery was observed in 18.6% of patients, while 51.2% had poor outcomes.
Higher preadmission and preoperative GCS and Mscores were linked to better outcomes.
Earlier surgical intervention may improve outcomes, though no single predictor reached statistical significance.
Abstract
Background Traumatic brain injury (TBI) is a leading cause of death and disability, particularly in low- and middle-income countries. While the Glasgow Coma Scale (GCS) is widely used for prognostication, its utility is limited in certain scenarios. This study evaluates the prognostic accuracy of the preoperative motor score (Mscore) versus total GCS and explores the impact of surgical timing on outcomes. Methods In a prospective cohort study at a tertiary care center, 86 adults (GCS ≤8) undergoing surgery for intradural pathologies were followed. Preoperative clinical parameters, surgical timings (including dural opening time), and radiological findings were recorded. At three months, outcomes were assessed using the Glasgow Outcome Scale-Extended (GOS-E). Statistical analyses included receiver operating characteristic (ROC) curve comparison and multivariable logistic regression.…
Genes, proteins, chemicals, diseases, species, mutations and cell lines named across the full text — each resolved to its canonical identifier and authoritative record.
Click any figure to enlarge with its caption.
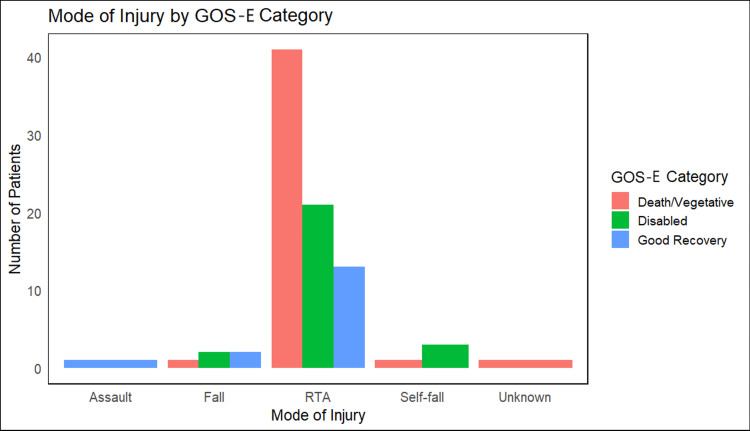 Figure 1
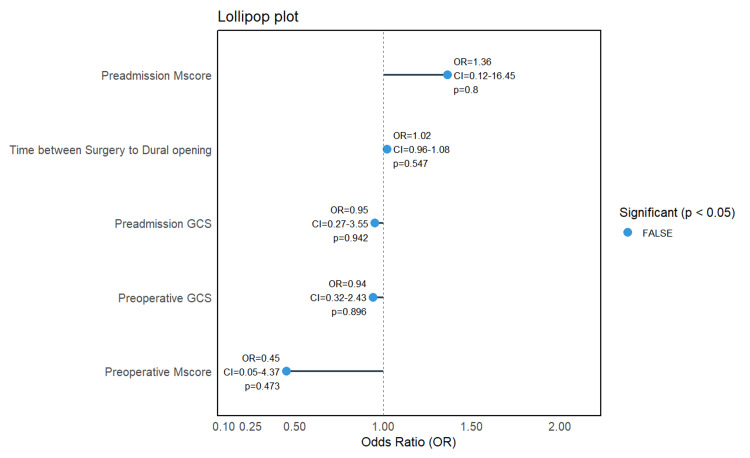 Figure 2
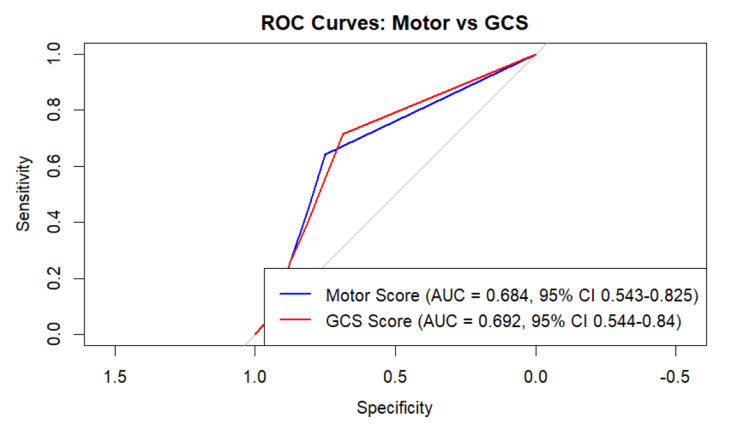 Figure 3
| GOS-E parameters | Death/vegetative | Disabled | Good recovery | Statistic# | P-value |
| n | 44 | 26 | 16 | - | - |
| Age (median (IQR)) | 47.00 (32.75, 58.50) | 38.50 (28.00, 50.75) | 32.00 (28.75, 48.00) | 4.05 | 0.132 |
| Female (%) | 7 (15.9) | 5 (19.2) | 1 (6.2) | 1.34 | 0.51 |
| Mode of injury (%) | |||||
| Assault | 0 (0.0) | 0 (0.0) | 1 (6.2) | 11.97 | 0.235 |
| Fall | 1 (2.3) | 2 (7.7) | 2 (12.5) | ||
| RTA | 41 (93.2) | 21 (80.8) | 13 (81.2) | ||
| Self-fall | 1 (2.3) | 3 (11.5) | 0 (0.0) | ||
| Unknown | 1 (2.3) | 0 (0.0) | 0 (0.0) | ||
| Preadmission Mscore (mean (SD)) | 3.27 (1.39) | 4.12 (1.07) | 4.38 (1.26) | 6.06 | 0.004 |
| Preadmission GCS (mean (SD)) | 5.59 (1.72) | 6.69 (1.44) | 7.06 (1.65) | 6.54 | 0.002 |
| Preoperative Mscore (mean (SD)) | 3.27 (1.34) | 4.15 (1.05) | 4.38 (1.26) | 6.66 | 0.002 |
| Preoperative GCS (mean (SD)) | 5.56 (1.61) | 6.58 (1.30) | 7.19 (1.94) | 7.31 | 0.001 |
| Right pupillary diameter (mm) (mean (SD)) | 2.40 (0.65) | 2.29 (0.53) | 2.25 (0.58) | 0.47 | 0.626 |
| Left pupillary diameter (mm) (mean (SD)) | 2.31 (0.65) | 2.21 (0.64) | 2.06 (0.44) | 0.96 | 0.389 |
| Intubation | 6 (13.6) | 5 (19.2) | 9 (56.2) | 17.64 | 0.001 |
| Pulse (bpm) (mean (SD)) | 87.48 (19.26) | 87.58 (15.39) | 84.56 (16.75) | 0.18 | 0.835 |
| Systolic blood pressure (mmHg) (mean (SD)) | 122.27 (24.01) | 125.54 (13.27) | 121.62 (17.35) | 0.27 | 0.764 |
| Diastolic blood pressure (mmHg) (mean (SD)) | 74.45 (12.82) | 76.65 (10.83) | 76.00 (10.56) | 0.31 | 0.737 |
| Respiratory rate (breaths/min) (mean (SD)) | 18.55 (5.29) | 16.58 (3.25) | 18.44 (5.23) | 1.51 | 0.226 |
| Contusion (%) | 9 (20.5) | 5 (19.2) | 4 (25.0) | 0.21 | 0.9 |
| Subdural hematoma (%) | 8 (18.2) | 5 (19.2) | 4 (25.0) | 0.35 | 0.839 |
| Subarachnoid hemorrhage (%) | 29 (65.9) | 19 (73.1) | 13 (81.2) | 1.42 | 0.491 |
| Basal cistern effacement (%) | 36 (90.0) | 18 (72.0) | 10 (62.5) | 6.28 | 0.043 |
| Midline shift (mm) (mean (SD)) | 6.59 (4.34) | 5.99 (4.59) | 4.90 (2.76) | 0.97 | 0.382 |
| Total operative duration (hours) (mean (SD)) | 3.26 (0.94) | 4.46 (6.28) | 3.55 (1.13) | 0.96 | 0.388 |
| Time from injury to casualty admission (hours) (mean (SD)) | 6.83 (11.07) | 11.29 (14.40) | 11.79 (14.09) | 0.29 | 0.245 |
| Time between casualty admission and surgery (hours) (mean (SD)) | 10.92 (10.93) | 12.12 (8.80) | 13.42 (16.87) | 0.28 | 0.752 |
| Time between surgery and dural opening (minutes) (mean (SD)) | 47.95 (8.58) | 46.54 (5.43) | 47.19 (8.16) | 0.28 | 0.754 |
| Time between casualty admission and dural opening (hours) (mean (SD)) | 18.55 (14.85) | 24.39 (15.61) | 26.00 (19.70) | 1.78 | 0.175 |
| Duration on ventilator (days) (mean (SD)) | 3.89 (3.00) | 2.58 (2.42) | 1.56 (1.09) | 5.43 | 0.006 |
| Length of hospital stay (days) (mean (SD)) | 7.84 (5.02) | 7.65 (3.21) | 9.94 (10.01) | 0.9 | 0.41 |
| Hospital mortality (%) | 25 (56.8) | 0 (0.0) | 0 (0.0) | 33.64 | <0.001 |
| All-cause mortality (%) | 42 (95.5) | 0 (0.0) | 0 (0.0) | 77.36 | <0.001 |
| GOS-E parameters | Non-survivors | Survivors | Statistic# | P-value |
| n | 42 | 43 | - | - |
| Age (median (IQR)) | 44.71 (15.06) | 39.47 (13.56) | 1095.5 | 0.095 |
| Female (%) | 7 (16.7) | 5 (11.6) | 0.13 | 0.72 |
| Mode of injury (%) | ||||
| Assault | 0 (0.0) | 1 (2.3) | 5.01 | 0.315 |
| Fall | 1 (2.4) | 4 (9.3) | ||
| RTA | 39 (92.9) | 35 (81.4) | ||
| Self-fall | 1 (2.4) | 3 (7.0) | ||
| Unknown | 1 (2.4) | 0 (0.0) | ||
| Preadmission Mscore (mean (SD)) | 3.24 (1.39) | 4.19 (1.14) | -3.43 | 0.001 |
| Preadmission GCS (mean (SD)) | 5.57 (1.74) | 6.77 (1.51) | -3.38 | 0.001 |
| Preoperative Mscore ≤3 | 23 (54.8) | 10 (23.3) | 4.19 | 0.006 |
| Preoperative GCS ≤5 | 20 (48.8) | 9 (20.9) | 6.02 | 0.014 |
| Right pupillary diameter (mm) (mean (SD)) | 2.42 (0.66) | 2.27 (0.54) | 1.14 | 0.257 |
| Left pupillary diameter (mm) (mean (SD)) | 2.32 (0.66) | 2.15 (0.56) | 1.28 | 0.204 |
| Intubation | 5 (11.9) | 14 (32.6) | 6.5 | 0.039 |
| Pulse (bpm) (mean (SD)) | 88.12 (19.25) | 86.09 (16.04) | 0.53 | 0.599 |
| Systolic blood pressure (mmHg) (mean (SD)) | 122.86 (24.43) | 123.26 (14.96) | -0.09 | 0.928 |
| Diastolic blood pressure (mmHg) (mean (SD)) | 74.43 (13.08) | 76.26 (10.52) | -0.71 | 0.479 |
| Respiratory rate (breaths/min) (mean (SD)) | 18.48 (5.33) | 17.49 (4.21) | 0.95 | 0.345 |
| Contusion (%) | 9 (21.4) | 9 (20.9) | 0 | 1 |
| Subdural hematoma (%) | 8 (19.0) | 9 (20.9) | 0 | 1 |
| Subarachnoid hemorrhage (%) | 27 (64.3) | 33 (76.7) | 1.05 | 0.31 |
| Basal cistern effacement (%) | 34 (89.5) | 30 (69.8) | 3.61 | 0.06 |
| Midline shift (mm) (mean (SD)) | 6.57 (4.42) | 5.61 (3.97) | 1.06 | 0.294 |
| Total operative duration (hours) (mean (SD)) | 3.28 (0.96) | 4.07 (4.92) | -1.04 | 0.306 |
| Time from injury to casualty admission (hours) (mean (SD)) | 6.95 (11.32) | 11.15 (13.86) | -0.63 | 0.131 |
| Time between casualty admission and surgery (hours) (mean (SD)) | 10.90 (11.18) | 12.49 (12.18) | 0.67 | 0.532 |
| Time between surgery and dural opening (minutes) (mean (SD)) | 47.98 (8.77) | 46.86 (6.46) | 0.67 | 0.505 |
| Time between casualty admission and dural opening (hours) (mean (SD)) | 18.65 (15.20) | 24.42 (16.91) | 1.06 | 0.102 |
| Postoperative Mscore ≤3 | 11 (29.7) | 4 (9.3) | 7.6 | 0.041 |
| Duration on ventilator (days) (mean (SD)) | 3.74 (2.68) | 2.42 (2.63) | 2.29 | 0.024 |
| Length of hospital stay (days) (mean (SD)) | 7.64 (4.87) | 8.74 (6.73) | -0.87 | 0.391 |
| Variable | OR | 95% CI lower | 95% CI upper | SE | P-value |
| (Intercept) | 0.25 | 0.00 | 87.22 | 2.98 | 0.64 |
| Age | 1.04 | 1.00 | 1.08 | 0.02 | 0.05 |
| Female | 1.46 | 0.33 | 6.72 | 0.76 | 0.62 |
| Preadmission Mscore | 3.64 | 0.16 | 84.93 | 1.57 | 0.41 |
| Preadmission Glasgow Coma Scale | 0.60 | 0.12 | 2.90 | 0.81 | 0.52 |
| Preoperative Mscore | 0.30 | 0.02 | 6.39 | 1.49 | 0.41 |
| Preoperative Mscore ≤3 | 1.47 | 0.33 | 6.04 | 0.74 | 0.60 |
| Preoperative Glasgow Coma Scale | 0.32 | 0.06 | 1.55 | 0.82 | 0.17 |
| Intubation | 1.00 | 0.94 | 1.08 | 0.03 | 0.90 |
| Time between surgery and dural opening | 1.21 | 0.96 | 1.58 | 0.12 | 0.13 |
| Duration on ventilator | 3.14 | 0.25 | 46.92 | 1.32 | 0.39 |
| Length of hospital stay | 0.91 | 0.80 | 1.02 | 0.06 | 0.13 |
Peer Reviews
No public reviews on file for this paper yet. If you reviewed it on a platform where reviews are public (OpenReview, ICLR, NeurIPS, ICML), you can paste yours below so the community can read it here.
Videos
No videos yet. Explain this paper in a talk, walkthrough, or lecture? Add one.
Taxonomy
TopicsTraumatic Brain Injury and Neurovascular Disturbances · Traumatic Brain Injury Research · Spinal Fractures and Fixation Techniques
Introduction
Head trauma remains a leading cause of mortality and morbidity worldwide, with motor vehicle collisions constituting the primary contributing factor [1,2]. Low- and middle-income countries (LMICs) bear a disproportionate burden, accounting for nearly 85% of all head injuries globally [3]. India reports one of the highest accident rates, with approximately 35 incidents per 1,000 vehicles [4]. A 2005 study estimated that road traffic accidents (RTAs) in India led to around 110,000 deaths, 2.5 million hospitalizations, 8-9 million minor injuries, and economic losses equivalent to 3% of the national gross domestic product (GDP) [5].
Postoperative mortality (POM) following intracranial surgeries exhibits significant regional variability, particularly among LMICs. Reported POM rates range from 2.5% to 39.1% in Africa, 3.6% to 34.8% in Asia, and 1.3% to 12% in Latin America and the Caribbean. These rates are consistently higher than those observed in high-income countries, primarily due to delays in diagnosis and definitive neurosurgical care [6].
Despite guidelines from the Brain Trauma Foundation, management approaches for severe and critical head injuries vary across neurosurgical centers. The Glasgow Coma Scale (GCS) is widely used to assess neurological status; however, its utility is limited in intubated patients, those under the influence of alcohol, or those with facial injuries. In such cases, the motor component of the GCS (motor score (Mscore)) has been shown to be a more reliable and practical prognostic indicator [7,8]. Timely evacuation of subdural hematomas significantly reduces mortality and improves functional outcomes. Mortality rates have been reported as 73% for patients evacuated within two hours of trauma, compared to 94% for those evacuated after four hours [9,10].
However, a 2006 meta-analysis cautioned against a simplistic interpretation of this association, noting that patients operated on earlier often have more severe injuries, confounding the impact of timing alone [11]. More recent meta-epidemiological evidence reinforced these disparities, reporting a pooled traumatic brain injury (TBI)-related mortality of 16.7% (95% CI: 13.7-20.3%) across 31 LMICs and concluding that mortality is three- to four-fold higher than in high-income countries [12].
The present study aimed to evaluate the clinical, radiological, and surgical characteristics of patients with severe TBI and intradural pathologies (acute subdural hematoma, cerebral contusion with mass effect, and traumatic subarachnoid hemorrhage requiring surgical decompression). Specifically, we investigated the prognostic value of the preoperative Mscore compared with the overall GCS score and examined the relationship between dural opening time (as opposed to skin incision time) and patient outcomes.
Materials and methods
Study design and participant selection
This prospective longitudinal cohort study was conducted at Jawaharlal Institute of Postgraduate Medical Education and Research (JIPMER), Puducherry, India, after the study was approved by the institute's Institutional Ethics Committee (approval number: JIP/IEC/2017/0098) and included adult patients aged 18-70 years who had sustained severe brain injuries, defined by a GCS score of 8 or below. All eligible patients underwent surgical intervention for intradural pathologies, which included emergency neurosurgical procedures (craniotomy or decompressive craniectomy) performed at the discretion of the attending neurosurgeon based on intraoperative findings. To ensure cohort homogeneity and minimize confounding factors, patients were excluded if they exhibited absent brainstem reflexes, had pre-existing neurological disorders, sustained multiple traumatic injuries, presented with purely extradural pathology, were on anticoagulant therapy, died due to systemic diseases unrelated to the primary pathology, suffered penetrating injuries with gross contamination, exhibited significant vascular trauma, or developed culture-positive postoperative meningitis.
Sample size and data collection
A total of 86 participants were enrolled over an 18-month period (May 6, 2017-October 19, 2018), based on an anticipated in-hospital mortality rate of approximately 15% [12]. The minimum required sample size was calculated using the single-proportion formula \begin{document}\text{n}=\left( \text{Z}^{2} \times\text{p}\times\left( 1-\text{p}\text{} \right)\right)/\text{d}^{2}\end{document} , where Z = 1.96 (95% confidence), p = 0.17 (expected severe TBI mortality in LMICs, derived from a meta-epidemiological study reporting a pooled mortality of 16.7%, 95% confidence interval (CI) 13.7-20.3%), and d = 0.08 (absolute precision), yielding an estimated sample size of 84. To account for potential exclusions and loss to follow-up, 86 patients were ultimately recruited. Baseline demographic and clinical variables were recorded, including age, sex, mechanism of injury, and pre-existing comorbidities, while preoperative assessments comprised GCS scores with emphasis on the Mscore, timing to dural opening, duration on ventilator, and computed tomography (CT) findings interpreted by institutional radiologists who were not blinded. Neurological evaluations (GCS and Mscore) were performed by neurosurgery residents trained in standardized protocols. Intraoperative findings and postoperative events were documented, including complications, length of hospital stay, in-hospital mortality, and GCS at discharge or on postoperative day 5, whichever occurred earlier, while long-term outcomes were assessed through outpatient visits or structured telephonic interviews.
Measurement tools and standardization
All data were collected using standardized protocols to ensure consistency and reproducibility. Neurological status and functional outcomes were evaluated using validated tools, including the GCS and the Glasgow Outcome Scale-Extended (GOS-E). The GOS-E classifies outcomes into eight categories, ranging from death to upper good recovery. For analysis, we consolidated these into three outcome levels: (1) death or vegetative state (GOS-E 1-2), (2) disability (GOS-E 3-6, encompassing severe and moderate disability), and (3) good recovery (GOS-E 7-8) [13]. Additional clinical parameters were systematically documented to assess motor function, neurological progression, and recovery trajectory.
Statistical analysis
All statistical analyses were performed using the R software (version 4.4.0) (R Foundation for Statistical Computing, Vienna, Austria). Continuous variables were summarized as mean ± standard deviation (SD) or median with interquartile range (IQR), depending on the distribution of the data. Categorical variables were presented as frequencies and percentages.
For group comparisons between the two categories (survivors and non-survivors), independent t-tests were used for normally distributed continuous variables, and the Wilcoxon rank-sum test was used for non-normally distributed variables (specifically, age). For comparisons across more than two groups (GOS-E classification), one-way analysis of variance (ANOVA) was used for normally distributed continuous variables, and the Kruskal-Wallis test was used for age. Categorical variables were compared using the chi-squared test.
Receiver operating characteristic (ROC) curve analysis was employed to assess the predictive performance of the preoperative Mscore and total GCS score in relation to postoperative outcomes measured by the GOS-E. The area under the curve (AUC) was calculated for each metric, and DeLong's test was used to compare the AUCs of correlated ROC curves.
Multivariable logistic regression was conducted to identify independent predictors of in-hospital mortality. Clinically relevant variables and those with a univariable p-value <0.05 were included in the model. Results were reported as odds ratios (OR) with corresponding 95% CI. A two-sided p-value of <0.05 was considered statistically significant. Visualizations, including bar and lollipop plots, were used to support data interpretation.
Results
Participant characteristics
A total of 86 patients with severe TBI were included. The median age was highest in the death/vegetative state group (47 years, IQR: 32.8-58.5), followed by the disabled group (38.5 years, IQR: 27.5-56.3) and the good recovery group (32 years, IQR: 25.3-45.5); however, these differences were not statistically significant (p = 0.132). Females constituted 15.1% of the overall cohort, and gender distribution did not differ significantly across outcome groups (p = 0.510).
RTAs were the predominant mechanism of injury in all groups, with no significant variation in injury etiology (p = 0.235) (Figure 1).
Mode of injury by GOS-E categoryBar plot showing the number of participants per injury type.RTA: road traffic accident; GOS-E: Glasgow Outcome Scale-Extended
Clinical and radiological parameters
Significant differences were observed in preadmission clinical scores across outcome groups. Patients in the good recovery group had higher preadmission GCS (7.06 ± 1.65) compared to the death/vegetative group (5.59 ± 1.72; p = 0.002), along with higher Mscores (Mscore: 4.38 ± 1.26 vs. 3.27 ± 1.39; p = 0.004). These trends were consistent in preoperative assessments (p < 0.005 for both GCS and Mscore). Radiological findings such as basal cistern effacement were significantly more prevalent in the death/vegetative state group (n = 36; 90%) compared with other outcome groups (p = 0.043).
Ventilator duration was longest among patients in the death/vegetative group (mean: 3.89 days), with a statistically significant decreasing trend across better outcome categories (p = 0.006). Both in-hospital and all-cause mortality occurred exclusively within the death/vegetative group (p < 0.001) (Table 1).
All-cause mortality analysis
Comparisons between survivors (n = 43) and non-survivors (n = 42) demonstrated that survivors had significantly higher preadmission and preoperative GCS and Mscores (mean Mscore: 4.19 vs. 3.24; GCS: 6.77 vs. 5.57; both p = 0.001). Intubation was more frequently documented among survivors (32.6% vs. 11.9%; p = 0.039); however, this association is likely confounded by baseline neurological status, particularly GCS, and should not be interpreted as a direct causal relationship. Non-survivors required a longer duration of ventilatory support compared with survivors (3.74 ± 2.68 vs. 2.42 ± 2.63 days; p = 0.024) (Table 2).
In multivariable logistic regression analysis (Table 3), no single predictor reached statistical significance. However, age demonstrated a trend toward increased mortality risk (OR: 1.03; 95% CI: 1.00-1.08; p = 0.050), while higher preadmission GCS scores showed a non-significant trend toward reduced mortality (OR: 0.60; 95% CI: 0.12-2.90; p = 0.520).
Predictors
A lollipop plot (Figure 2) illustrates the direction and magnitude of associations between selected preoperative variables and all-cause mortality. Per-unit increases in preadmission Mscores and longer intervals between surgery initiation and dural opening were associated with increased mortality risk. Conversely, per-unit increases in preadmission and preoperative GCS and Mscores were associated with reduced mortality odds. However, none of these associations achieved statistical significance, indicating that larger sample sizes or further adjustment for confounders may be necessary to validate these trends.
Association of key clinical parameters and dural opening timing with mortalityMscore: motor score; GCS: Glasgow Coma Scale
Predictive accuracy of clinical scores
ROC curve analysis was conducted to evaluate the prognostic utility of the preoperative Mscore and total GCS score in predicting outcomes as defined by the GOS-E. The AUC for the Mscore was 0.68 (95% CI: 0.54-0.82), compared to 0.69 (95% CI: 0.54-0.84) for the total GCS. Although the GCS showed a numerically higher discriminative ability, DeLong's test found no statistically significant difference between the two (p = 0.496) (Figure 3).
ROC curve: Mscore vs. GCSROC curve comparing the predictive accuracy of GCS and Mscores for poor outcomes.ROC: receiver operating characteristic; AUC: area under the curve; Mscore: motor score; GCS: Glasgow Coma Scale
Discussion
Despite significant advancements in the management of TBI, mortality rates remain unacceptably high. Previous studies have reported mortality rates ranging from 26.7% to 41.4% in Level I trauma centers [14,15], while in LMICs, rates may be as high as 51% compared to 30% in high-income countries [3]. In our cohort, 50% (n = 42) of patients succumbed to their injuries, consistent with outcomes observed in resource-limited settings. Our study aimed to evaluate functional outcomes at three months following severe TBI in adults aged 18-70 years. Outcomes assessed using the GOS-E revealed that 51.2% (n = 44) of patients were either deceased or in a vegetative state (GOS-E ≤2), while only 18.6% (n = 16) achieved good recovery. This distribution aligns with findings by Beck et al., who reported poor outcomes in approximately 70% of patients with severe brain injuries [16].
Injury patterns in our cohort also mirrored global trends. The mean age of 42.22 years parallels findings from South Africa and China, where TBI primarily affects middle-aged adults. RTAs accounted for the majority of injuries (n = 74; 94%), as illustrated in Figure 1. This reflects broader issues in LMICs such as inadequate road safety compliance and increased exposure among working-age males. The underrepresentation of female patients (n = 13; 15.1%) may be due to social and behavioral factors, including lower rates of vehicular usage and alcohol exposure among women. Such demographic and epidemiological parallels highlight the consistency of TBI risk profiles across diverse geographic settings.
The relationship between surgical timing and outcomes remains complex. Although earlier evacuation of mass lesions (e.g., acute subdural hematoma) has been associated with improved survival in selected contexts [9,17], we did not observe a statistically significant association between injury-to-surgery (or dural opening) intervals and mortality. Notably, patients with favorable outcomes showed longer admission-to-surgery intervals; this counterintuitive trend likely reflects confounding by indication: more severely injured patients (lower GCS/Mscore, anisocoria, greater midline shift, basal cistern effacement, large subdural/contusional burden, hemodynamic instability) were triaged for rapid intervention, whereas physiologically stable patients with less mass effect proceeded after resuscitation and optimization. In our center, the clinical factors guiding operative timing included preadmission and preoperative GCS/Mscore, pupillary reactivity/anisocoria, CT markers of mass effect (midline shift magnitude, basal cistern status, presence of subdural hematoma and/or dominant contusion), and overall hemodynamic stability; logistical elements (operating-room availability and parallel resuscitation) also influenced timing but were not systematically captured [18]. From a practical standpoint in LMICs, these bedside neurological and radiological cues can help prioritize scarce operating-room resources toward patients with robust indications for urgent decompression while permitting brief, goal-directed resuscitation in more stable presentations.
Pupillary abnormalities are established markers of herniation risk and poor prognosis due to midbrain compression [19]. In our cohort, basal cistern effacement, an indirect indicator of raised intracranial pressure, was significantly associated with worse outcomes, whereas absolute pupillary size did not differ between outcome groups. Mortality was higher among patients with preoperative GCS ≤5 (20/29; 68.97%) and those with preoperative Mscore ≤3 (23/33; 69.7%) (see Table 2), underscoring the importance of initial neurological severity. In ROC curve analyses, Mscore and total GCS demonstrated similar discrimination; the AUC for GCS was modestly higher, but the difference was not statistically significant. Accordingly, our data support the non-inferiority of Mscore relative to total GCS for prognostication in this surgical severe TBI cohort, rather than the superiority of either measure. Apparent paradoxes in the lollipop plot (e.g., a positive coefficient for preadmission Mscore or for longer time to dural opening) did not achieve statistical significance and likely reflect confounding by indication and limited power.
Limitations
This single-center cohort study with a modest sample size (n = 86) limits statistical power and generalizability. Imaging interpretations were not blinded, and airway management and operative timing were not protocolized, introducing potential selection bias and residual confounding. The retrospective design also meant that some variables were incompletely documented. In particular, detailed timing of prehospital or emergency department intubation and the presence of combined radiological lesions (e.g., subdural hematoma with contusion) were not systematically recorded. In addition, differences in ventilator duration observed across outcome groups likely reflect underlying injury severity rather than a direct causal effect. Variability in postoperative care, including ICU access, ventilatory support strategies, and rehabilitation, may also have influenced patient outcomes. Larger, prospective, multicenter studies with standardized data collection are needed to validate these findings.
Conclusions
In this cohort of patients from a single LMIC center with severe TBI and intradural pathologies, the preoperative Mscore demonstrated non-inferior prognostic accuracy compared with the total GCS, with both measures showing similar discrimination for mortality and functional outcomes. Since GCS is an established and widely validated tool, our findings highlight the practical value of Mscore as a simpler alternative when a complete GCS assessment is not feasible, such as in intubated patients or those with facial injuries. Although a longer time to dural opening was numerically associated with mortality, this relationship did not reach statistical significance and is likely explained by confounding from injury severity and triage factors. The retrospective single-center design, modest sample size, and variability in perioperative and postoperative care limit the generalizability of these results. Nonetheless, the study provides evidence supporting the integration of both Mscore and GCS into early risk stratification for severe TBI and underscores the need for larger, prospective, multicenter studies to validate these findings.
The reference list from the paper itself. Each links out to its DOI / PubMed record.
- 1Global mortality, disability, and the contribution of risk factors: Global Burden of Disease Study Lancet Murray CJ Lopez AD 143614423491997916431710.1016/S 0140-6736(96)07495-8 · doi ↗ · pubmed ↗
- 2Characteristics of associated craniofacial trauma in patients with head injuries: an experience with 100 cases J Emerg Trauma Shock Rajendra PB Mathew TP Agrawal A Sabharawal G 8994220091956196710.4103/0974-2700.50742 PMC 2700599 · doi ↗ · pubmed ↗
- 3Patient outcome after traumatic brain injury in high-, middle- and low-income countries: analysis of data on 8927 patients in 46 countries Int J Epidemiol De Silva MJ Roberts I Perel P 4524583820091878289810.1093/ije/dyn 189 · doi ↗ · pubmed ↗
- 4Incidence and burden of road traffic injuries in urban India Inj Prev Dandona R Kumar GA Ameer MA Ahmed GM Dandona L 3543591420081907423910.1136/ip.2008.019620 PMC 2777413 · doi ↗ · pubmed ↗
- 5Road traffic deaths, injuries and disabilities in India: current scenario Natl Med J India Gururaj G 1420212008 https://pubmed.ncbi.nlm.nih.gov/18472698/18472698 · pubmed ↗
- 6Current trends and challenges: the landscape of perioperative mortality in intracranial surgeries in low- and middle-income settings: a narrative review Health Sci Rep Roy S Awuah WA Ahluwalia A 07202410.1002/hsr 2.1838 PMC 1080902338274132 · doi ↗ · pubmed ↗
- 7Improving the Glasgow Coma Scale score: motor score alone is a better predictor J Trauma Healey C Osler TM Rogers FB 6716785420031270752810.1097/01.TA.0000058130.30490.5D · doi ↗ · pubmed ↗
- 8Glasgow motor scale alone is equivalent to Glasgow Coma Scale at identifying children at risk for serious traumatic brain injury J Trauma Acute Care Surg Acker SN Ross JT Partrick DA Nadlonek NA Bronsert M Bensard DD 3043097720142505825810.1097/TA.0000000000000300 · doi ↗ · pubmed ↗