HPV vaccination in community health organizations: what is going right and how can it be replicated?
Keely Ulmer, Kristin Lyon-Scott, Ngoc Wasson, Taona P. Haderlein, Amanda Bruegl

TL;DR
This study examines HPV vaccination rates in underserved communities and finds that Hispanic individuals and younger initiators have higher completion rates, suggesting strategies for improving vaccination coverage.
Contribution
The study identifies factors associated with higher HPV vaccination completion in medically underserved populations, including race, age at initiation, and visit frequency.
Findings
HPV vaccination rates for all racial/ethnic groups were below the Healthy People 2030 goal of 80.0%.
Hispanic individuals had the highest rates of up-to-date vaccination, and no significant gender difference was observed.
Younger age at initiation and more clinical visits increased the odds of completing the vaccine series.
Abstract
Human papillomavirus (HPV) vaccination is recommended for individuals between 9 and 12 years of age to prevent six different cancers. Lower rates of vaccination exist among underserved populations. We evaluate rates of up-to-date (UTD) HPV vaccination within a nationwide network representing many medically underserved communities. This study was conducted using OCHIN, a diverse national database of over 6 million publicly or underinsured patients seen at an OCHIN clinic from January 2015 to December 2023. HPV vaccination initiation and completion rates were the primary outcomes. 1,848,813 patients were included. HPV vaccination rates for all races and ethnic groups were below the Healthy People 2030 goal of 80.0%. Vaccination varied by race/ethnicity, with Hispanic individuals having the highest rates of UTD vaccination. There was no statistically significant difference between male…
Genes, proteins, chemicals, diseases, species, mutations and cell lines named across the full text — each resolved to its canonical identifier and authoritative record.
Click any figure to enlarge with its caption.
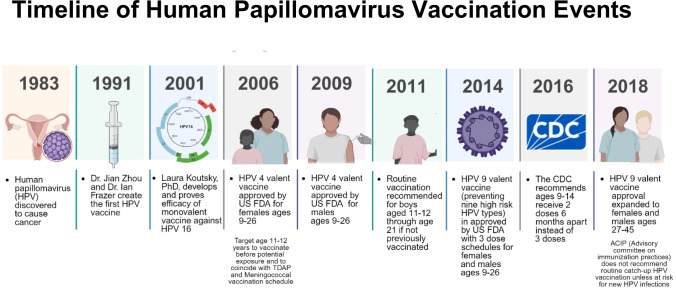 Figure 1
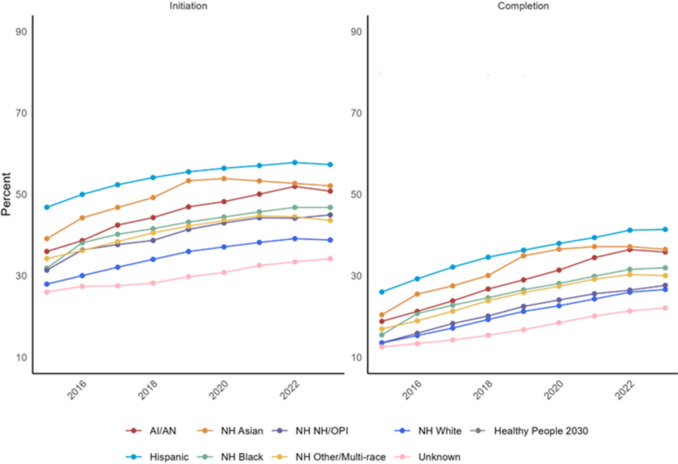 Figure 2
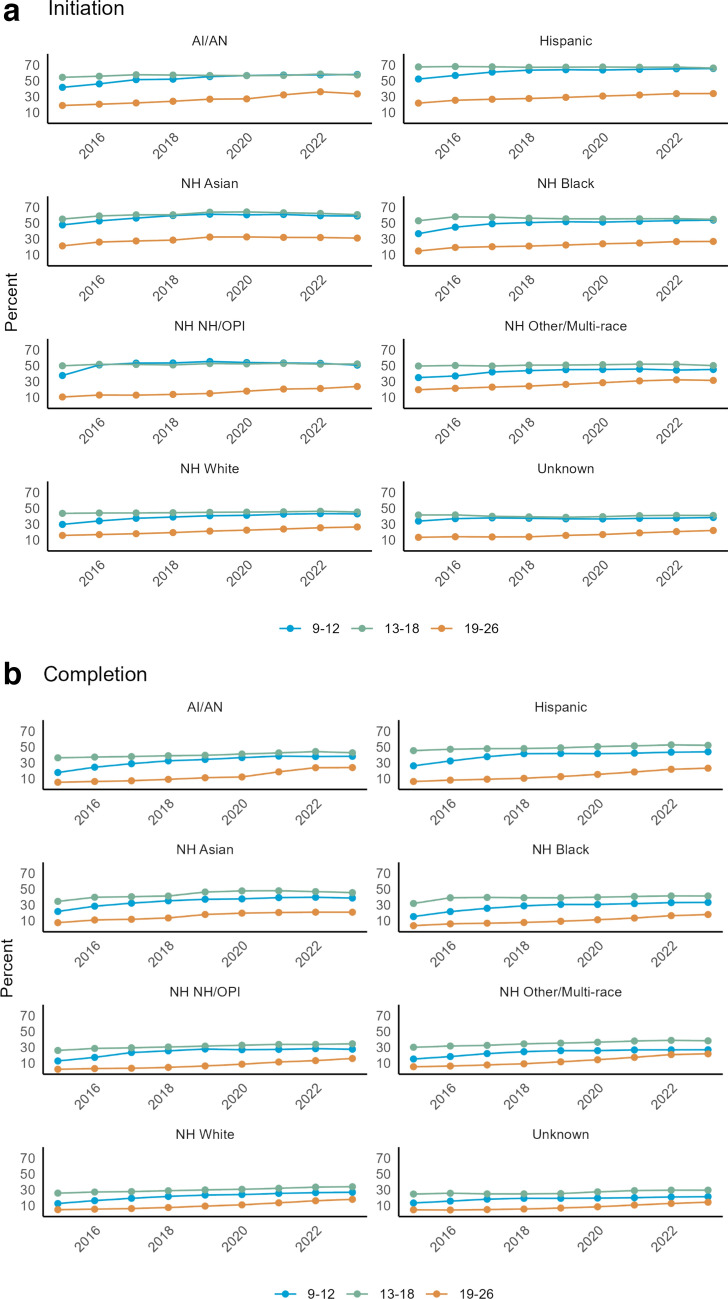 Figure 3
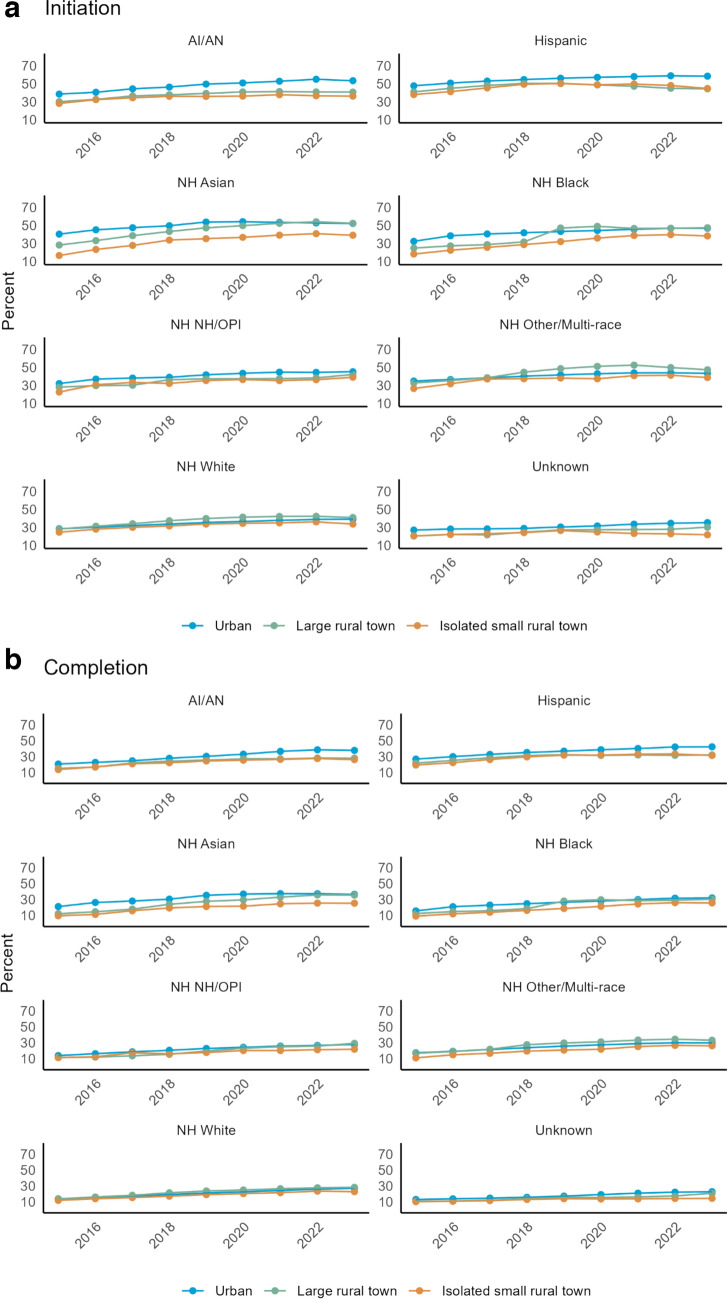 Figure 4
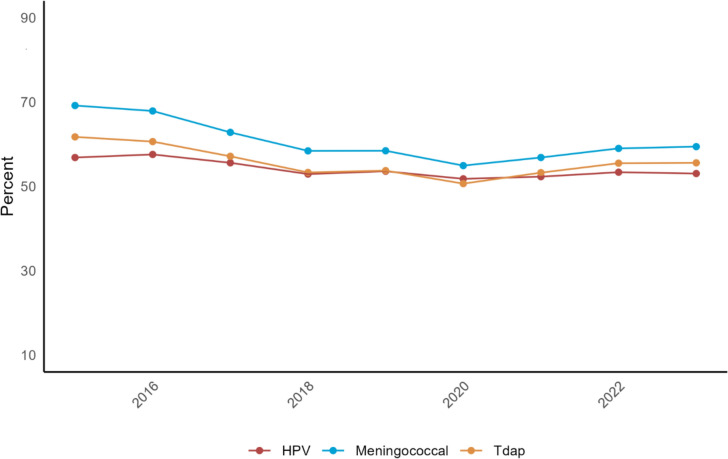 Figure 5
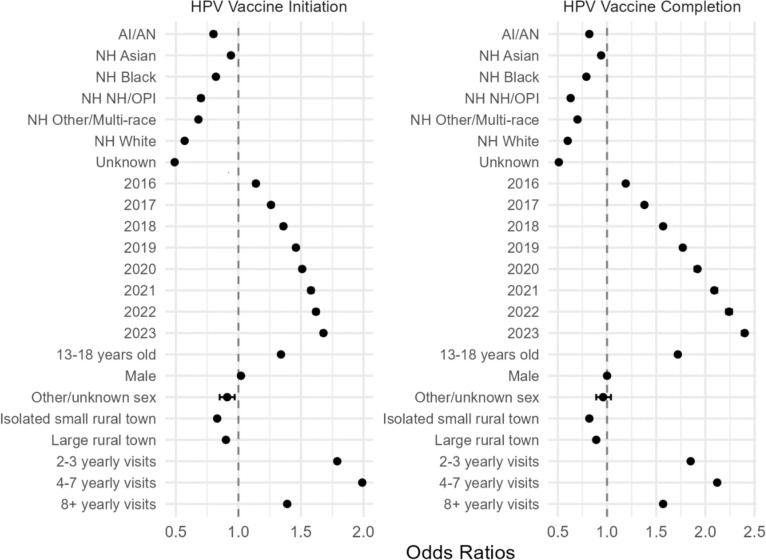 Figure 6
Peer Reviews
No public reviews on file for this paper yet. If you reviewed it on a platform where reviews are public (OpenReview, ICLR, NeurIPS, ICML), you can paste yours below so the community can read it here.
Videos
No videos yet. Explain this paper in a talk, walkthrough, or lecture? Add one.
Taxonomy
TopicsCervical Cancer and HPV Research · Hepatitis B Virus Studies · Vaccine Coverage and Hesitancy
Introduction
High-risk human papillomavirus (HPV) is associated with six different types of cancer: cervical, vaginal, vulvar, anal, penile, and oropharyngeal resulting in an annual 35,000 incident cases in the United States each year [1, 2]. An estimated 79 million Americans are infected with at least one type of HPV, with 14 million new infections occurring each year, nearly half occurring in people aged 14 to 25 years of age [3]. Since the initial identification of HPV and its association with these cancers, highly effective vaccines have been developed (Fig. 1) [4–8].Fig. 1. Overview of HPV and HPV vaccination history
The 9-valent HPV vaccine protects against 7 of the 14 known high-risk HPV subtypes, 2 of the low-risk HPV subtypes, associated with genital warts, and is Food and Drug Administration (FDA) approved for individuals 9–45 years of age [9]. The Advisory Committee on Immunization Practices (ACIP) and United States Preventive Service Task Force (USPSTF) recommend routine HPV vaccination with a two-dose series for all genders ages 11–12 [10, 11]. The American Cancer Society (ACS) recommends beginning HPV vaccination at age 9 for all genders as this has been shown to increase the probability of vaccine completion by age 13 [2, 5–7]. For individuals who do not receive the vaccine at the recommended time, there is a catch-up period between ages 15 and 26 years with a 3-dose series. For individuals ages 27–45, ACIP recommends against routine vaccination if not previously vaccinated. [8, 9, 11]
The Healthy People 2030 goal for HPV vaccination series completion is 80.0%, however, HPV vaccination for adolescents ages 13–15 remains low at 58.5% based on National Institutes of Health (NIH) data from 2021, and only 38.6% of children ages 9–17 received one or more vaccine doses in 2022 [12]. Evidence also shows that a significant proportion of the US population defers HPV vaccination to the catch-up phase (ages 15–26), which is a period when HPV vaccination is known to be less effective due to increased probability of exposure to the virus [13, 14]. According to the Center for Disease Control and Prevention (CDC), the probability of being vaccinated against HPV in the United States increases with age, is more common in girls than boys, and is more likely in Non-Hispanic White (NHW) populations. It is also more likely among children with private health insurance, and for those living in Metropolitan areas compared to non-metropolitan areas [15].
In this study, we sought to evaluate the rates of HPV vaccine initiation and completion in the OCHIN network, a large clinic network that provides care to systemically underserved communities. The demographics of patients served by this network are primarily Medicaid or uninsured (54% and 18%, respectively), culturally diverse with 23% identifying as people of color and 36% as Hispanic ethnicity, and over half of the patients live under the federal poverty level. Thus, the OCHIN database represents one of the most comprehensive sources of primary healthcare outcomes for traditionally underserved groups in the US and those at elevated risk for the development of future HPV-related cancers. Thus, individuals in this population are ideal for primary prevention through HPV vaccination. Our objective is to examine rates of HPV vaccine series initiation and completion within the OCHIN database to evaluate if primary prevention efforts align with national HPV vaccination goals.
Methods
Study design and data source
This cross-sectional study utilized data sourced from the OCHIN Epic electronic health record (EHR) network. As a national nonprofit health IT consultancy, OCHIN provides a shared EHR platform used by more than 34,500 providers and includes over 6 million people in medically underserved communities nationwide. The study was approved by the Oregon Health & Science University Institutional Review Board and follows the Strengthening the Reporting of Observational Studies in Epidemiology (STROBE) reporting guidelines (Institutional Review Board #26,254, March 6, 2024).
Population
The study population consisted of all persons ages 9–26 years with at least one in-person or telehealth encounter at an OCHIN clinic between 1 January 2015 and 31 December 2023 (N = 1,848,813). Exclusion criteria included not visiting an OCHIN clinic for 5 or more years during the study period.
Data measures and study variables
Sociodemographic and clinical characteristics
We obtained sociodemographic patient characteristic information and clinical characteristics including healthcare organization data. Characteristics used to describe our study population include sex, age (9–12 years, 13–18 years, 19–26 years) on January 1 of the first year of meeting inclusion criteria, rurality based on the Rural–Urban Commuting Area (RUCA) code (urban, large rural town, isolated small rural town, missing), number of yearly encounters (< 1, 1, 2–3, 4–7, 8 +), income as a percentage of federal poverty level (FPL) across all encounters (always < = 138%, always > 138%, over and under 138%, unknown), and insurance status (always insured, always uninsured, mixed). The assigned health system was defined as the healthcare organization the patient had the most encounters with.
Exposure and outcomes
Our independent variable was race and ethnicity and it was categorized as Hispanic for those patients who self-reported being Hispanic except for the American Indian and Alaska Natives (AI/AN) patients. Due to relatively small number of AI/AN patients, we did not distinguish between ethnicities within this group. Therefore, the AI/AN category includes people from all ethnicities (Hispanic, non-Hispanic, or unknown). Patients not classified as Hispanic were categorized according to self-reported race information into one of the following groups: non-Hispanic (NH) Asian, NH Black, NH Native Hawaiian/Other Pacific Islander (NHPI/OPI), NH Other/Multi-Race, NH White, and unknown.
The two primary outcomes of our study were as follows: 1. Initiation of the HPV vaccination series and 2. Completion of the vaccination series. HPV vaccination records were collected from immunization, procedure, and health maintenance data within the EHR. Individuals who received their first HPV dose before the age of 15 required only 2 doses to complete the series. Those who started the series at age 15 or older needed 3 doses to be considered fully vaccinated. In addition, a comparison of up-to-date meningococcal and Tdap vaccination to HPV initiation in children 11–12 years old was performed.
Statistical analysis
Descriptive statistics were used to summarize patient characteristics both overall and by race and ethnicity group, with frequencies and percentages reported. Chi-squared tests assessed the statistical significance differences between groups. We calculated the unadjusted prevalence of HPV initiation and completion by race and ethnicity, age within each racial/ethnic group, and rurality within each racial/ethnic group. The Healthy People 2030 benchmark was included for comparison.
An Analysis of Variance (ANOVA) was conducted to compare the mean HPV initiation rates with those of meningococcal and Tdap vaccinations among children ages 11–12 years. To examine the relationship between race/ethnicity and HPV initiation and completion, we employed a Generalized Estimating Equation (GEE) model with a logit link. This model estimated the odds ratios and 95% confidence intervals, adjusting patient-level characteristics. The GEE model accounted for clustering by assigned health system and adjusted for within-subject correlation due to repeated measurements. Individuals identifying as Hispanic were used as the reference group for race/ethnicity, because this group had the largest sample size. Reference groups for added variables were year 2015, age 9–12, female sex, urban rurality, and 1 yearly visit. We applied a two-sided hypothesis test with a significance set at P < 0.05. All analyses were conducted using SAS Enterprise Guide Version 8.4.
Results
Participants
During the years 2015–2023, 1,848,813 individuals in the OCHIN database met our inclusion criteria (Table 1). Overall, the largest proportion of individuals were Hispanic, accounting for 39.0% of the study population, followed by NH White (28.3%), NH Black (16.0%), NH Asian (4.9%), AI/AN (1.1%), NH NHPI/OPI (0.4%), Unknown (8.8%), and NH other/multi-race (1.3%). The total population was slightly more female (56.8%) compared to male (43.1%). The ages included were overall equally represented with ages 9–12 representing 28.2% of the population, 13–18 (32.1%), and 19–26 (39.7%). The majority of the patients were from an urban location (87.4%). The median number of clinical encounters per patient was 3, and most patients (72.7%) lived below 138% of the federal poverty level at some point during the study period. Approximately 65.2% of patients had some form of insurance throughout the duration of the study, followed by uninsured (14.1%) and periods of both insured and uninsured status throughout the duration of the study (20.7%).Table 1. Characteristics of patients eligible for at least one year for HPV vaccination from 2015 to 2023 by race/ethnicityTotalAI/ANHispanicNH AsianNH BlackNH NHPI/OPINH Other/Multi-RaceNH WhiteUnknownTotal (n, %)1,848,813 (100)20,859 (1.12)721,829 (39.04)91,097 (4.92)296,814 (16.05)6798 (0.40)24,196 (1.30)524,063 (28.34)163,157 (8.82)Sex Female1,050,564 (56.82)12,025 (57.65)410,254 (56.84)51,726 (56.78)166,649 (56.15)4112 (60.49)15,020 (62.08)300,264 (57.3)90,514 (55.48) Male796,390 (43.08)8803 (42.2)311,313 (43.13)39,284 (43.12)130,045 (43.81) > 2600 (~ 40) > 9100 (~ 37)222,927 (42.54)72,226 (44.27)Other/Unknown1859 (0.1)31 (0.15)262 (0.04)87 (0.1)120 (0.04) ≤ 10 > 60 (~ 0)872 (0.17)417 (0.26)Age^1^ 9–12521,869 (28.23)5501 (26.37)226,614 (31.39)25,133 (27.59)81,789 (27.56)1812 (26.65)6687 (27.64)130,418 (24.89)43,915 (26.92) 13–18592,487 (32.05)7089 (33.99)238,609 (33.06)29,615 (32.51)90,370 (30.45)2278 (33.51)8301 (34.31)163,155 (31.13)53,070 (32.53) 19–26734,457 (39.73)8269 (39.64)256,606 (35.55)36,349 (39.9)124,655 (42)2708 (39.84)9208 (38.06)230,490 (43.98)66,172 (40.56)Rurality Urban1,615,900 (87.4)17,252 (82.71)669,039 (92.69)87,696 (96.27)281,094 (94.7)6372 (93.73)20,550 (84.93)389,309 (74.29)144,588 (88.62) Large rural town150,043 (8.12)1841 (8.83)38,491 (5.33)2175 (2.39)10,178 (3.43)254 (3.74)2481 (10.25)83,774 (15.99)10,849 (6.65)Isolated rural town80,675 (4.36)1717 (8.23)13,987 (1.94)1136 (1.25)5361 (1.81)159 (2.34)1127 (4.66)50,288 (9.6)6900 (4.23) Missing2195 (0.12)49 (0.23)312 (0.04)90 (0.1)181 (0.06)13 (0.19)38 (0.16)692 (0.13)820 (0.5)N yearly encounters < 128,862 (1.56)267 (1.28)9824 (1.36)1269 (1.39)4901 (1.65)149 (2.19)456 (1.88)9738 (1.86)2258 (1.38) 1733,062 (39.65)7248 (34.75)263,198 (36.46)38,752 (42.54)130,073 (43.82)3103 (45.65)8601 (35.55)204,392 (39)77,695 (47.62) 2–3712,270 (38.53)7858 (37.67)296,039 (41.01)37,355 (41.01)112,624 (37.94)2547 (37.47)9000 (37.2)191,753 (36.59)55,094 (33.77) 4–7275,331 (14.89)3782 (18.13)115,567 (16.01)10,883 (11.95)37,997 (12.8)792 (11.65)4240 (17.52)81,694 (15.59)20,376 (12.49) 8 + 99,288 (5.37)1704 (8.17)37,201 (5.15)2838 (3.12)11,219 (3.78)207 (3.05)1899 (7.85)36,486 (6.96)7734 (4.74)Percent FPL Always < = 1381,163,906 (62.95)12,890 (61.8)483,260 (66.95)60,939 (66.89)216,500 (72.94)4371 (64.3)14,642 (60.51)278,935 (53.23)92,369 (56.61) Always > 138188,449 (10.19)1779 (8.53)59,980 (8.31)9766 (10.72)19,642 (6.62)652 (9.59)2970 (12.27)78,117 (14.91)15,543 (9.53) Over and Under179,807 (9.73)2118 (10.15)78,074 (10.82)9126 (10.02)20,325 (6.85)600 (8.83)2958 (12.23)57,588 (10.99)9018 (5.53) Unknown316,651 (17.13)4072 (19.52)100,515 (13.93)11,266 (12.37)40,347 (13.59)1175 (17.28)3626 (14.99)109,423 (20.88)46,227 (28.33)Visit coverage Always insured1,205,054 (65.18)12,315 (59.04)468,602 (64.92)64,504 (70.81)187,272 (63.09)4421 (65.03)14,946 (61.77)347,671 (66.34)105,323 (64.55) Always uninsured260,722 (14.1)2756 (13.21)105,007 (14.55)10,505 (11.53)44,882 (15.12)1086 (15.98)2788 (11.52)62,307 (11.89)31,391 (19.24) Mixed383,037 (20.72)5788 (27.75)148,220 (20.53)16,088 (17.66)64,660 (21.78)1291 (18.99)6462 (26.71)114,085 (21.77)26,443 (16.21)AI/AN American Indian/Alaska Native, n number; NH Non-Hispanic, NH NHPI/OPI Non-Hispanic Native Hawaiian and Other Pacific IslanderChi-squared analyses showed that all race vs. sociodemographic variable comparisons were significant at P < 0.001. Cells with low patient counts are suppressed to protect patient privacy. Additional cells are masked to prevent back-calculation^1^Age as of first study-eligible encounter
HPV vaccination initiation and completion rates over time by race/ethnicity
Vaccination rates for all racial and ethnic groups remained below the Healthy People 2030 goal of 80% throughout the entire duration of the study period (Fig. 2). The rates of initiation and completion of HPV vaccination between 2015 and 2023 showed notable differences between initiation and completion, with initiation far outpacing completion across all racial categories. All races showed modest but continued uptrends in both initiation and completion during the timeframe of the study. HPV vaccination was the highest among Hispanic individuals and NH White individuals had the lowest rates of vaccination. The NH Asian population showed a peak of both initiation and completion around 2019 and 2020, respectively, with a progressive decline in both initiation and completion from 2019 to 2023. We did not identify a measurable reduction in vaccination rates surrounding the COVID-19 pandemic and peak social distancing orders from 2020 to 2022 in any racial category other than NH Asian individuals.Fig. 2HPV vaccination initiation and completion rates over time for all race/ethnicity groups
HPV vaccination initiation and completion rates over time by race/ethnicity and age group
Initiation and completion rates by age and race demonstrated that all racial groups had increasing rates of HPV vaccine initiation from 2015 to 2023 among the age group of 9–12 in concordance with current vaccination recommendations (Fig. 3a). A similar trend was noted across all races for completion of the vaccine series; however, the 13–18 age group had the highest completion rates across all race/ethnicity groups (Fig. 3b). Patients between the ages of 19 and 26 were the least likely to initiate or complete the HPV vaccination series.Fig. 3** a** Rates by age group compared across all race/ethnicities for HPV vaccine initiation. ** b** Rates by age group compared across all race/ethnicities for HPV vaccine completion
HPV vaccination initiation and completion rates over time by race/ethnicity and geographic location
Initiation and completion by rural–urban commuting area (RUCA) codes and race/ethnicities demonstrated greater percentages in urban settings over large and small isolated rural region (Fig. 4a and b). Individuals living in isolated small rural town RUCA had the lowest rates during this time.Fig. 4** a** Rates by location compared across all race/ethnicities for HPV vaccine initiation.** b**Rates by location compared across all race/ethnicities for HPV vaccine completion
HPV vaccination rates compared to other recommended childhood vaccines
As the national recommendations for HPV immunization are in conjunction with other routine childhood vaccinations such as Tdap and the Meningococcal vaccine at ages 11–12 years, we compared rates of up-to-date meningococcal and Tdap vaccination and HPV initiation between 2015 and 2023 (Fig. 5). Our results demonstrated that rates of HPV vaccination were lower than those for Tdap (p = 0.26) and Meningococcal (p = 0.0017) vaccines. We also observed decreasing rates of both Tdap and meningococcal vaccine with a nadir of both in 2020 with gradual recovery through 2023. HPV vaccination, in contrast, did not show a significant nadir coinciding with the COVID-19 pandemic and has remained stagnant at approximately 50%. We also compared rates of these vaccinations by race/ethnicity group with no prominent differences between rates of the individual vaccination uptake noted.Fig. 5HPV, Meningococcal, and Tdap Vaccine Comparisons for 11-12 year olds only
Odds of HPV vaccine initiation and completion for patients ages 9–26
We investigated the adjusted odds of HPV vaccine initiation and completion among those eligible for at least one year during the study period for several variables (Fig. 6). The most likely group to have HPV vaccine initiation and completion was Hispanic individuals. NHW were least likely to initiate vaccination and complete vaccination OR 0.57 (CI 0.567–0.573) and 0.598 (CI 0.595–0.601) for initiation and completion, respectively. Our analysis showed overall increasing rates of both HPV initiation and completion across the study period; starting with 1.14 (1.12–1.15) and 1.19 (1.18–1.21) odds in 2016; and odds of 1.68 (1.66–1.69) and 2.40 (2.37–2.42) in 2023. The age group of 13–18 years of age were most likely to have initiated (OR 1.34 [1.33–1.35]) and completed the vaccine series (1.72 [1.71–1.73]). Contrary to U.S. trends, we found no statistically significant differences in odds for initiation and completion of the series based on gender. However, the male population did show marginal increased odds of initiation and equal odds of completion compared to females. Individuals with greater than or equal to 2 encounters per year had greater odds of initiating and completing the vaccine, with the greatest odds for individuals having 4–7 yearly encounters. A sub-analysis was performed investigating the odds of vaccine completion among individuals that had received at least one dose of HPV vaccine by age (age 9–10, 11–12, 13–18, 19–26) to examine if earlier age at initiation led to higher odds of completion. This analysis showed that those individuals receiving at least one dose of HPV vaccine between the ages of 9 and 10 were most likely to complete the vaccination series compared to 11–12 (OR 0.71 [0.71–0.72]), 13–18 (OR 0.30 [0.29–0.30]), and 19–26 (OR 0.07 [0.07–0.08]).Fig. 6. Odds of HPV vaccine initiation and completion for patients eligible for at least 1 year (not including insurance status, FPL, <1 visit)
Discussion
This study was performed using a large, diverse, and classically underserved patient cohort from 2015 to 2023 to evaluate rates of HPV vaccination initiation and completion among those eligible for at least one year. Vaccination completion rates for all racial and ethnic groups were well below the Healthy People 2030 goal (80.0%) and 2023 national average (61.4%) ranging from 12.5% to 41.4% throughout the study period [16]. Hispanic individuals had the highest vaccination rates, with median initiation and completion rates of 55.6% and 36.3%, respectively, and non-Hispanic White individuals had the lowest. A recent publication that assessed cervical cancer screening rates in rural and urban populations indicated similar low rates among non-Hispanic White individuals [17]. Individuals ages 13–18 and those with greater than or equal to two clinical visits per year had the greatest odds of completing the HPV vaccination series; however, a sub-analysis of smaller age groupings showed that those who initiated the series between 9 and 10 had the greatest odds of completion relative to the other subgroups.
National trends of initiation and completion of HPV vaccination show increasing rates over time, with no subgroup meeting the national goal of 80%, similar to our data. In 2016, 60.4% (female = 65.1%, male = 37.5%) of adolescents ages 13–17 received at least one dose, and 43.4% (female = 49.5%, male = 37.5%) completed the series [18]. In 2023, 76.8% (female = 78.5%, male = 75.1%) received at least one dose and 61.4% (female = 64.0%, male = 59.0%) completed the series. One notable difference between observed national trends and our findings was the gender difference in HPV vaccination rates. Males lag behind females nationally for both initiation and completion; however, we found that males in the OCHIN population had higher odds of initiation and completion than females, although marginal. The lag between males and females is a likely consequence of the early marketing strategy of the HPV vaccine (FDA-approved for females first and associated with sexual activity), and ongoing strategies have failed to correct this early error. Additionally, HPV vaccination knowledge and awareness efforts have also been female-centered, which has been implicated in the gender disparity [19, 20]. Our data do not show a statistically significant difference between genders which may reflect a more neutral, consistent approach by providers at these clinics. As vaccination of both males and females is crucial, the strategies employed by these community health organizations are deserving of increased attention with the potential to be replicated across the United States.
National guidelines vary in their recommendations for timing of HPV vaccination. ACIP and the USPSTF recommend HPV vaccination at ages 11–12, the American Academy of Pediatrics supports HPV vaccination between ages 9 and 12, and the ACS recommends starting at 9 [19–21]. Our study shows increasing vaccination rates among those ages 9–12 in all racial/ethnic categories over the study period, which aligns with the current national guidelines. Several studies show that earlier initiation of HPV vaccination correlates with higher series of completion rates. Brewer et al. demonstrated that those initiating the HPV vaccine series at 9–10 years compared to those at 11–12 years were significantly more likely to complete the HPV vaccination series for both publicly (70.4% vs. 40.0%) and privately (76.2% vs. 48.1%) insured patients. [6] Results from our study align with these published data and demonstrate that among those that initiate (receive at least one vaccine) between ages 9 and 10 are more likely to have successful rates of completion. We believe that this could be representative of confusion surrounding differing guidelines and possibly hesitancy surrounding HPV vaccination at younger ages. As provider recommendation is a strong correlate to initiation of HPV vaccination, we believe that increased efforts to initiate vaccination between the ages of 9 and 10 will increase the odds of successful completion during the time when the vaccine is known to be most effective. [8, 22, 23] Our data support the ACS recommendation of starting vaccination at age 9 to increase rates of completion. Aligning all national recommendations would decrease confusion regarding recommended timing of vaccination and could lead to higher rates of vaccine completion among all groups.
Reducing vaccine hesitancy and increasing participation in HPV vaccination is critical to the success of achieving the national goal of an 80.0% vaccine completion rate. One strategy to increase HPV vaccination among adolescents has been to bundle vaccinations with other similarly timed recommended childhood vaccines, meningococcal and Tdap [24]. In this study, we examined rates of routine vaccination among OCHIN database for vaccinations received between 11 and 12 years of age and HPV from 9 to 12 years. We found the mean percentages for all vaccinations to be lower than the most recent national data with Meningococcal (60.8%), Tdap (55.7%), and HPV (54.1%). All vaccinations showed a nadir at the time of the COVID pandemic with subsequent uptrend in vaccination after the pandemic with the exception of NH Asian individuals. These data suggest that efforts to reduce vaccine hesitancy for all childhood vaccines are necessary to achieve herd immunity and maximal protection.
Racial and ethnic disparities for HPV-dependent cancers are well described and often associated with the perception of decreased vaccination among minority groups. However, the existing literature examining racial disparities in relation to HPV vaccination is unclear and limited [16–18]. Two systematic reviews showed that vaccine initiation was higher among Black and Hispanic adolescents than non-Hispanic white adolescents; however, vaccine completion was lower [25, 26]. This agrees with several studies that have suggested that differences in HPV vaccination favor minorities [27, 28]. In contrast, other studies have reported that racial minorities were either less likely than NHW to receive HPV vaccination or that there was no difference [29–31]. In this study, we found that NHW was the racial group least likely to initiate or complete HPV vaccination and was comparable only to NH NHPI/OPI, which had the lowest completion rates across all age groups studied. Our study adds to the body of evidence that, among more underserved populations in the OCHIN network, minority populations are more likely than NHW to participate in HPV vaccination. This may reflect increased vaccination efforts in the more traditionally underserved racial minority groups and brings into focus the decreased uptake of vaccination among the NHW population. The NHW population in this high-risk cohort is of particular concern, as they show rates far below all other racial groups both in our study as well as nationally. This highlights the ongoing paradigm shift away from HPV vaccination among the more disadvantaged NHW population, and calls for more dedicated research examining barriers to HPV vaccination at both patient and systems level among this population. [13, 32]
Many communities experienced decreased engagement with preventive healthcare during the COVID-19 pandemic and physical distancing recommendations [33]. Surprisingly, HPV vaccination rates did not decrease overall between 2020 and 2022. In our analysis, NH Asian/Pacific Islander was the only racial group that decreased during this period and did not return to baseline. Asian Americans experienced health challenges during the COVID-19 pandemic that were related to racism and threats of violence, which could have contributed to a lower utilization of services. A 2021 Pew Research Center analysis of the American Community Survey conducted both before and after the pandemic found that English-speaking Asian Americans in 2022 experienced COVID-19 discrimination and “were more likely than other racial or ethnic groups to say they had changed their daily routines due to concerns they might be threatened or attacked” [34]. Researchers of racial and ethnic disparities attribute this to the Anti-Asian racism impacting Asian/PA populations due to COVID-19 indicating a concurrence of health challenges, economic challenges, and increased racism toward Asian communities due to during the COVID-19 pandemic [35].
We also sought to examine differences in HPV vaccination according to geographic location, as this has been found to be a factor in the uptake of HPV vaccination in the existing literature. For example, according to the CDC, individuals living in non-metropolitan areas have lower HPV vaccination rates [15]. However, large meta-analyses have shown mixed effects and large variations between states and regions [36, 37]. This study found that those living in isolated rural towns were less likely to initiate or complete HPV vaccination. However, our population was predominantly urban, which may limit interpretation of our findings. In several studies, examining geographic disparities poverty level was found to be associated with odds of HPV vaccination. For example, in several studies, higher county-level poverty was associated with increased odds of vaccination in contrast to increasing state-level poverty, which was associated with lower odds of vaccination [38–41]. Our study did not show any difference in vaccination by federal poverty level, which may reflect the variations between states and regions, as noted above.
A strength of this study is the large and diverse sample size of underserved, high-risk groups. This allows for greater generalizability to the broader US population beyond the OCHIN network and is reflective of more underserved and socioeconomically disadvantaged patient populations. A limitation of this study is that the population is mainly urban (87.4%). This leads to an underrepresentation of rural communities and individuals residing in those communities. As rural communities are known to have limited access to care, this study may not adequately examine disparities surrounding HPV vaccination in rural areas. Another limitation of this data set includes HPV vaccination rates among the age group of 19–26 as this group is inherently more nomadic and less likely to receive regular healthcare. This makes interpretation of vaccination rates difficult as the data are likely incomplete due to patients either not seeking regular healthcare or utilization of other clinics such as student health.
Conclusions
HPV vaccination rates in the United States among systemically underserved communities and populations with more significant lifetime risks of HPV-related cancers remain well below the national average and national goals. In this cohort, Hispanic individuals were the most likely to receive HPV vaccination and there was no difference between female and male vaccination rates both of which stand in contrast to national trends. Vaccination initiation between the ages of 9 and 10 demonstrated increased odds of completion which supports the ACS guidelines of initiation at this age range. This study demonstrates that, although disadvantaged groups continue to experience inequity, there are successful trends in increasing HPV vaccination, particularly in community health organizations, that need to be explored.
The reference list from the paper itself. Each links out to its DOI / PubMed record.
- 1American College of O, Gynecologists' Committee on Adolescent Health Care A Co O, Gynecologists' Immunization ID, Public Health Preparedness Expert Work G: Human Papillomavirus Vaccination: ACOG Committee Opinion, Number 809. Obstet Gynecol. 2020, 136:e 15-e 21. 10.1097/AOG.000000000000400010.1097/AOG.000000000000400032732766 · doi ↗ · pubmed ↗
- 2Villarroel MA GA, Lu PJ, Pingali C. (2024) Human Papillomavirus Vaccination Coverage in Children Ages 9–17 Years: United States, 2022. NCHS Data Brief 10.15620/cdc:14559310.15620/cdc:14559338358336 · pubmed ↗
- 3Boersma P, Black LI: Human Papillomavirus Vaccination Among Adults Aged 18–26, 2013–2018. NCHS Data Brief. 2020:1–8.32487295 · pubmed ↗