Epidemiology of adolescent and young adult cancer and associated disparities in cancer pattern and care in India: findings from Varanasi’s population-based cancer registry, 2017–2019
Divya Khanna, Rajesh Vishwakarma, Anand N. Sharma, Atul Budukh, Rahul K. Verma, Aman Riguvanshi, Fahad Mahmood, Pankaj Chaturvedi, Satyajit Pradhan

TL;DR
This study examines cancer patterns and care disparities among adolescents and young adults in Varanasi, India, revealing high rates of oral and breast cancers and the need for targeted interventions.
Contribution
The study provides the first detailed analysis of AYA cancer epidemiology and disparities in Varanasi using population-based registry data.
Findings
AYAs accounted for 16.2% of cancer cases, with oral and breast cancers being most common.
Male AYAs had the highest rates of oral cancers, while females faced higher risks of stomach and thyroid cancers.
AYAs accessed more treatment but faced income and employment challenges compared to older adults.
Abstract
Adolescents and Young Adults (AYAs) aged 15–39 represent a unique oncology demographic due to their distinct developmental needs. However, there is limited data on cancer burden and care disparities among the Indian AYAs. This study examines the burden, pattern, and disparities among AYAs in Varanasi, Uttar Pradesh. This study collected data from Varanasi's population-based cancer registry (PBCR) between 2017 and 2019. Data were analyzed for demographic, clinical, and cancer-related variables. Sex and site-specific crude, age-adjusted, and truncated rates for incidence and mortality per 100,000 population were calculated. Disparities in cancer pattern for age, sex, cancer site, and geographical region, sociodemographic and cancer care characteristics were assessed using standardized rate ratios and multivariable regression. Adjusted ratios with 95% confidence intervals were calculated.…
Genes, proteins, chemicals, diseases, species, mutations and cell lines named across the full text — each resolved to its canonical identifier and authoritative record.
Click any figure to enlarge with its caption.
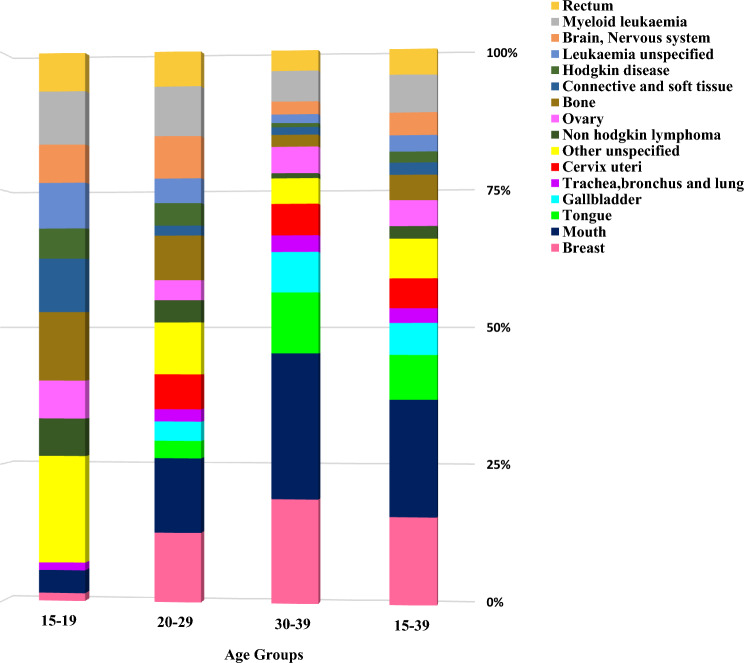 Figure 1
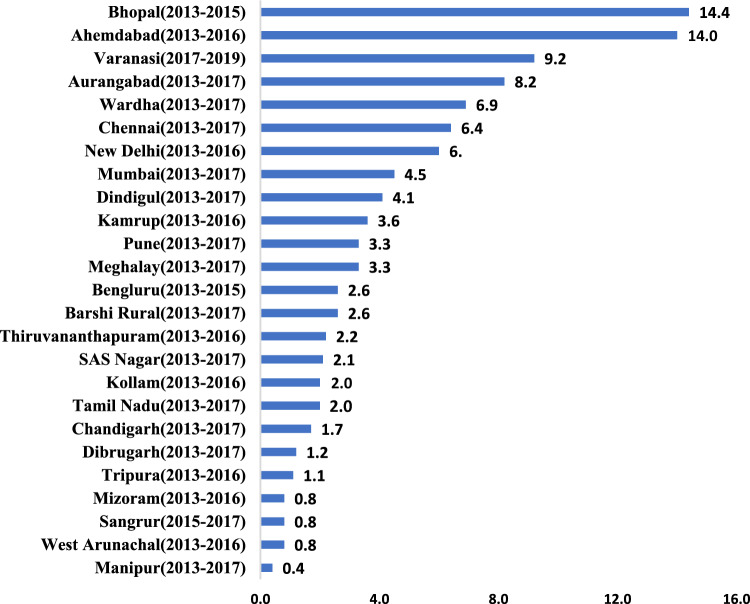 Figure 2
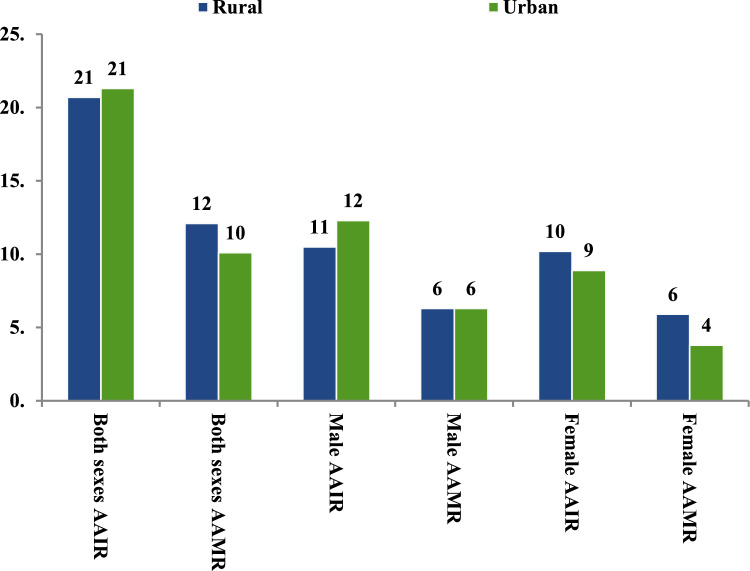 Figure 3
- —Mahamana Pandit Madan Mohan Malaviya Cancer Centre - Varanasi
Peer Reviews
No public reviews on file for this paper yet. If you reviewed it on a platform where reviews are public (OpenReview, ICLR, NeurIPS, ICML), you can paste yours below so the community can read it here.
Videos
No videos yet. Explain this paper in a talk, walkthrough, or lecture? Add one.
Taxonomy
TopicsChildhood Cancer Survivors' Quality of Life · Cancer Risks and Factors · Acute Lymphoblastic Leukemia research
Introduction
The Adolescent and Young Adult Oncology Progress Review Group defines Adolescents and Young Adults (AYA) as individuals aged 15–39 [1]. This group represents a unique and challenging subset within oncology because of the significant psychosocial and physical development during this period [2]. Cancer diagnosis in AYAs disrupts key milestones like education, career, relationships, and family planning [3].
GLOBOCAN 2022 estimated 1,321,779 AYA cancer cases globally, with China, India, and the US contributing 23.9%, 11.3%, and 6.5%, respectively [4]. Cancer is the leading cause of death among the AYAs, excluding homicide, suicide, and unintentional injury [5]. The distribution of cancers varies significantly across different age subgroups within the AYA category [2]. Their biological and genomic characteristics often differ from those seen in older adults (aged ≥ 40 years), posing additional challenges in treatment and management [2].
Globally, AYAs with cancer face unique challenges, including infertility, body image concerns, and disrupted relationships and family planning. These issues, along with financial burdens—especially for older AYAs—impact quality of life (QoL). Psychosocial support and multidisciplinary care, including mental health and reproductive services, are essential to address their needs. Despite such efforts, AYA survivor’s significant disparities and remain at risk for late effects, recurrence, and second malignancies. Unlike children and older adults, AYA survival rates have stagnated over two decades due to low clinical trial participation, distinct disease biology, and barriers like delayed diagnosis and limited insurance coverage [1–3, 6].
In low- and middle-income countries (LMICs), such as India, the burden of AYA cancers is compounded by limited resources and healthcare infrastructure [7]. A recent Indian study analysed data on primary site cancers among AYAs from 28 Population-Based Cancer Registries (PBCRs) and 58 Hospital-Based Cancer Registries (HBCRs) under the National Cancer Registry Programme for the reporting year 2012–2016 [7]. The study reported a median age-adjusted incidence rate (AAR) of 22.2 per 100,000 population among males and 29.2 per 100,000 population among females. A significant increase in cancer incidence was observed among AYA males between 1985 and 2015, while a non-significant decline was noted for females. The projected number of cancer cases in both sexes is expected to increase to 178,617 by 2025. Most of these cancers were in the loco-regional stage at the time of diagnosis [7].
In the Indian context, sociodemographic factors such as age, sex, education, socioeconomic status, and geographic location play a pivotal role in determining cancer diagnosis, access to care, and health outcomes. Regional variability in healthcare infrastructure, levels of awareness, and social vulnerabilities can contribute to diagnostic delays and restricted access to treatment, particularly in resource-constrained settings. These disparities underscore the necessity of understanding how sociodemographic and contextual factors influence the burden of cancer and the provision of care, especially among AYA patients, for whom evidence from India remains scarce [7–11]. This study seeks to address this gap by examining these factors in the Varanasi district, generating findings that may inform targeted strategies to improve cancer diagnosis and care for AYA populations, both in the study setting and in comparable contexts across India. Despite the critical need for such research, there is a paucity of literature examining the epidemiology and disparities in cancer burden and care in the Indian population.
The Varanasi PBCR, established in 2017, indicates the cancer burden in Uttar Pradesh, the largest state in India. With this background, using data from the PBCR for the period 2017–2019, the present study aims to describe the burden of cancer among AYA patients in Varanasi district, and to examine disparities in cancer patterns by age, cancer site, sex, and geographical residence. The study also aims to assess disparities in sociodemographic characteristics and cancer care between AYA patients and adults aged ≥ 40 years.
Methods
Study design and settings
This study is a retrospective population-based cohort study that utilized the data from the Varanasi PBCR. This PBCR was established in 2017, as a part of PBCR network administered by Tata Memorial Centre (TMC), Mumbai. This registry provides crucial data on cancer burden in Uttar Pradesh. The TMC collaborates with district health administration to facilitate cancer registration in the defined area [8, 12].
The estimated population of Varanasi is approximately 4 million (4,005,176), with a predominance of rural inhabitants (57%) spread over an area of 1535 square kilometers. The district comprises eight rural blocks containing 1,295 villages and 90 urban wards, many of which are not sufficiently covered by conventional cancer screening programs. Varanasi operates under a three-tier healthcare delivery and referral system established by national health mission. The district houses two government institutions-supported tertiary cancer care centres (TCCs) and a few private centres, all predominantly located in urban areas [8, 12].
Study participants and data source
The study participants included all registered cancer patients aged 15 years and above residing in Varanasi. Cancer incidence and mortality data from 2017 to 2019 were sourced from the Varanasi PBCR. Data on cancer patients were actively collected from hospitals, medical colleges, radiology and pathology diagnostic centres, birth and death registration office, primary and secondary health care centres, frontline healthcare workers, and the community [8, 12]. The information included socio-demographic and cancer-related variables from various sources, using a standardized proforma developed by [8, 12]. The PBCR registration proforma was developed based on the 35 data elements encompassing sociodemographic and cancer-specific information, as outlined by MacLennan et al. [13, 14]. The collected information was entered into CanReg5 software developed by the International Agency for Research on Cancer (IARC), after review of the existing PBCR database [8, 12]. Trained field investigators conduct these activities and are periodically monitored by faculty from the Centre for Cancer Epidemiology, TMC, Mumbai. Quality control measures include systematic and random checks, removal of duplicate entries, re-abstraction of 5% of randomly selected cases, staff retraining, and calculation of data quality indices for completeness [8, 12].
Measures
The collected data encompassed demographic details, including age, sex, geographical residence (rural/urban as per the Census, India classification [8]), religion (Hindu/Muslim/Christian/Sikh/Buddhist/others), self-reported education levels (illiterate/literate/up to primary/up to secondary/ up to technical after 10th/graduate/post-graduate), mother tongue (Hindi/other languages), occupation (Professional, semi-professional, clerical, government and private employees/ Farmer, skilled, semi-skilled, unskilled workers/ Unemployed, student, house-wife), and monthly income (lower/lower middle/ upper and upper middle). Tumour characteristics included topography and morphology (five-digit codes, where the first four digits indicate the specific histological term, and the fifth digit is the behavior code [malignant, benign, in situ, or uncertain]) of primary cancer site, basis of diagnosis (death certificate/clinical/radiology/specific tumour markers/cytology/histology of primary site/histology of metastasis/others), type of treatment received (surgery/radiotherapy/chemotherapy/combination of two or more definitive modalities/palliation/no treatment/others/unknown), treatment status (complete/ongoing/not completed/ongoing/unknown), and patient outcomes (alive/died/migrated/unknown), including mortality. Malignancies were classified per the International Classification of Diseases for Oncology, third edition (ICD-O) [8, 12–14].
Statistical analysis
We computed sex—and site-specific cancer burden using crude, truncated, and age-adjusted rates (AAR) for incidence (AAIR) and mortality (AAMR) per 100,000 population. Additionally, we calculated cumulative risk, reflecting the probability of an AYA being diagnosed with cancer within the 15–39 years age group. The AARs were determined using the direct standardization method, with World Standard Population 2000 as the reference. The AAIR of the leading cancer site was compared with the AAIRs of other Indian PBCRs and with those of countries with the highest AAIRs for the same cancer site. For this, we utilized data from Cancer Incidence in Five Continents (CI5-Volume XII) [15] and GLOBOCAN (2022) [4] data, respectively.
Sex-specific disparities in cancer incidence and mortality were evaluated using Standardized Rate Ratio (SRR), defined as AAR in the female AYA population divided by AAR in the male AYA population, with 95% confidence intervals (CI). Urban–rural (geographical) disparities were assessed by calculating sex-specific AAIR according to their residence.
In this study, participants were categorized into two age groups: adolescents and young adults (AYAs, aged 15–39 years) and individuals aged 40 years and above. This classification was selected to underscore the distinct challenges faced by AYAs, who are navigating major life transitions related to education, employment, financial stability, and family planning. In contrast, adults aged 40 years and above are generally considered to have achieved greater stability in these domains. Although a more granular age group stratification (e.g., 40–49, 50–59 years) could potentially yield additional insights, the sample size limitations of this study precluded meaningful subgroup analysis. Thus, the dichotomous age grouping was maintained to align with the primary objective of examining disparities in cancer burden and care specific to AYAs within the study context.
To assess sociodemographic and cancer care disparities between AYAs and adults aged ≥ 40 years, univariable and multivariable regression analyses were conducted. Variables with a p-value of < 0.2 in univariable analysis were included in the multivariable model after assessment for collinearity [8]. Crude and adjusted odds ratios (ORs) with 95% confidence intervals (CIs) were calculated, with statistical significance set at p < 0.05. Data were entered and analyzed using Microsoft Excel and the Statistical Package for the Social Sciences (SPSS, version 21).
Ethical considerations
This study utilized de-identified data from Varanasi’s PBCR, which is integrated into hospital services and routine public health surveillance to monitor the impact of cancer control programs within the district. According to national [16] and international [17] guidelines, such activities are exempt from ethical review by the review board. Consequently, this study did not require ethics approval or consent to participate. The research was conducted following the provisions of the Declaration of Helsinki regarding research involving human subjects. Neither patients nor the public were involved in the design, conduct, reporting, or dissemination plans of this research.
Results
Epidemiological profile of AYAs cancer patients in Varanasi
Of the 6821 patients registered under Varanasi PBCR from 2017 to 2019, 16.2% of incident cancers (1105) were from the AYA age group (Table 1). Among these AYA patients, more than half were males (604, 54.7%), and the majority had secondary or higher levels of education (761, 68.7%). Most of them were from rural backgrounds (560, 50.7%), were Hindu by religion (923, 83.5%), and spoke Hindi as their mother tongue (1046, 94.6%). Almost half (542, 49.0%) were unemployed, students, or homemakers, and most belonged to lower income levels (501, 45.3%) (Supplementary Table 1).Table 1. Distribution of registered cancer patients according to the sex and age groups, 2017–2019 (n = 6821)Age group (in years)Frequency (Percentage)MaleFemaleBoth sexes0–14116 (3.0)40 (1.3)156 (2.3)15–39604 (15.7)501 (16.8)1105 (16.2)40–591639 (42.6)1470 (49.4)3109 (45.6) ≥ 601487 (38.7)964 (32.4)2451 (35.9)Total3846 (56.4)2975 (43.6)6821 (100)
Burden and disparities in pattern among AYAs cancer patients in Varanasi
The overall AAIR for cancer among AYA patients was 21 per 100,000 population, and specifically among AYA males and females, it was 22.2 and 19.5 per 100,000 population, respectively. The overall AAMR for cancer-related deaths among the AYA patients was 9.3 per 100,000 population, and it was 10.6 and 7.9 for male and female AYA patients, respectively (Supplementary Fig. 1).
Further analysis by age subgroups revealed that for males, the AAIR was 1.6 for ages 15–19, 6.6 for ages 20–29, and 14.0 for ages 30–39. When females were considered, the AAIR was 1.0 for ages 15–19, 5.5 for ages 20–29, and 13.0 for ages 30–39. (Supplementary Fig. 2). Whereas the incidence proportions for mouth, tongue, breast, uterine cervix, lung, and gall bladder cancers increased with age, the incidence proportions for ovarian, haematological, brain, rectal, bone, and soft tissue malignancies decreased (Fig. 1).Fig. 1. Proportions (%) of primary site-specific cancer incidence among the different age groups in Adolescent and Young Adult cancer patients in Varanasi, 2017–2019
The overall leading cancers among AYA patients were from mouth (16.5%, AAIR 3.5 per 10,000 population), breast (12.2%, AAIR 2.6 per 100,000 population), tongue (6.2%, AAIR 1.3 per 100,000 population), myeloid leukaemia (5.2%, AAIR 1.1 per 100,000 population) and gallbladder (4.4%, AAIR 0.9 per 100,000 population) (Supplementary Table 2).
Among the AYA males, leading cancer sites were the mouth, tongue, myeloid leukaemia, rectum, and bone tumours with AAIR of 6.3, 2.3, 1.3, 1.0, and 1.0 per 10,000 population, respectively. (Supplementary Table 3) For AYA females, leading cancer sites were breast, cervix, ovary, gallbladder, and myeloid leukaemia, with AAIRs of 5.3, 1.8, 1.5, 1.4, and 0.9 per 100,000 population, respectively. (Supplementary Table 4) The lifetime risk of developing cancer (15–39 years) among AYAs was highest for the mouth and breast for males and females, respectively. (Supplementary Tables 5,6). Oral cancer (mouth and tongue; C00-C06) was the leading cancer site among male AYAs in Varanasi, with a truncated AAIR of 9.2 per 100,000 population. When compared to other Indian registries using CI5 data, Varanasi had the third- highest AAIR for oral cancer among 26 Indian PBCRs (Fig. 2) Additionally, AAIR for oral cancer in Varanasi male AYAs was significantly higher than the GLOBOCAN estimates for the top 15 countries with the highest AAIR for oral cancer in AYAs (Supplementary Fig. 3).Fig. 2. Age-adjusted Truncated Incident rates of oral cancer (C00-C06) among Indian Adolescent and Young Adult males in 25 population-based cancer registries
When compared to males, females have a higher risk of developing stomach cancer (2.67 times), gallbladder cancer (3.2 times), and thyroid cancer (3.8 times). Conversely, males have a significantly greater likelihood of developing cancers of the tongue (7.7 times), the mouth (10 times), and the pancreas (3.4 times). Moreover, males have approximately twice the risk of developing cancers of the colorectal, bone, brain, and central nervous system, as well as haematological malignancies, including Hodgkin and non-Hodgkin lymphoma and leukaemia (Table 2).Table 2. Female-to-Male Incidence Rates and Standardized Rate Ratios (SRR) Incidence for the Leading Sites in Patients Aged 15 to 39 Years, 2017 to 2019ICD codeCancer TypeMale AAIRFemale AAIRSRR95% Confidence IntervalAll Cancer Combined22.219.50.880.910.85C01-C02Tongue2.30.30.130.160.11C03-C06Mouth6.30.60.100.120.09C07-C08Salivary Glands0.20.10.550.800.38C11Nasopharynx0.00.12.415.041.15C15Oesophagus0.10.11.522.410.96C16Stomach0.20.52.673.522.03C18Colon0.70.30.450.560.36C19Rectum1.00.50.520.620.43C21Anus0.10.21.361.930.95C22Liver0.60.81.351.621.13C23-C24Gallbladder0.51.43.193.762.70C25Pancreas0.30.10.290.430.19C30-C31Nose, Sinuses0.20.00.180.300.10C32Larynx0.10.10.981.500.64C33-C34Trachea, bronchus and lung0.50.30.590.740.47C40-C41Bone1.00.40.390.470.32C44,C47,C49Connective and Soft Tissue0.60.71.271.531.06C64Kidney0.20.21.171.680.82C67Bladder0.20.20.881.250.62C70-C72Brain, Nervous System0.90.40.440.530.36C73Thyroid0.20.73.825.002.92C81Hodgkin Disease0.40.20.490.660.37C82-C85,C96Non-Hodgkin Lymphoma0.50.20.390.520.29C92-C94Myeloid Leukaemia1.30.90.740.860.64C95Leukaemia Unspecified0.60.30.540.680.43O&UOther Unspecified1.50.70.490.570.42
Urban males had higher AAIR than rural males (12.3 vs. 10.5 per 100,000 population), but rural females had a higher AAIR than urban females (10.2 vs. 8.9 per 100,000 population). The AAMR was the same for urban and rural males (6.3 per 100,000 population) but higher in rural females compared to urban females (5.9 vs. 3.8 per 100,000 population) (Fig. 3).Fig. 3. Age-adjusted cancer incidence (AAIR) and mortality (AAMR) rates (per 10,000) according to the geographical residence among Adolescent and Young Adult cancer patients in Varanasi, 2017–2019
Disparities in sociodemographic and cancer care characteristics between AYA and adults aged ≥ 40 years
On multivariable regression analysis, AYA patients had 2 to 5 times greater odds of achieving higher education levels than older patients (aged ≥ 40 years). However, AYA patients exhibited lower odds of employment and achieving higher income levels compared to older patients. Additionally, AYA patients were significantly more likely to receive cancer confirmation through microscopic verification and were more likely to have completed or undergoing cancer treatment compared to older patients (Table 3).Table 3. Multivariable regression analysis showing the differences in the distribution of socio-demographic and cancer-related variables between the AYA cancer patients and older patients aged ≥ 40 years (n = 6725)Variables40 years & aboveN (%)15–39 yearsN (%)CrudeOdds ratio(95% CI)P valueAdjustedOdds ratio(95% CI)P valueSex Female2434 (43.8)501 (45.3)Ref Male3126 (57.2)604 (54.7)0.94 (0.82–1.07).339––Geographical residence Rural2756 (49.6)560 (50.7)Ref Urban2804 (50.4)545 (49.3)0.99 (0.84–1.09).500––Education Illiterate1267 (22.8)110 (10.0)Ref Literate1258 (22.6)217 (19.6)1.99 (1.56–2.53).0002.03 (1.58–2.60).000 Up to secondary2157 (38.8)507 (45.9)2.71 (2.18–3.36).0003.18 (2.54–4.00).000 Senior secondary779 (14.0)254 (23.0)3.76 (2.95–4.78).0005.24 (4.03–6.82).000 No information99 (1.8)17 (1.5)1.98 (1.14–3.43).0151.49 (0.74–2.98).264Mother tongue Hindi5154 (92.3)1046 (94.7)Ref Others406 (8.7)59 (6.3)0.72 (0.54–0.95).0200.81 (0.60–1.09)0.164Religion Hindu4944 (88.9)923 (83.5)Ref Others616 (11.1)182 (16.5)1.58(1.32–1.89) < 0.011.88(1.55–2.27)** < 0.01Occupation** Unemployed, student, house-wife2157 (38.8)542 (49.1)Ref Farmer, skilled, semi-skilled, unskilled workers2334 (42.0)393 (35.5).67 (0.58–0.77).000.61(0.53–0.71).000 Professional, semi-professional, clerical, government, private employees1004 (18.0)156 (14.1).62 (0.51–0.75).000.45 (0.36–0.56).000 No information65 (1.2)14 (1.3).86 (0.48–1.54).606.79 (0.38–1.66).540Income Lower2420 (43.5)501 (45.3)Ref Lower middle1926 (34.6)353 (31.9).885 (0.76–1.03).109.798 (0.68–0.93).005 Upper and upper middle801 (14.4)130 (11.8).784 (0.64–0.97).022.669 (0.53–0.84).001 No information413 (7.4)121 (10.9)1.415 (1.13–1.77).0021.421 (1.11–1.82)**.005Basis of diagnosis** Clinical only480 (8.6)83 (7.5)Ref Radiology569 (10.2)87 (7.9).88 (0.64–1.22).457.99 (0.71–1.39).961 Verbal autopsy967 (17.4)133 (12.0).79 (0.59–1.07).129.97 (0.71–1.32).832 DCO31 (0.6)5 (0.5).93 (0.35–2.47).8881.08 (0.40–0.91).885 Histology2959 (53.2)654 (59.2)1.28 (1.00–1.64).0521.19 (0.92–1.53).192 Cytology554 (10.0)143 (12.9)1.49 (1.11–2.00).0081.42 (1.04–1.93).026****Treatment type No/ alternative treatment518 (89.6)60 (10.4)Ref Any definitive treatment1467 (83.0)300 (17.0)1.77 (1.31–2.37).0001.29 (0.90–1.83).164 Multimodality treatment2063 (81.5)469 (18.5)1.96 (1.48–2.61).0001.27 (0.89–1.81).186 Palliative1068 (85.1)187 (14.9)1.51 (1.11–2.06).0091.42 (1.00–2.04).058 No information444 (83.3)89 (16.7)1.73 (1.22–2.46).0021.41 (0.90–2.21).129Treatment status Not completed2465 (44.3)368 (33.3)Ref Complete1185 (21.3)312 (28.2)1.764 (1.49–2.08).0001.518 (1.26–1.83).000 Ongoing1109 (19.9)284 (25.7)1.715 (1.45–2.03).0001.473 (1.23–1.76).000 Not applicable233 (4.2)28 (2.5).805 (0.54–1.21).2961.053 (0.64–1.72).836 No information568 (10.2)113 (10.2)1.333 (1.06–1.68)0.0141.204 (0.87–1.67).269
Discussion
There is an increase in focus towards AYA oncology in India. Furthermore, a recent nationwide study on data from 28 PBCRs and 58 HBCRs from India reported significant increase in cancer incidence, especially among AYA males [7]. India, one of the largest countries with a highly diverse population, necessitates region-specific studies to understand the cancer burden and associated disparities. Such studies are crucial for presenting and formulating effective AYA-specific cancer prevention and control policies. To the best of our knowledge, this is the first study from India to analyze age, sex, geographical, and cancer care-related disparities among Indian AYA population. This study provides an in-depth analysis of the cancer burden among the AYA population in Varanasi district of Uttar Pradesh, India's largest state, utilizing data from PBCR for 2017–2019.
Cancer burden among the AYAs
Out of 6,821 registered patients, 16.2% (1,105) were AYA, with a majority being male (54.7%) and half from rural backgrounds (50.7%). Compared to 28 PBCRs in India (2012–2016), the Varanasi PBCR (2017–2019) reported the sixth highest proportion of AYA cancers (16.2%), following regions such as West Arunachal (20%), Nagaland (19.7%), Pasighat (17.9%), Nagpur (17.4%), and Aurangabad (17.2%) [18]. North American data (2011–2015) reported 5% AYA cancers [2], while Japan (2016–2018) [19] and the European Union (2020) [20] reported 2% and 5%, respectively. India’s higher proportion of young population likely contributes to the higher AYA cancer burden [18]. Our findings highlight the need to prioritize AYA cancer surveillance in national cancer control programs, develop region-specific cancer registries and epidemiological studies to inform targeted strategies, and implement AYA-specific health education to raise risk awareness.
Leading cancer sites among the AYAs
We observed that overall leading cancers among Varanasi AYA patients were mouth (16.5%, AAIR 3.5 per 10,000 population), breast (12.2%, AAIR 2.6 per 100,000 population), tongue (6.2%, AAIR 1.3 per 100,000 population), myeloid leukaemia (5.2%, 1.1 per 100,000) and gallbladder (4.4%, 0.9 per 100,000 population). However, as per GLOBOCAN (2022), leading cancer incidence sites among the Indian AYA for both sexes in terms of absolute numbers were breast (17.2%), lip and oral cavity (11.2%), cervix uteri (9.8%), leukaemia (8.4%) and thyroid (4.9%) [4]. Globally, the leading sites among AYA included breast (18.6%), thyroid (17.9%), cervix uteri (8.0%), leukaemia (4.9%) and colorectum (4.5%), non-Hodgkin lymphoma (3.9%) [4].
The observed pattern of cancer incidence among AYA patients in Varanasi highlights both local and broader epidemiological influences. Mouth cancer emerged as the leading cancer site, aligning with the high prevalence of smokeless tobacco (SLT) use, often combined with areca nut, deeply rooted in the local culture [8, 12]. Breast cancer, the second most common site, is consistent with national and global data, underscoring its significance as a leading malignancy among young women [4]. Haematological malignancies, such as myeloid leukaemia, also featured prominently, reflecting patterns reported in both Indian and global datasets specific for AYA populations [4]. Of particular note is the relatively high incidence of gallbladder cancer in this study. This finding may be attributed to multiple region-specific factors, including high mustard oil consumption, a known risk factor for gallbladder cancer, as well as the prevalence of cholelithiasis, chronic typhoid infection, and the consumption of contaminated snails, which may harbor liver flukes. Additionally, arsenic contamination of groundwater—a concern particularly in rural areas of the Varanasi region—has been increasingly recognized as a potential contributor to gallbladder carcinogenesis [8]. Previous studies from India, including population-based cancer registries and case–control studies, have also reported a higher incidence of gallbladder cancer in rural populations, lending support to these findings [8]. Overall, the cancer profile observed in Varanasi’s AYA population highlights the interplay of lifestyle, cultural, and environmental factors unique to the region, while also reflecting broader trends observed at the national and global levels.
While cancers like mouth, tongue, breast, and cervix can be managed through effective screening and early detection, India’s population-based screening coverage remains inadequate, particularly in Uttar Pradesh [12, 22]. This calls for research and practical strategies to improve screening reach and uptake. Although smoking rates have slightly declined, the continued high prevalence of smokeless tobacco and areca nut use remains a significant concern, especially in regions like Varanasi [23–26]. Additionally, cancers such as rectum, breast, ovary, and gallbladder have strong associations with obesity and metabolic diseases [27]. Alarmingly, a national survey found abdominal obesity rates of 32.2% (32.0–32.4) and 49.3% (49.0–49.5) in the 20–39 and 30–39 age groups, respectively [28]. Addressing these risk factors requires robust health education campaigns promoting lifestyle changes and strict enforcement of regulations like the Cigarettes and Other Tobacco Products Act (COTPA) [29]. Integrating cancer screening with existing adolescent health programs and establishing adolescent-friendly clinics could facilitate early detection and prevention of risk factors.
The AAIR increased with age, peaking in 35–39 age group, consistent with Indian and international studies. Incidence proportions rose with age for cancers of mouth, tongue, breast, uterine cervix, lung, and gall bladder, while it declined for ovarian, haematological, brain, rectal, bone, and soft tissue malignancies. Data from 28 Indian PBCRs showed higher rates of haematological cancers in the 15–24 age group and breast, mouth, and tongue cancers in the 30–39 age group [7]. Similar findings were reported in US [30] and Japanese [19] registry studies, with haematological, soft tissue, and central nervous tumours more common in 15–19-year-olds and breast, uterine cervix, and gastrointestinal cancers predominant in older groups.
Disparities in cancer patterns among AYAs
Geographical disparities in cancer incidence and mortality among AYAs were notable. The overall AAIR was similar in urban and rural settings (21.3 vs 20.7 per 100,000), but mortality rates were higher in rural areas (AAMR: 12.1 vs. 10.1), particularly among females (AAMR: 5.9 vs. 3.8), while males had same AAMRs. These findings, consistent with Indian [8] and Nepal [31] studies, emphasize increasing rural healthcare funding for women, establishing mobile screening units and adolescent-friendly clinics, and leveraging local influencers to promote cancer screening and health-seeking behaviour among young women.
In Varanasi, the AAIR for all cancers among AYA is higher in males (22.2 per 100,000 population) than in females (19.5 per 100,000 population), largely due to the high incidence of oral cancer linked to tobacco and areca nut use among males. Conversely, across 28 Indian PBCRs, the median AAIR is higher in females (29.2 per 100,000 population) than in males (22.2 per 100,000 population), with breast, thyroid, gall bladder and cervical cancers contributing significantly to female incidence rates [7]. Similarly, cancer registries in the US [30] and Europe [20] report higher AAIRs in AYA females than males due to the prevalence of these cancers in females.
Disparities in sociodemographic characteristics and cancer care between AYA patients and older adults
The multivariable analysis revealed significant socio-demographic and cancer-related disparities between AYA patients and those aged ≥ 40 years. AYAs had 2 to 5 times higher odds of better education but lower odds of employment and income compared to older patients. They were also more likely to have cancer confirmed microscopically, reflecting better diagnostic access linked to higher education and health literacy, which may enable timely care. AYAs were more likely to complete or be undergoing treatment, supported by their education and strong social networks, which can help overcome socio-economic challenges. However, higher wealth and job stability among older patients do not always translate to better healthcare utilization, as factors like geography, family background, and systemic inequalities also play key roles [32]. The lower income and employment status among AYAs, a critical working-age group, highlight their financial vulnerability during cancer treatment. Expanding financial assistance, patient navigation, peer support, and empowering AYAs with healthcare resources is essential to address these barriers and improve outcomes.
The overall study findings call for multilevel interventions: at the individual level, enhance awareness of risk factors and screening, especially for oral and breast cancers; at the community level, leverage peer networks, community leaders, and culturally sensitive education to promote behavior change like tobacco cessation; at the health system level, integrate AYA-specific cancer screening into primary care, train providers in early detection and culturally competent care, and implement patient navigation; and at the policy level, strengthen regulations such as COTPA, provide financial assistance, address environmental risks, and expand PBCR capacity for robust data.
Limitations
This study, based on a newly established PBCR, faced limitations. We had limited follow-up information to analyse 5-year survival rates. Additionally, case ascertainment completeness indices indicated an under-registration of 10–20% in different district blocks, notably among rural, elderly, and pediatric populations, especially girls, due to disparities in service accessibility. Since we utilized only incidence-based data, we could not evaluate crucial variables such as cancer staging, health insurance, comorbidities, awareness information, and risk factors, including lifestyle and environmental factors. Consequently, these findings cannot be generalized to reflect nationwide disparities. Our analysis compared AYAs with individuals aged 40 years and above to highlight differences in sociodemographic characteristics and cancer care disparities. We recognize that grouping all individuals aged 40 and above into a single category encompasses a diverse population with varying life experiences and potentially distinct impacts from cancer. However, given the limited sample size and our focus on delineating the specific challenges of AYAs, further stratification of the older group was not feasible. This limitation should be considered when interpreting our findings. Future research with larger populations may allow for more granular analysis of older age subgroups.
Conclusion
This study highlights the critical need for focused adolescent and young adult oncology in Indian settings, given the significant cancer burden among this age group in Varanasi, Uttar Pradesh. The data reveal distinct sex-specific, geographical disparities and social disparities in cancer incidence, mortality and care seeking. Effective cancer prevention and control policies must address these disparities through targeted health education, robust screening programs, and enhanced access to healthcare. Integrating cancer screening with adolescent health programs and enhancing support networks can improve early detection and treatment outcomes for AYA patients. Addressing socio-economic barriers and promoting cancer awareness is crucial for improving care utilization across demographic groups. The high burden of oral cancer among adolescents and young adults underscores urgent comprehensive action for tobacco control. This study underscores the importance of region-specific research in informing and formulating effective AYA-specific cancer prevention and control strategies.
Supplementary Information
Below is the link to the electronic supplementary material.Supplementary file1 (DOCX 90 KB)
The reference list from the paper itself. Each links out to its DOI / PubMed record.
- 1International Agency for Research on Cancer. Cancer today. GLOBOCAN 2022. Geneva, Switzerland: World Health Organization. 2022. Available: https://gco.iarc.fr/today/home (Accessed on 30.10.2024)
- 2CI 5 XII. Cancer Incidence in Five Continents Volume XII. International Agency for Cancer Research. World Health Organization. https://ci 5.iarc.fr/ci 5-xii/download (Accessed on 30.10.2024)
- 3National Ethical Guidelines for Biomedical and Health Research Involving Human Participants. Indian Council of Medical Research 2017. Available from https://ethics.ncdirindia.org/asset/pdf/ICMR_National_Ethical_Guidelines.pdf. (Accessed on 30.10.2024)
- 4Revised Common Rule Consideration for Use of State Mandated Central Cancer Registry Data: Guidance, Examples, and Q&A. National American Association of Central Cancer Registries. 2021 [cited 2023 Dec 27]. Available from https://www.naaccr.org/wp-content/uploads/2021/03/Revised-Common-Rule-QA-for-Registries_Final_3.26.21.pdf. (Accessed on 30.10.2024)
- 5Tata Institute of Social Sciences (TISS), Mumbai and Ministry of Health and Family Welfare, Government of India. Global adult tobacco survey, GATS-2 India 2016–17 [Internet]; 2018. Available from: https://ntcp.nhp.gov.in/assets/document/surveys-reports-publications/Global-Adult-Tobacco-Survey-Second-Round-India-2016-2017.pdf. (Accessed on 30.10.2024)
- 6Ministry of Health and Family Welfare, Government of India, International institute of population sciences. Global youth tobacco survey, GYTS-4 [Internet]; 2019. Available from: https://ntcp.nhp.gov.in/assets/document/National_Fact_Sheet_of_fourth_round_of_Global_Youth_Tobacco_Survey_GYTS-4.pdf. (Accessed on 30.10.2024)