Preserving joint line orientation in TKA improves short‐ to mid‐term outcomes: A systematic review and meta‐analysis
Dúnio Jácome‐Pacheco, Tiago Torres, Gonçalo Rodrigues, Pedro Diniz, Francisco Guerra‐Pinto, António Camacho, João Gamelas, Romain Seil, Michael T. Hirschmann

TL;DR
Preserving the joint line orientation during knee replacement surgery improves patient outcomes in the short to mid-term.
Contribution
This study shows that aligning TKA with individual knee anatomy improves functional outcomes compared to standard approaches.
Findings
Joint line preserving techniques improved patient-reported outcome measures like FJS and KOOS.
Subgroup analyses confirmed benefits in low-risk studies, supporting the effectiveness of JLP approaches.
Results suggest personalized surgical strategies based on knee phenotype may optimize TKA outcomes.
Abstract
Joint line orientation (JLO) has been identified as a potential factor influencing clinical outcomes following total knee arthroplasty (TKA). This systematic review and meta‐analysis aimed to assess whether preserving the JLO according to the individual knee phenotype is associated with improved clinical and functional outcomes. We hypothesised that joint line preserving (JLP) techniques would result in superior patient‐reported outcome measures (PROMs) and better functional performance compared to non–joint line preserving (nJLP) approaches. A systematic search of Pubmed, CENTRAL, and Web of Science was conducted to identify comparative studies evaluating JLP versus nJLP in TKA. Studies reporting PROMs and other clinical indicators with a minimum follow‐up of 12 months were included. Risk of bias was assessed using the RoB 2 tool for randomised trials and the ROBINS‐I tool for…
Genes, proteins, chemicals, diseases, species, mutations and cell lines named across the full text — each resolved to its canonical identifier and authoritative record.
Click any figure to enlarge with its caption.
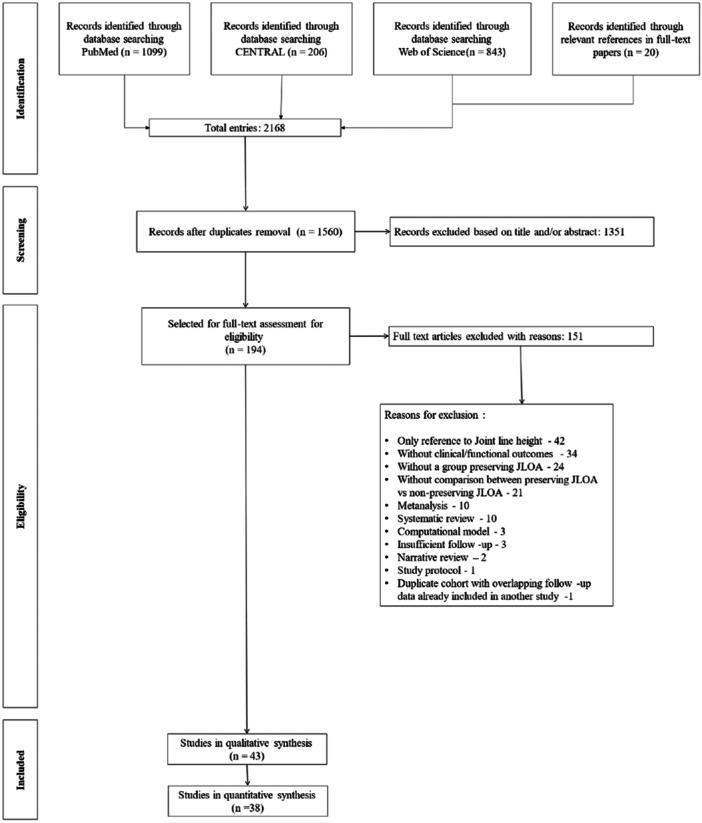 Figure 1
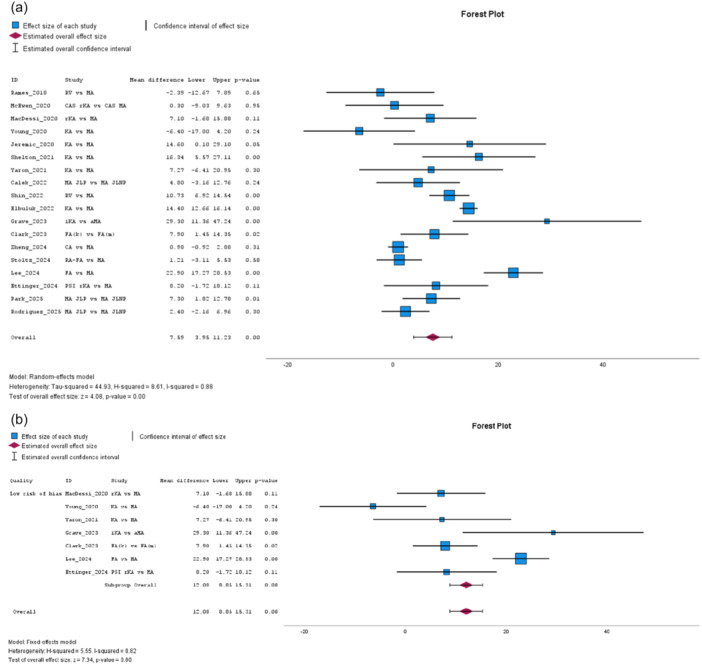 Figure 2
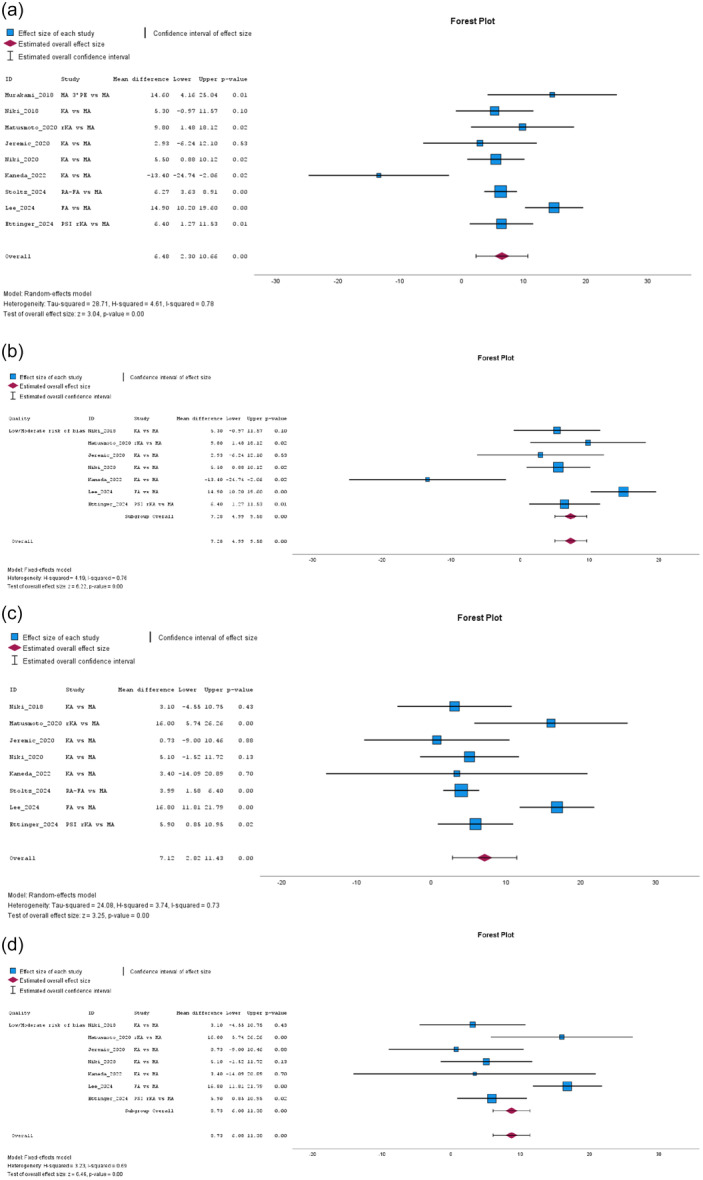 Figure 3
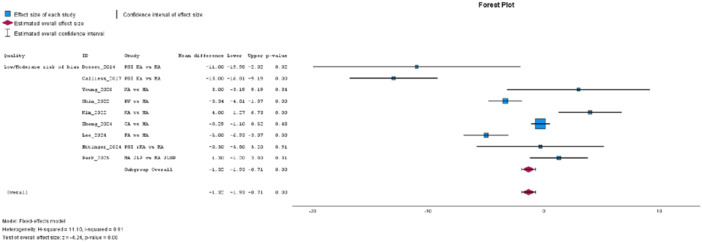 Figure 4
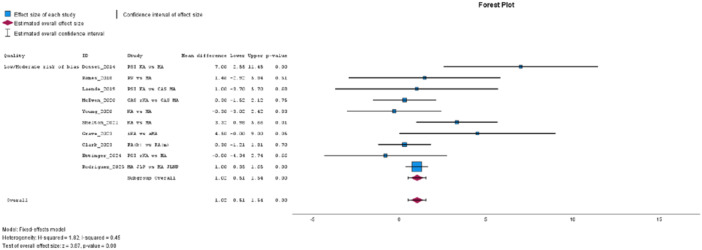 Figure 5
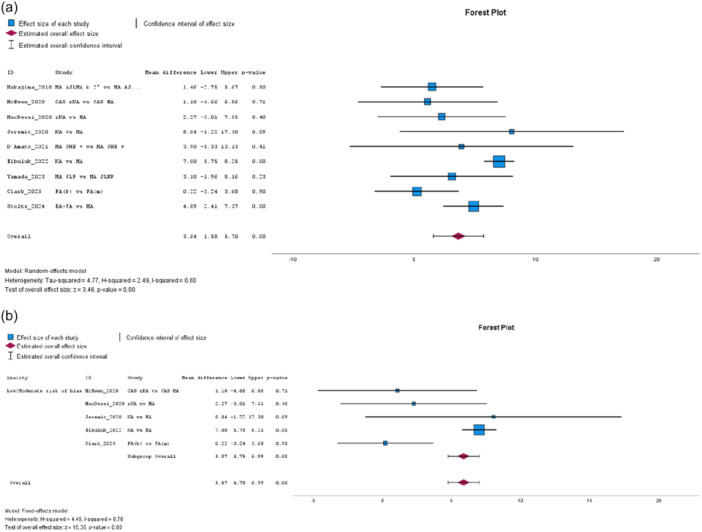 Figure 6
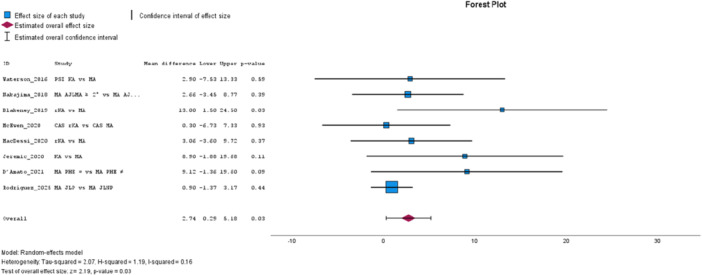 Figure 7
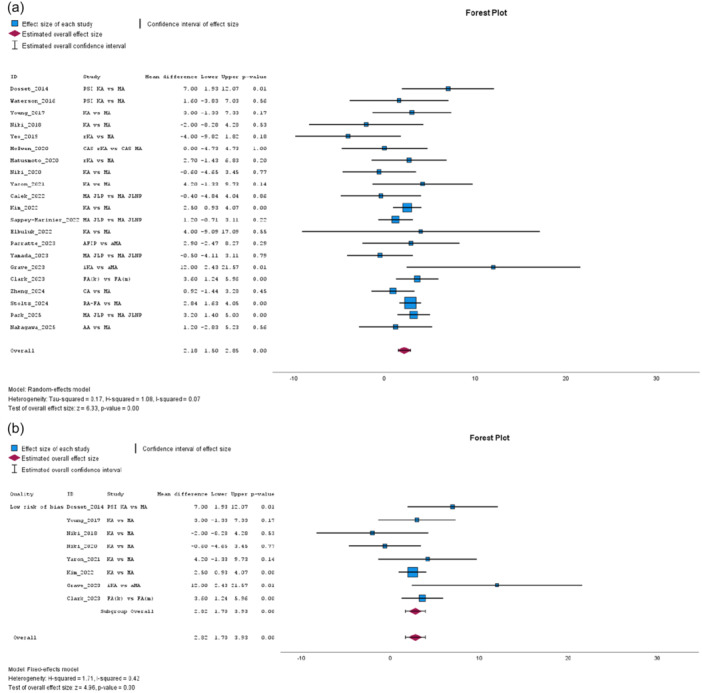 Figure 8
| Study | Type/level of evidence | Quality | JLP assessment/method | Alignment technique groups | Prosthesis/computer or robotic assisted | Number of TKA (JLP vs. nJLP) | Outcome scales | Outcomes Favouring JLP (Statistically Significant) |
|---|---|---|---|---|---|---|---|---|
| Dosset et al. [ | RCT Level I | Some concerns | MPTA | PSI KA vs. MA | Vanguard®/‐ | 44 vs. 44 | KSS; OKS; Pain free %; ROM; WOMAC | KSS; OKS; Pain free %; ROM; WOMAC |
| Waterson et al. [ | RCT Level I | Some concerns | MRI‐based cutting guides; MPTA | PSI KA vs. MA | Triathlon®/‐ | 26 vs. 21 | 2 min walk; EQ‐5D; KOOS; KSS; Peak Tq hams; Peak Tq quads; ROM; SF‐36; TUG; UCLA | Peak Tq hams |
| Calliess et al. [ | RCT Level II | Some concerns | MRI‐based cutting guides; MPTA | PSI KA vs. MA | Triathlon®/‐ | 100 vs. 100 | KSS; WOMAC | KSS; WOMAC |
| Matsumoto et al. [ | RCT Level I | Some concerns | JLO relative to the floor | rKA vs. MA | E‐motion® or Persona®/Navigation system Orthopilot 4.2 | 30 vs. 30 | KSS; ROM | KSS |
| Niki et al. [ |
Prospective cohort Level II | Moderate risk of bias | CT‐based measured resection | KA vs. MA | LPS‐FLEX®/ATHENA® | 21 vs. 21 | KAM; KSS; ROM | KAM |
| Young et al. [ | RCT Level I | Low risk of bias | MRI‐based cutting guides | PSI KA vs. MA | Triathlon®/PSI KA ‐ OtisMed®; MA computer navigation system Stryker® | 49 vs. 50 | EQ‐5D; FJS; KSS; OKS; ROM; VAS; WOMAC | ‐ |
| Rames et al. [ |
Retrospective cohort Level III | Moderate risk of bias | MPTA | RV vs. MA | No mention/‐ | 50 vs. 181 | FJS; OKS; SF‐12 MCS; SF‐12 PCS | ‐ |
| Nakajima et al. [ |
Retrospective cohort Level III | Serious risk of bias | AJLMA | MA AJLMA ≥ 2° vs. MA AJLMA < 2° | FINE® 3° inclined PE/‐ | 74 vs. 75 | KOOS; KSS | KOOS‐ADL |
| Murakami et al. [ |
Retrospective cohort Level III | Serious risk of bias | MPTA | MA 3° PE vs. MA | Journey II® BCS; NexGen® PS/‐ | 23 vs. 23 | KSS | KSS function |
| Niki et al. [ |
Prospective cohort Level II | Low risk of bias | CT‐based measured resection | KA vs. MA |
LPS‐FLEX®/ATHENA®; iASSIST® navigation system | 45 vs. 45 | KSS; ROM | KSS function |
| Blakeney et al. [ |
Case–control Level III | Moderate risk of bias | JLO relative to the floor; MPTA | rKA vs. MA | Triathlon®/Orthomap® navigation | 18 vs. 18 | Kinematics analysis; KOOS | KOOS; Knee abduction–adduction curves; Swing phase knee flexion; Walking speed |
| Yeo et al. [ | RCT Level I | High risk of bias | Coronal tibial inclination | rKA vs. MA | NexGen®/ROBODOC® | 30 vs. 30 | Gait analysis; HSS; KSS; ROM; WOMAC | GRF medial–lateral |
| Laende et al. [ | RCT Level I | Some concerns | MRI‐based cutting guides; MPTA | PSI KA vs. MA | Triathlon®/PSI KA ‐ OtisMed®; CAS‐MA Precision Navigation System® | 24 vs. 23 | OKS; UCLA; VAS | ‐ |
| McEwen et al. [ | RCT Level I | Some concerns | JLO relative to the floor |
rKA vs. MA (bilateral TKA) | Triathlon®/Precision Navigation System® | 41 vs. 41 | FJS; Knee preference; KOOS; KOOS‐JR; OKS; ROM | Knee preference |
| MacDessi et al. [ | RCT Level I | Low risk of bias | MPTA | rKA vs. MA | Legion®/Orthomap® navigation | 70 vs. 68 | EQ‐5D; FJS; KOOS | ‐ |
| Niki et al. [ |
Prospective cohort Level II | Low risk of bias | CT‐based measured resection; MPTA | KA vs. MA |
NexGen Zimmer‐Biomet®/OrthAlign® navigation | 100 vs. 100 | KSS; Pain catastrophizing scale; PDS; ROM | KSS function |
| Jeremić et al. [ |
Case‐control Level III | Moderate risk of bias | MPTA | KA vs. MA | GMK Sphere®– Medacta/‐ | 24 vs. 24 | FJS; KSS; KOOS | FJS; KOOS‐Sports; KSS |
| Young et al. [ | RCT Level I | Low risk of bias | MRI‐based cutting guides | PSI KA vs. MA | Triathlon®/PSI KA ‐ OtisMed®; MA computer navigation system Stryker® | 47 vs. 48 | EQ‐5D; FJS; KSS; OKS; VAS; WOMAC | ‐ |
| Matsumoto et al. [ | RCT Level I | Some concerns | CT‐based navigation assisted resection | rKA vs. MA |
E‐motion®/ Navigation system Orthopilot 4.2 | 30 vs. 30 | KSS; ROM | KSS function; KSS Knee Score; KSS satisfaction; ROM |
| Shelton et al. [ |
Retrospective cohort Level III | Moderate risk of bias | Calipered resection | KA vs. MA | No mention/‐ | 78 vs. 78 | FJS; OKS | FJS; OKS |
| D'Amato et al. [ |
Retrospective cohort Level III | Serious risk of bias | JLO relative to the floor | MA PHE restored vs. MA PHE changed | Genesis II®/‐ |
KOOS 47 vs. 29 KSS 55 vs. 35 | KOOS; KSS | KOOS‐Symptoms |
| Yaron et al. [ |
Retrospective cohort Level III | Low risk of bias | MPTA | KA vs. MA | No mention/‐ | 38 vs. 38 | FJS; ROM | FJS |
| Kaneda et al. [ | RCT Level II | Some concerns | MPTA | KA vs. MA | Evolution®/‐ | 8 vs. 5 | Kinematic analysis; KSS |
Flexion femoral external rotation; Medial pivoting |
| Shin et al. [ |
Case‐control Level III | Moderate risk of bias | G‐Plafond | RV vs. MA |
E‐motion®/ Navigation system Orthopilot 4.2 | 99 vs. 99 | FJS; KSS; WOMAC | FJS; WOMAC |
| Calek et al. [ |
Retrospective cohort Level III | Serious risk of bias | JLO relative to the floor | MA Horizontal JLO vs. MA Oblique JLO |
Attune® or LCS®/ Computer‐navigated | 36 vs. 40 | FJS; ROM | ‐ |
| Kim et al. [ |
Retrospective cohort Level III | Low risk of bias | MPTA; JLO relative to the floor | KA vs. MA | Persona®/‐ | 42 vs. 126 | KSS; ROM; SF‐36; WOMAC | ‐ |
| Sappey‑Marinier et al. [ |
Retrospective cohort Level III | Serious risk of bias | MPTA + LDFA (joint line obliquity) | MA JLO restored vs. MA JLO changed | No mention/‐ | 194 vs. 884 | KSS; ROM | PHE JLO < 177°: KSS Knee score; KSS Pain subscale |
| Cherches et al. [ |
Retrospective cohort Level III | Serious risk of bias | MPTA | KA vs. MA | No mention/‐ | 95 vs. 35 | KOOS JR; PROMIS; VR12 | ‐ |
| Elbuluk et al. [ |
Prospective cohort Level II | Moderate risk of bias | CT‐based robotic resection | KA vs. MA | No mention/MAKO Stryker® robotic‐assistance | 100 vs. 100 | FJS; KOOS JR; ROM; VAS; VR12 | FJS; KOOS JR; VAS |
| Parratte et al. [ |
Case‐control Level III | Moderate risk of bias | MPTA; JLO relative to the floor | AFIP vs. aMA | Persona®/rKA robotic‐assisted | 40 vs. 40 | KSS; ROM | KSS function |
| Clark et al. [ |
Prospective cohort Level II | Low risk of bias | MPTA + LDFA (joint line obliquity) | FA(k) vs. FA(m) | Triathlon®/Mako® robotic system | 165 vs. 135 | EQ‐5D; FJS; KOOS JR; OKS; ROM; VAS | FJS; ROM |
| Yamada et al. [ |
Prospective cohort Level II | Serious risk of bias | JLO relative to the floor |
MA (3° PE) JLO restored vs. MA (3° PE) JLO changed | FINE®/‐ | 80 vs. 65 | KOOS; KSS; ROM | ROM |
| Rak et al. [ |
Prospective cohort Level II | Moderate risk of bias | TMA | MA PHE restored vs. MA PHE change | Triathlon®/‐ | 45 vs. 14 | FJS; OKS; WOMAC | ‐ |
| Grave et al. [ |
Case‐control Level III | Low risk of bias | MPTA | iKA vs. aMA | Triathlon®/Mako® robotic system | 19 vs. 17 | FJS; Gait analysis; OKS; ROM; VAS | FJS; Kinematic knee–sagittal ROM; OKS; ROM; VAS |
| Zheng et al. [ | RCT Level I | Some concerns | MPTA + LDFA (joint line obliquity) | CA vs. MA | Columbus®/Navigation system Orthopilot 5.1 | 38 vs. 38 | FJS; HSS; ROM; WOMAC | ‐ |
| Stoltz et al. [ |
Retrospective cohort Level III | Serious risk of bias | CT‐based robotic resection | RA‐FA vs. MA | Triathlon®/Not specified | 393 vs. 312 | FJS; KOOS‐JR; KSS; Likert scale; ROM; Satisfaction Rate; WOMAC | KOOS‐JR; KSS; Likert scale; ROM; Satisfaction rate; WOMAC |
| Pangaud et al. [ |
Retrospective cohort Level III | Moderate risk of bias | MPTA + LDFA (joint line obliquity) | MA JLO restored vs. MA JLO changed | Persona®; Anatomic®/‐ | 26 vs. 152 | FJS; KOOS; SKV | KOOS‐ADL; KOOS‐QoL |
| Lee et al. [ |
Retrospective cohort Level III | Low risk of bias | MPTA + LDFA (joint line obliquity) | FA vs. MA | Triathlon®/MAKO Stryker® robotic‐assistance | 70 vs. 140 | FJS; KSS; VAS; WOMAC | FJS; KSS function; WOMAC |
| Ettinger et al. [ | RCT Level II | Low risk of bias | CT‐based measured resection; MPTA | PSI rKA VS PSI MA | GMK Sphere®/‐ | 47 vs. 51 | FJS; KSS; OKS; WOMAC | FJS; KSS expectation; KSS function; KSS satisfaction |
| Park et al. [ |
Retrospective cohort Level III | Moderate risk of bias | MPTA + LDFA (joint line obliquity) | MA JLO restored vs. MA JLO changed | Journey II® BCS; Persona® PS/‐ | 106 vs. 106 | American KSS; Femoral Roll Back; FJS; ROM; WOMAC | Femoral roll back; FJS; ROM |
| Nakagawa et al. [ | RCT Level I | Some concerns | MPTA; JLO relative to the floor | AA vs. MA | Actiyas®/‐ | 40 vs. 40 | KOOS‐Pain; KOOS‐Symptom; KS‐KSS; KSQ; Knee preference; ROM | Knee preference; KSQ – Satisfaction |
| Rodríguez et al. [ |
Retrospective cohort Level III | Moderate risk of bias | MPTA + LDFA (joint line obliquity) | MA JLO restored vs. MA JLO changed | Saiph®/‐ | 16 vs. 78 | FJS; KOOS; OKS; UCLA; VAS | ‐ |
| Gibbons et al. [ | RCT Level I | Low risk of bias | MRI‐based cutting guides | PSI KA vs. MA | Triathlon®/‐ | 39 vs. 42 | EQ‐5D; FJS; KSS; OKS; WOMAC | ‐ |
| Authors | Year | Randomisation process | Deviations from the intended interventions | Missing outcome data | Measurement of the outcome | Selection of the reported result | Overall |
|---|---|---|---|---|---|---|---|
|
| |||||||
| Dosset et al. [ | 2014 | Low risk | Some concerns | Low risk | Low risk | Low risk | Some concerns |
| Waterson et al. [ | 2016 | Low risk | Some concerns | Low risk | Low risk | Low risk | Some concerns |
| Calliess et al. [ | 2017 | Some concerns | Some concerns | Low risk | Some concerns | Low risk | Some concerns |
| Matsumoto et al. [ | 2017 | Low risk | Some concerns | Low risk | Low risk | Low risk | Some concerns |
| Young et al. [ | 2017 | Low risk | Low risk | Low risk | Low risk | Low risk | Low risk |
| Laende et al. [ | 2019 | Low risk | Some concerns | Low risk | Low risk | Low risk | Some concerns |
| Yeo et al. [ | 2019 | Low risk | High risk | Low risk | Low risk | Low risk | High risk |
| Matsumoto et al. [ | 2020 | Low risk | Some concerns | Low risk | Low risk | Low risk | Some concerns |
| MacDessi et al. [ | 2020 | Low risk | Low risk | Low risk | Low risk | Low risk | Low risk |
| McEwen et al. [ | 2020 | Low risk | Some concerns | Low risk | Low risk | Low risk | Some concerns |
| Young et al. [ | 2020 | Low risk | Low risk | Low risk | Low risk | Low risk | Low risk |
| Kaneda et al. [ | 2022 | Some concerns | Some concerns | Low risk | Low risk | Low risk | Some concerns |
| Zheng et al. [ | 2024 | Low risk | Some concerns | Low risk | Low risk | Low risk | Some concerns |
| Ettinger et al. [ | 2024 | Low risk | Low risk | Low risk | Low risk | Low risk | Low risk |
| Nakagawa et al. [ | 2025 | Low risk | Some concerns | Low risk | Low risk | Low risk | Some concerns |
| Gibbons et al. [ | 2025 | Low risk | Low risk | Low risk | Low risk | Low risk | Low risk |
| Authors | Year | Confounding | Selection of participants into the study | Classification of interventions | Deviations from intended interventions | Missing data | Selection of the reported result | Overall |
|---|---|---|---|---|---|---|---|---|
|
| ||||||||
| Niki et al. [ | 2017 | Low risk | Low risk | Moderate risk | Low risk | Low risk | Low risk | Moderate risk |
| Nakajima et al. [ | 2018 | Serious risk | Low risk | Serious risk | Low risk | Low risk | Low Risk | Serious risk |
| Rames et al. [ | 2018 | Moderate risk | Low risk | Moderate risk | Low risk | Low risk | Low Risk | Moderate risk |
| Murakami et al. [ | 2018 | Serious risk | Moderate risk | Serious risk | Low risk | Low risk | Low Risk | Serious risk |
| Niki et al. [ | 2018 | Low risk | Low risk | Low risk | Low risk | Low risk | Low Risk | Low risk |
| Blakeney et al. [ | 2019 | Low risk | Moderate risk | Low risk | Low risk | Low risk | Low Risk | Moderate risk |
| Jeremić et al. [ | 2020 | Moderate risk | Low risk | Moderate risk | Low risk | Low risk | Low Risk | Moderate risk |
| Niki et al. [ | 2020 | Low risk | Low risk | Low risk | Low risk | Low risk | Low risk | Low risk |
| Yaron et al. [ | 2021 | Low risk | Low risk | Low risk | Low risk | Low risk | Low Risk | Low risk |
| D'Amato et al. [ | 2021 | Serious risk | Low risk | Serious risk | Low risk | Low risk | Low Risk | Serious risk |
| Shelton et al. [ | 2021 | Low risk | Moderate risk | Moderate risk | Low risk | Low risk | Low Risk | Moderate risk |
| Calek et al. [ | 2022 | Low risk | Low risk | Serious risk | Low risk | Low risk | Low Risk | Serious risk |
| Cherches et al. [ | 2022 | Serious risk | Low risk | Moderate risk | Low risk | Low risk | Low Risk | Serious risk |
| Kim et al. [ | 2022 | Low risk | Low risk | Low risk | Low risk | Low risk | Low Risk | Low risk |
| Yamada et al. [ | 2023 | Serious risk | Low risk | Serious risk | Low risk | Low risk | Low Risk | Serious risk |
| Shin et al. [ | 2022 | Low risk | Low risk | Moderate risk | Low risk | Low risk | Low Risk | Moderate risk |
| Sappey‑Marinier et al. [ | 2022 | Serious risk | Low risk | Serious risk | Low risk | Low risk | Low Risk | Serious risk |
| Elbuluk et al. [ | 2022 | Low risk | Low risk | Moderate risk | Low risk | Low risk | Low Risk | Moderate risk |
| Parratte et al. [ | 2023 | Moderate risk | Low risk | Moderate risk | Low risk | Low risk | Low Risk | Moderate risk |
| Rak et al. [ | 2023 | Moderate risk | Low risk | Moderate risk | Low risk | Low risk | Low Risk | Moderate risk |
| Grave et al. [ | 2023 | Low risk | Low risk | Low risk | Low risk | Low risk | Low Risk | Low risk |
| Clark et al. [ | 2023 | Low risk | Low risk | Low risk | Low risk | Low risk | Low Risk | Low risk |
| Stoltz et al. [ | 2024 | Serious risk | Moderate risk | Moderate risk | Low risk | Low risk | Low risk | Serious risk |
| Pangaud et al. [ | 2024 | Moderate risk | Low risk | Low risk | Low risk | Low risk | Low risk | Moderate risk |
| Lee et al. [ | 2024 | Low risk | Low risk | Low risk | Low risk | Low risk | Low risk | Low risk |
| Park et al. [ | 2025 | Moderate risk | Low risk | Moderate risk | Low risk | Low risk | Low risk | Moderate risk |
| Rodríguez et al. [ | 2025 | Moderate risk | Low risk | Low risk | Low risk | Low risk | Low risk | Moderate risk |
- —Authors' affiliated institutions
Peer Reviews
No public reviews on file for this paper yet. If you reviewed it on a platform where reviews are public (OpenReview, ICLR, NeurIPS, ICML), you can paste yours below so the community can read it here.
Videos
No videos yet. Explain this paper in a talk, walkthrough, or lecture? Add one.
Taxonomy
TopicsTotal Knee Arthroplasty Outcomes · Scoliosis diagnosis and treatment · Shoulder Injury and Treatment
INTRODUCTION
Total knee arthroplasty (TKA) remains associated with a significant dissatisfaction rate [15, 20], with a small proportion of patients reporting high levels of satisfaction [50], particularly among younger and more physically active individuals [35].
Suboptimal outcomes following total knee arthroplasty (TKA) are often linked to persistent pain, stiffness, patellofemoral complications, instability, infection and implant malposition [39, 69]. Additionally, patient‐related factors—including high preoperative pain levels, anxiety, comorbidities and unrealistic expectations—have also been implicated [15, 24, 46]. Among the biomechanical factors, growing attention has been directed toward the change in coronal joint line orientation (JLO) [3, 11, 28, 66, 67, 75, 79]. In the native knee, the JLO is naturally aligned parallel to the floor during gait, a configuration that facilitates stable joint mechanics, efficient load absorption and effective propulsion during the gait cycle [59]. Disruptions in this parallelism may impair functional outcomes, particularly during walking and other weight‐bearing activities.
The mechanical alignment philosophy, still the most widely adopted approach in TKA, often results in an oblique joint line orientation due to its strict perpendicularity to the mechanical axis of the limb. In contrast, emerging alignment strategies aim to more closely replicate native knee anatomy, with particular consideration for preserving joint line orientation [40, 78].
Preserving joint line orientation in total knee arthroplasty shows mixed evidence regarding its impact on short‐ to mid‐term outcomes [14, 19, 47, 65].
This systematic review aims to clarify whether the preservation of joint line orientation is associated with improved clinical outcomes in TKA. By examining the potential correlation between joint line preservation and patient‐reported outcomes, this study seeks to provide valuable insights into optimising alignment strategies to enhance patient satisfaction and overall success.
We hypothesised that joint line preserving techniques would result in superior patient‐reported outcome measures (PROMs) and better functional performance compared to non–joint line preserving approaches.
MATERIALS AND METHODS
This systematic review was conducted according to the PRISMA (Preferred Reporting Items for Systematic Reviews and Meta‐Analyses) guidelines [44] and Cochrane recommendations [23] The protocol of this systematic review was registered on PROSPERO (CRD42023473589).
Eligibility criteria
From title and abstract, all studies addressing joint line considerations in primary TKA were screened for inclusion. Exclusion criteria comprised studies involving cadavers, animals, or computer‐based models, as well as case reports, trial protocols, surgical technique descriptions, narrative reviews, and expert opinion articles. From full‐text review, only studies that compared joint line preserving (JLP) and non–joint line preserving (nJLP) alignment techniques were included, provided they reported PROMs. Classification into JLP or nJLP groups was determined based on the pre‐ and postoperative JLO imaging assessment and/or based on the surgical approach described. Eligible studies involved patients with degenerative knee pathology undergoing primary TKA, with no history of knee instability, infection, trauma, or deformity, and no prior surgeries affecting lower limb alignment. A minimum follow‐up of 12 months was required.
Information sources
The database Pubmed, CENTRAL and Web of Science were searched for all published articles. No time restrictions were applied. Relevant references extracted from the articles screened were included as well. Searches were conducted on 16 February 2025.
Search strategy
The following search string was used: ((knee replacement OR knee arthroplasty OR knee prosthesis) AND (joint line OR joint‐line) AND (prognosis OR prognostic OR prognostics OR outcomes OR outcome OR function OR patient‐reported outcome measures OR PROMs)).
Study selection
Two reviewers (DJP and TT) independently screened the titles and abstracts yielded by the search against the inclusion criteria using the Rayyan QCRI systematic review management software [55]. Full reports for all titles and abstracts that met the inclusion criteria or when there was any uncertainty were collected. Full text reports were screened independently for inclusion and disagreements were settled by discussion or with a third‐party consultation (FGP).
Data collection process and data items
Customised forms, Microsoft Excel, and Rayyan QCRI were used for data management. Two reviewers (DJP and TT) independently collected data, with extraction performed in duplicate. The following data items were collected: authors, year of publication, study type, level of evidence, participant eligibility and recruitment method, TKA alignment technique groups, joint line‐preserving assessment/method, knee prosthetic implant, robotic/navigation system utilisation, follow‐up period, preoperative population matching, outcome scales, outcome results and tested statistical correlations.
Outcomes and prioritisation
The primary outcome measures were validated patient‐reported outcome measures (PROMs), including the Forgotten Joint Score (FJS), Oxford Knee Score (OKS), Knee Society Score (KSS), Western Ontario and McMaster Universities Osteoarthritis Index (WOMAC) and Knee Injury and Osteoarthritis Outcome Score (KOOS). Secondary outcomes included clinical indicators such as range of motion (ROM), pain assessed using the Visual Analogue Scale (VAS), health‐related quality of life (e.g., SF‐36 or EQ‐5D), kinematic and kinetic parameters from gait analysis.
Study quality assessment
Quality assessment for interventional studies were done independently by two reviewers (DJP and TT) with the Cochrane Risk‐of‐bias Tool for Randomised Trials, RoB 2 [23], and with the Risk Of Bias In Non‐randomised Studies ‐ of Interventions, ROBINS‐I [23].
Besides the criteria mentioned by the tool itself, some specific issues were also considered. The “deviations from the intended intervention” domain in RoB 2 and the “classification of the intervention” domain in the ROBINS‐I tool were used to evaluate the accuracy of JLO preservation. The study quality was rated highest when detailed pre‐ and postoperative JLO assessments were included, with CT‐based JLO assessments receiving the highest scores, followed by medial proximal tibial angle (MPTA) measurements on full‐length lower‐limb radiographs. Additionally, or if these assessments were not fully available, JLO preservation quality was evaluated based on surgical alignment technique. Joint line‐preserving accuracy received higher scores when navigation or robotic assistance was utilised, CT/MRI‐based planning was incorporated, or an unrestricted, calipered‐measured kinematic alignment was performed. Disagreements were settled by discussion or with a third‐party consultation (FGP).
Statistical analysis
Meta‐analyses of means and standard deviations (SDs) for PROMs and ROM were conducted using IBM SPSS Statistics (Version 29.0.0.0). All studies providing suitable data for quantitative analysis were included. In cases where multiple publications reported on the same patient cohort, the study with the longest follow‐up was selected to avoid data duplication—except when loss to follow‐up exceeded 85%, in which case the earlier study was included. Weighted mean differences (MDs) with 95% confidence intervals (CIs) were calculated for continuous variables. When only median and interquartile range (IQR) were reported, means and SDs were estimated using the Quantile Estimation (QE) method proposed by McGrath et al. [43]. For studies reporting median and range, the Method for Unknown Non‐Normal Distributions (MLN) developed by McGrath et al. [43] was used. In cases where only the mean and p‐value were available, SDs were calculated following Cochrane guidelines [23]. Whenever only the mean and range were reported, the SD was estimated using the method proposed by Wan et al. [76]. Detailed formulas are provided in the Supplementary File.
The overall KOOS score was calculated as the average of the KOOS subscales: Symptoms, Pain, Activities of Daily Living (ADL), Sport and Recreation (Sport/Rec), and Quality of Life (QoL). The overall standard deviation (SD) for the KOOS score was calculated by summing the squared SDs of the five subscales, dividing the total by five, and then taking the square root of the result. For the KOOS score, meta‐analysis was restricted to studies reporting the complete KOOS score. For KOOS‐JR, studies reporting KOOS domains closely aligned with KOOS‐JR—specifically Symptoms, Pain and ADL subscales—were included, while the Sport/Rec and QoL domains were excluded. Heterogeneity was assessed using the Q‐statistic, and no significant differences were found between subgroups (Q = 0.25, df = 1, p = 0.61; see Supporting Information: File S1). Accordingly, the subgroups were combined in a pooled meta‐analysis.
Knee objective indicators from KSS 1989 version [29] and KSS 2011 version [68] were pooled due to their similarity. Heterogeneity was assessed using the Q‐statistic, and between‐subgroup heterogeneity was not statistically significant (Q = 2.53, df = 1, p = 0.11; see Supporting Information: File S1), supporting their combination in a pooled meta‐analysis. In contrast, Function scores from the KSS 1989 and KSS 2011 versions were analysed separately, as the between‐subgroup heterogeneity was statistically significant (Q = 5.21, df = 1, p = 0.02; see Supporting Information: File S1), indicating meaningful differences between the two versions.
WOMAC global score was calculated as the average of its three domains: Pain, Stiffness, and Physical Function. The overall SD for the WOMAC score was determined by summing the squared SDs of the three subscales, dividing by three, and taking the square root of the result. For the WOMAC meta‐analysis, WOMAC scores reporting on a 0–100 “best” scale were converted to the original 0–100 “worst” scale to ensure consistency across studies.
For ROM, total ROM was calculated by adding the mean extension and flexion values. The total SD for ROM was derived by combining the variances of extension and flexion (squared SDs) and taking the square root of the sum.
For studies reporting both preoperative and postoperative PROMs, improvement scores were calculated, if already not provided. When specific information on the correlation between preoperative and postoperative scores was unavailable, a correlation value of 0.5 (r = 0.5) was assumed (Supporting Information: File S1 for details) [23].
Subgroup analyses were conducted based on study quality, focusing on studies assessed as having a low risk of bias. However, when fewer than five studies met this criterion—potentially compromising the reliability and interpretability of the meta‐analysis results [6] —studies with low to moderate risk of bias were included in the subgroup analyses. Due to the similarity in joint line preservation accuracy and overall study design within these subgroups, a fixed‐effect model was applied to enhance the precision of effect estimates. For the overall meta‐analysis, a random‐effects model was used to account for potential between‐study heterogeneity. Heterogeneity was assessed using the I² statistic, with values of 0%, 25%, 50% and 75% interpreted as no, low, moderate and high heterogeneity, respectively.
RESULTS
A total of 2168 records were identified. After removal of duplicate entries, 1560 studies underwent title and abstract screening. Based on predefined inclusion criteria, 194 studies were selected for full‐text review. Following further exclusions, 43 studies were included in the final qualitative synthesis. Study search and selection flowchart, with exclusion reasons, can be seen in Figure 1.
Study selection flow chart.
General study characteristics
A total of 6357 TKA were analysed across all studies, of which 2715 were JLP procedures, while 3642 cases were nJLP procedures. Various alignment techniques were employed in JLP group, including kinematic alignment (KA), restricted kinematic alignment (rKA), functional alignment (FA) and adjusted mechanical alignment among other variants, while mechanical alignment (MA) was predominantly used in nJLP approaches.
Of the studies included in the qualitative analysis, 16 were randomised controlled trials (RCTs) evidence Level I [16, 22, 34, 37, 40, 41, 42, 48, 77, 80, 81, 82, 83] or II [9, 19, 31], seven were prospective cohort studies evidence Level II [11, 18, 51, 52, 53, 60, 79], 15 were retrospective cohort studies evidence Level III [4, 8, 10, 14, 32, 36, 47, 49, 56, 57, 61, 63, 65, 70, 72], and five were case–control studies evidence Level III [5, 30, 58, 71, 78]. Follow‐up ranged from 12 months to 10 years, with a mean follow‐up of approximately 36.4 months. Data related to individual study characteristics is further detailed in Table 1.
Risk of bias
The overall risk of bias varied across study designs. Among the RCTs, based on the Cochrane RoB 2.0 tool, one study was classified as having a high risk of bias [80], ten had some concerns [9, 16, 31, 34, 40, 41, 42, 48, 77, 83] and five were rated as low risk of bias [19, 22, 37, 81, 82]. For non‐randomised studies, assessed using the Cochrane ROBINS‐I tool, eight studies were classified as having a serious risk of bias [8, 10, 14, 47, 49, 65, 72, 79], 12 had a moderate risk [5, 18, 30, 51, 56, 57, 58, 60, 61, 63, 70, 71] and seven were rated as low risk of bias [4, 11, 32, 36, 52, 53, 78]. The risk of bias in individual studies is shown in Tables 2.1 and 2.2.
Findings
The included studies utilised a diverse range of outcome measures. The most consistently reported outcomes were KSS, reported in 27 studies [9, 14, 16, 19, 22, 30, 31, 32, 36, 40, 41, 47, 48, 49, 51, 52, 53, 57, 58, 65, 71, 72, 77, 79, 80, 81, 82], followed by FJS in 22 studies [4, 8, 11, 18, 19, 22, 30, 36, 37, 42, 56, 57, 60, 61, 63, 70, 71, 72, 78, 81, 82, 83], WOMAC in 14 studies [9, 16, 19, 22, 32, 36, 57, 60, 71, 72, 80, 81, 82, 83], OKS in 12 studies [11, 16, 19, 22, 34, 60, 61, 63, 70, 78, 81, 82], KOOS in 11 studies [5, 14, 30, 42, 48, 49, 56, 63, 65, 77, 79], KOOS‐JR in five studies [10, 11, 18, 42, 72] and VAS in eight [11, 18, 34, 36, 63, 78, 81, 82]. Additionally, objective assessments included ROM, reported in 23 studies [4, 8, 11, 16, 18, 32, 40, 41, 42, 48, 51, 52, 53, 57, 58, 65, 72, 77, 78, 79, 80, 81, 83], and various kinematic and kinetic parameters in seven studies [5, 31, 51, 57, 77, 78, 80], capturing functional and biomechanical outcomes.
Further details on outcome findings can be found in Table 1.
Quantitative analysis
Among all papers, 38 were suitable for a quantitative meta‐analysis.
The FJS, from 18 studies [4, 8, 11, 18, 19, 30, 36, 37, 42, 57, 61, 63, 70, 71, 72, 78, 82, 83], significantly favoured the JLP group with high heterogeneity (MD: 7.59, 95% CI: 3.95–11.23, p = 0.00, I² = 88%, see Figure 2a). Subgroup analysis reinforced this effect in low risk of bias studies, with no heterogeneity (MD: 12.08, 95% CI: 8.85–15.31, p = 0.00, I² = 0%, I² = 0%, see Figure 2b). FJS improvement, analysed in four studies [8, 11, 37, 81], also favoured JLP, with no heterogeneity (MD: 4.72, 95% CI: 0.83–8.61, p = 0.02, I² = 0%), a finding further supported in subgroup analysis (MD: 5.69, 95% CI: 1.16–10.22, p = 0.01, I² = 0%).
(a) Meta‐analysis forest plot for the Forgotten Joint Score (FJS). (b) Low risk of bias subgroup meta‐analysis for the FJS.
The Knee Objective Score‐KSS, from 17 studies [14, 16, 19, 30, 32, 36, 41, 48, 49, 51, 57, 58, 65, 71, 72, 79, 82], showed no significant difference between groups, with high heterogeneity (MD: 1.09, 95% CI: –0.29 to 2.48, p = 0.12, I² = 80%). Subgroup analysis in low‐to‐moderate risk of bias studies also found no significant effect, with moderate heterogeneity (MD: 0.45, 95% CI: –0.29 to 1.20, p = 0.23, I² = 66%). Knee Objective Score‐KSS improvement, assessed in 13 studies [16, 19, 30, 32, 36, 41, 48, 51, 57, 58, 72, 79, 81], remained non‐significant (MD: 0.85, 95% CI: –1.15 to 2.84, p = 0.40, I² = 67%), as did the low‐to‐moderate risk of bias subgroup analysis (MD: –0.36, 95% CI: –1.60 to 0.88, p = 0.57, I² = 61%), both showing moderate heterogeneity.
The Function score – KSS 1989 version [29] from 12 studies [14, 16, 32, 49, 57, 58, 65, 71, 77, 79, 80, 82] did not significantly favour JLP, with moderate heterogeneity (MD: 0.72, 95% CI: –1.92 to 3.36, p = 0.59, I² = 72%). Subgroup analysis in low‐to‐moderate risk of bias studies did not reach statistical significance, with moderate heterogeneity (MD: 1.00, 95% CI: −0.56 to 2.55, p = 0.21, I² = 58%). In contrast, the Function score – KSS 2011 version [68] from nine studies [19, 30, 31, 36, 41, 47, 52, 53, 72] significantly favoured the JLP group, with high heterogeneity (MD: 6.48, 95% CI: 2.30–10.66, p = 0.00, I² = 78%, see Figure 3a). Subgroup analysis in low‐to‐moderate risk of bias studies confirmed a significant effect, with high heterogeneity (MD: 7.28, 95% CI: 4.99–9.58, p = 0.00, I² = 76%, see Figure 3b). Improvement in Knee Function – KSS 1989 version, from seven studies [16, 32, 57, 58, 79, 80, 81], did not reach statistical significance (MD: 3.15, 95% CI: −1.54 to 7.84, p = 0.19, I² = 81%), with low‐to‐moderate risk subgroup analysis yielding as well non‐significant results (MD: 0.31, 95% CI: −1.71 to 2.33, p = 0.77, I² = 81%), both showing high heterogeneity. Improvement in Knee Function – KSS 2011 version, from eight studies [19, 30, 31, 36, 41, 52, 53, 72], significantly favoured JLP (MD: 7.12, 95% CI: 2.82–11.43, p = 0.00, I² = 73%, see Figure 3c), with low‐to‐moderate risk subgroup analysis reinforcing the effect (MD: 8.73, 95% CI: 6.08–11.38, p = 0.00, I² = 69%, see Figure 3d), both showing moderate heterogeneity.
(a) Meta‐analysis forest plot for the Knee Function‐Knee Society Score (KSS) 2011. (b) Low‐to‐moderate risk of bias subgroup meta‐analysis for the Knee Function‐KSS 2011. (c) Meta‐analysis forest plot for the Knee Function‐KSS 2011 improvement. (d) Low‐to‐moderate risk of bias subgroup meta‐analysis for the Knee Function‐KSS 2011 improvement.
The WOMAC, from 11 studies [9, 16, 19, 32, 36, 57, 71, 72, 80, 82, 83], did not show a statistically significant difference between groups, with high heterogeneity (MD: −2.64, 95% CI: −5.61 to 0.34, p = 0.08, I² = 96%). Subgroup analysis of low‐to‐moderate risk of bias studies demonstrated a statistically significant difference favouring JLP, also with high heterogeneity (MD: −1.32, 95% CI: −1.93 to −0.71, p = 0.00, I² = 91%, see Figure 4). Improvement in WOMAC, analysed across 11 studies [9, 16, 19, 32, 36, 57, 71, 72, 80, 81, 83], was not statistically significant (MD: 1.23, 95% CI: −1.81 to 4.28, p = 0.43, I² = 86%), as was the subgroup analysis of low‐to‐moderate risk studies (MD: 0.76, 95% CI: −0.46 to 1.97, p = 0.22, I² = 87%), both revealing high heterogeneity.
Low‐to‐moderate risk of bias subgroup meta‐analysis for the Western Ontario and McMaster Universities Osteoarthritis Index (WOMAC).
The Oxford Knee Score (OKS), from 10 studies [11, 16, 19, 34, 42, 61, 63, 70, 78, 82]—all classified as low‐to‐moderate risk of bias—significantly favoured JLP, with low heterogeneity (MD: 1.02, 95% CI: 0.51–1.54, p = 0.00, I² = 45%, see Figure 5). Improvement in OKS, analysed in eight studies [11, 16, 19, 34, 42, 61, 78, 81]—all also classified as low‐to‐moderate risk—showed a borderline non‐significant pooled mean difference, with low heterogeneity (MD: 0.99, 95% CI: −0.06 to 2.04, p = 0.07, I² = 34%).
Meta‐analysis forest plot for the Oxford Knee Score (OKS).
The KOOS JR, from nine studies [11, 14, 18, 30, 37, 42, 49, 72, 79], significantly favoured JLP, with moderate heterogeneity (MD: 3.64, 95% CI: 1.58–5.70, p = 0.00, I² = 60%, see Figure 6a). Subgroup analysis confirmed significance in low‐to‐moderate risk of bias studies, with high heterogeneity (MD: 5.87, 95% CI: 4.75–6.99, p = 0.00, I² = 78%, see Figure 6b). KOOS JR improvement, analysed in five studies [11, 30, 37, 42, 79], showed no statistically significant difference, with no heterogeneity (MD: 1.45, 95% CI: −0.89 to 3.78, p = 0.23, I² = 0%), consistent with low‐to‐moderate risk subgroup analysis (MD: 1.27, 95% CI: −1.36 to 3.90, p = 0.34, I² = 0%).
(a) Meta‐analysis forest plot for the Knee Injury and Osteoarthritis Outcome Score‐Joint Replacement (KOOS‐JR). (b) Low‐to‐moderate risk of bias subgroup meta‐analysis for the KOOS‐JR.
The KOOS, from eight studies [5, 14, 30, 37, 42, 49, 63, 77], significantly favoured JLP, with low heterogeneity (MD: 2.74, 95% CI: 0.29–5.18, p = 0.03, I² = 16%, see Figure 7). Subgroup analysis showed a borderline non‐significant effect in low‐to‐moderate risk of bias studies, with low heterogeneity (MD: 1.72, 95% CI: −0.23 to 3.67, p = 0.08, I² = 20%). Improvement in KOOS, analysed in four studies [5, 30, 37, 42]—all classified as low‐to‐moderate risk of bias—was borderline non‐significant, with no heterogeneity (MD: 3.87, 95% CI: −0.37 to 8.12, p = 0.07, I² = 0%).
Meta‐analysis forest plot for the Knee Injury and Osteoarthritis Outcome Score (KOOS).
The ROM, from 21 studies [4, 8, 11, 16, 18, 32, 41, 42, 48, 52, 53, 57, 58, 65, 72, 77, 78, 79, 80, 81, 83], significantly favoured JLP, with low heterogeneity (MD: 2.18, 95% CI: 1.50–2.85, p = 0.00, I² = 7%, see Figure 8a). Subgroup analysis of studies with low risk of bias reinforced statistical significance in favour of JLP, with low heterogeneity (MD: 2.82, 95% CI: 1.70–3.93, p = 0.00, I² = 42%, see Figure 8b). Improvement in ROM, analysed in 17 studies [4, 8, 11, 16, 32, 41, 42, 48, 52, 53, 57, 58, 72, 79, 80, 81, 83], kept supporting JLP (MD: 2.12, 95% CI: 0.64–3.61, p = 0.01, I² = 44%), as well as the subgroup analysis of low risk studies (MD: 2.48, 95% CI: 0.73–4.24, p = 0.01, I² = 0%), with low and no heterogeneity, respectively.
(a) Meta‐analysis forest plot for the range of motion (ROM). (b) Low risk of bias subgroup meta‐analysis for the ROM.
Detailed forest plots for all outcomes are available in Supporting Information: File S1.
DISCUSSION
Fair evidence supports preservation of joint line orientation in enhancing patient‐reported outcome measures in TKA. This systematic review and meta‐analysis provides a focused and up‐to‐date synthesis of the available evidence on this important factor. A relevant strength of this review is the inclusion of numerous recent studies, primarily from 2020 to 2025 [4, 8, 10, 11, 14, 18, 30, 31, 32, 37, 41, 42, 53, 58, 60, 65, 70, 71, 78, 79, 82], underscoring the growing interest and clinical relevance of joint line orientation in the pursuit of optimal TKA outcomes.
Across the quantitative analysis, JLP was consistently associated with statistically significant improvements in PROMs and functional measures. Notably, FJS, KOOS, KOOS JR, Knee Function – KSS 2011, OKS, and ROM all demonstrated significant benefits in favour of the JLP approach. A crucial trend observed was that subgroup analysis of studies with low and low‐to‐moderate risk of bias further amplified the significance of JLP benefits in several key measures, with greater improvements seen in FJS, Knee Function‐KSS, WOMAC, KOOS JR and ROM. These findings further emphasise the clinical relevance of joint line preservation, as lower‐risk studies employing more precise JLP techniques and robust methodological designs provide stronger, less biased evidence supporting JLP, thereby validating its clinical benefits.
The contrasting findings between the Function Scores of the KSS 1989 [29] and KSS 2011 [68] versions in our meta‐analysis provide valuable insight into the potential impact of preserving joint line orientation. While the KSS 1989 Function Score did not show a statistically significant advantage for JLP, the KSS 2011 version consistently demonstrated a significant benefit. This discrepancy may be explained by the fundamental differences between the two scoring systems. The 1989 version focuses on basic mobility metrics—such as walking distance, stair climbing, and use of walking aids—whereas the 2011 version encompasses a broader range of patient‐reported, real‐world activities, including kneeling, squatting, rising from a chair, and participation in recreational or athletic pursuits. As such, the KSS 2011 may be more sensitive to capturing the types of functional improvements associated with JLP. These benefits appear particularly evident in higher‐level activities that rely more heavily on joint mechanics and proprioception. This interpretation is further supported by several gait analysis studies included in our qualitative synthesis [5, 31, 51, 57, 77, 78, 80], which reported enhanced knee stability, improved quadriceps engagement, and more physiological movement and force patterns in patients undergoing JLP.
While the pooled differences identified in this meta‐analysis did not exceed commonly cited minimum clinically important difference (MCID) thresholds—such as 13.7 for FJS [13], 5 for OKS [12], and 9.2 for KOOS [2] —this must be interpreted with caution. MCIDs are typically derived from within‐patient changes (pre‐ vs. post‐operative changes) aiming to define the smallest change in a score that a patient would identify as meaningful. However, in a meta‐analysis, the effect size reflects a between‐group difference, which is conceptually distinct from the within‐subject changes used to calculate MCIDs [7, 45, 62]. Applying within‐patient thresholds to between‐group data may therefore be methodologically inappropriate and potentially misleading. Additionally, MCID values vary depending on the calculation method (e.g., anchor‐based, distribution‐based and ROC analysis), and many thresholds aim to distinguish satisfied from unsatisfied patients rather than detect more nuanced differences among high‐functioning individuals [21, 25, 38, 64]. Several PROMs also exhibit ceiling effects, reducing their sensitivity to subtle functional improvements in patients with already good outcomes [17, 54]. This may partly explain why certain studies—such as those by Parratte et al. [64], Nakagawa et al. [38], and McEwen et al. [36]—reported no significant differences in PROM scores, yet observed greater patient satisfaction or preference in the JLP group. These findings suggest that while pooled PROM differences may appear statistically modest, joint line preservation could still offer meaningful clinical benefits, especially in high‐functioning patients.
Although JLO preservation may not have a substantial effect reducing reported dissatisfaction rates following TKA, it may play an important role in optimising already favourable outcomes. This effect is particularly relevant within the framework of the “forgotten joint” concept, which represents the highest standard of success in joint replacement. In this context, among the available PROMs, the FJS stands out as the most suitable for capturing such subtle yet meaningful improvements, particularly in patients with higher satisfaction levels [1, 33, 73, 74]. Notably, in this meta‐analysis, the FJS demonstrated the largest pooled mean difference in favour of joint line preservation, further supporting its sensitivity to functional improvements in this context.
It is also reasonable to hypothesise that patients whose native joint line orientation deviates more significantly from neutral [27] —such as alignment “outliers” with marked varus or valgus deformities—may experience greater functional consequences when JLO is not maintained, compared to patients with near‐neutral alignment. However, the absence of standardised phenotypic classification across studies limited our ability to explore this interaction.
This meta‐analysis is limited by the high heterogeneity observed in several pooled outcomes, particularly for PROMs like FJS, KSS and WOMAC (I² > 75%), likely due to methodological differences, patient variability, and inconsistent reporting. Although subgroup analyses by study quality reduced heterogeneity in some cases, variability persisted. More stable findings were observed for FJS (subgroup), OKS, KOOS, and ROM.
Another limitation is the focus on a single phenotypic feature (JLO), without accounting for broader phenotypic variations (e.g., functional phenotypes, HKA alignment or laxity). Additional confounding factors—such as osteoarthritis severity, surgical indication, baseline function and psychological status—were also inconsistently reported, potentially influencing outcomes.
Future studies should aim to establish more standardised phenotypic groupings [26] to better identify which patients benefit most from joint line preservation. Stratified analyses based on broader phenotype classifications and more comprehensive reporting of patient‐specific variables will be essential for advancing individualised approaches in TKA.
CONCLUSION
This systematic review and meta‐analysis found that joint line preservation in TKA is associated with statistically significant improvements in PROMs and functional outcomes, particularly in studies with low or low‐to‐moderate risk of bias. These results support the relevance of joint line orientation in optimising outcomes, though its isolated effect may be limited without considering broader phenotypic alignment strategies.
AUTHOR CONTRIBUTIONS
Dúnio Jácome‐Pacheco: Writing of protocol; article screening and selection; data extraction and analysis; writing of manuscript. Tiago Torres: Reviewer of protocol; article screening and selection; data extraction. Gonçalo Rodrigues: Reviewer of protocol; reviewer and writing of the final manuscript. Pedro Diniz: Reviewer of protocol; supervision of methodology; reviewer and writing of the final manuscript. Francisco Guerra Pinto: Writing of protocol; referee in case of disagreement in article screening and selection; reviewer and writing of the final manuscript. António Camacho: Supervision of methodology and reviewing process; reviewer and writing of the final manuscript. João Gamelas: Supervision of methodology; reviewer and writing of the final manuscript. Romain Seil: Supervision of methodology; reviewer and writing of the final manuscript. Michael Hirschmann: Supervision of methodology; reviewer and writing of the final manuscript.
CONFLICT OF INTEREST STATEMENT
The authors declare no conflicts of interest.
ETHICS STATEMENT
PROSPERO registration number CRD42023473589.
Supporting information
Supporting information.
The reference list from the paper itself. Each links out to its DOI / PubMed record.
- 1Adriani M , Malahias MA , Gu A , Kahlenberg CA , Ast MP , Sculco PK . Determining the validity, reliability, and utility of the forgotten joint score: a systematic review. J Arthroplasty. 2020;35:1137–1144.31806559 10.1016/j.arth.2019.10.058 · doi ↗ · pubmed ↗
- 2Ayers DC , Yousef M , Yang W , Zheng H . Age‐related differences in pain, function, and quality of life following primary total knee arthroplasty: results from a FORCE‐TJR (Function and Outcomes Research for Comparative Effectiveness in Total Joint Replacement) Cohort. J Arthroplasty. 2023;38:S 169–S 176.10.1016/j.arth.2023.04.00537121490 · doi ↗ · pubmed ↗
- 3Bae K , Lee BS , Kim JM , Bin SI , Lee J , Kim D , et al. Effect of joint‐line obliquity on long‐term survivorship of total knee arthroplasty: a postoperative phenotype analysis. Knee Surg Sports Traumatol Arthrosc. 2024;32:3230–3238.38895851 10.1002/ksa.12311 · doi ↗ · pubmed ↗
- 4Bar Ziv Y , Small I , Keidan T , Beit Ner E , Agar G , Shohat N . Patients undergoing staged bilateral knee arthroplasty are less aware of their kinematic aligned knee compared to their mechanical knee. J Orthop. 2021;23:155–159.33542593 10.1016/j.jor.2020.12.032PMC 7840796 · doi ↗ · pubmed ↗
- 5Blakeney W , Clément J , Desmeules F , Hagemeister N , Rivière C , Vendittoli PA . Kinematic alignment in total knee arthroplasty better reproduces normal gait than mechanical alignment. Knee Surg Sports Traumatol Arthrosc. 2019;27:1410–1417.30276435 10.1007/s 00167-018-5174-1 · doi ↗ · pubmed ↗
- 6Borenstein M , Hedges LV , Higgins JPT , Rothstein HR . Introduction to Meta‐Analysis. Chichester, UK: Wiley; 2009.
- 7Boyer CW , Lee IE , Tenan MS . All MCI Ds are wrong, but some may be useful. J Orthop Sports Phys Ther. 2022;52:401–407.35647882 10.2519/jospt.2022.11193 · doi ↗ · pubmed ↗
- 8Calek AK , Ladurner A , Jud L , Zdravkovic V , Behrend H . Tibial joint line orientation has no effect on joint awareness after mechanically aligned total knee arthroplasty. Knee Surg Sports Traumatol Arthrosc. 2022;30:389–396.34417835 10.1007/s 00167-021-06696-4 · doi ↗ · pubmed ↗