Diagnostic reference levels in interventional radiology: a systematic review
Iana Quintanilha de Borba, Rochelle Lykawka, Nayron Medeiros Soares, Joaquim Maurício da Motta Leal Filho, Alexandre Bacelar, Matheus de Lima Ruffini, Adolfo Moraes de Souza, Fabiano Reis, Juliana Ávila Duarte

TL;DR
This paper reviews scientific evidence for setting diagnostic reference levels in interventional radiology, highlighting the need for international collaboration and standardization.
Contribution
The study systematically reviews evidence for DRLs in interventional radiology and identifies gaps in international standardization.
Findings
Most DRL values were reported at the local level, not nationally or regionally.
Endovascular aneurysm repair and nephrostomy were the most frequently reported procedures.
Dose management software was found to be effective for data collection and DRL establishment.
Abstract
To comprehensively and impartially analyze the scientific evidence available for establishing diagnostic reference levels (DRLs) in interventional radiology. This was a systematic review conducted in accordance with the Preferred Reporting Items for Systematic Reviews and Meta-Analyses guidelines. The search focused on studies related to interventional radiology and DRLs in PubMed/Medline and Embase. Studies involving computed tomography-guided procedures, studies with incomplete data, and systematic reviews were excluded. Two independent reviewers evaluated the studies, resolving discrepancies with a third reviewer. Articles were tabulated with information such as title, publication year, procedures, DRL values, and type of equipment used. A total of 475 articles were identified. After duplicates had been excluded and eligibility criteria had been applied, the final sample comprised…
Genes, proteins, chemicals, diseases, species, mutations and cell lines named across the full text — each resolved to its canonical identifier and authoritative record.
Click any figure to enlarge with its caption.
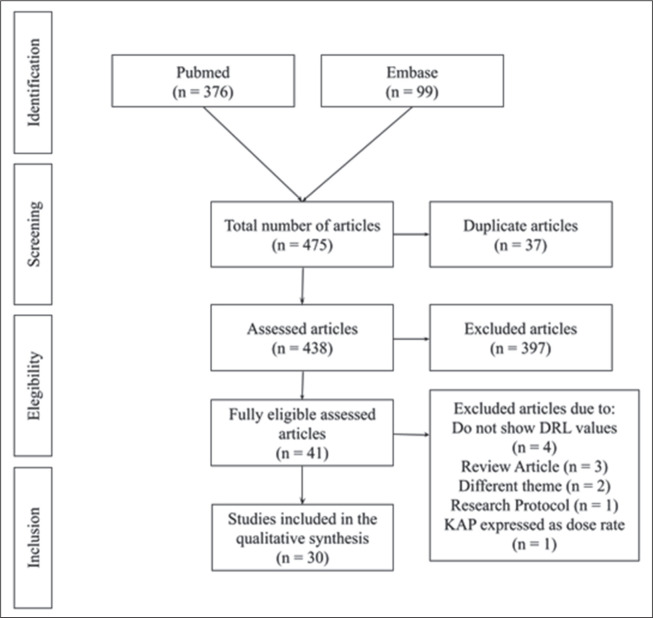 Figure 1
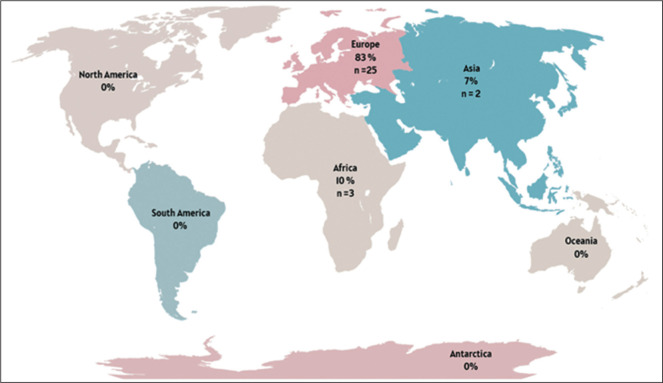 Figure 2
| Country | Study | Procedure | Sample (n) | DRL value | ||
|---|---|---|---|---|---|---|
| KAP (Gycm2) | CAK (Gy) | FT (min) | ||||
| Malta | Pace et
al.( | Central lines | 269 | 1 | – | – |
| Embolization | 297 | 58 | – | – | ||
| Hepatic embolization | 215 | 96 | – | – | ||
| Mechanical thrombectomy | 122 | 120 | – | – | ||
| Nephrostomy single | 148 | 2 | – | – | ||
| PICC lines | 135 | 0.3 | – | – | ||
| PTA | 762 | 5 | – | – | ||
| PTC | 238 | 8 | – | – | ||
| Spain | Rial et
al.( | EVAR - mobile X-ray systems | 165 | 87 | 0.292 | – |
| EVAR - hybrid rooms | 123 | 278 | 1.403 | – | ||
| France | Farah et
al.( | Abdominal aortic aneurysm endoprosthesis | – | 81 | – | 18 |
| Iliac angioplasty | – | 24 | – | 6 | ||
| Flutter ablation | – | 14 | – | 17 | ||
| Lebanon | Rizk et
al.( | Cerebral embolization | 117 | 190 | 2.42 | 27 |
| Cerebral arteriography | 210 | 83 | 0.69 | 6 | ||
| Lower extremity arteriography | 343 | 31 | 0.17 | 3 | ||
| Lower extremity arteriography with coronary angiography | 86 | 43 | 0.41 | 5 | ||
| Lower extremity angioplasty | 177 | 48 | 0.27 | 12 | ||
| Inferior vena cava filter | 26 | 57 | 0.31 | 7 | ||
| Germany | Schmitz et
al.( | Initial percutaneous biliary interventions | 240 | 43 | – | – |
| Follow-up percutaneous biliary interventions | 320 | 14 | – | – | ||
| Region | Study | Procedure | Sample (n) | DRL value | ||
|---|---|---|---|---|---|---|
| KAP (Gycm2) | CAK (Gy) | FT (min) | ||||
| Europe | Schegerer et
al.( | Iliac artery stenting | – | 58 | 0.251 | 10 |
| Hepatic embolization (transarterial chemoembolization) | – | 241 | 1.868 | 18 | ||
| Femoropopliteal artery stenting | – | 26 | 0.99 | 13 | ||
| Treatment of biliary obstruction | – | 23 | 1.95 | 10 | ||
| Europe | Tuthill et al.( | Abdominal EVAR | 180 | 158.49 | – | 18.13 |
| Country | Study | Procedure | Sample (n) | DRL value | ||
|---|---|---|---|---|---|---|
| KAP (Gycm2) | CAK (Gy) | FT (min) | ||||
| Korea | Ihn et al.( | Diagnostic cerebral angiography | 429 | 101.6 | 0.711 | 13.3 |
| Aneurysm coiling | 327 | 199.9 | 3.458 | 57.3 | ||
| Stroke thrombolysis | 326 | 225.1 | 1.590 | 44.7 | ||
| Arteriovenous malformation embolization | 78 | 412.3 | 4.447 | 99.3 | ||
| Italy | Isoardi et al.( | Cerebral angiography | 981 | 159 | 1.401 | 10 |
| Germany | Forbrig et
al.( | Endovascular carotid artery stenting | 102 | 117 | – | – |
| Semi elective/elective carotid artery stenting | 75 | 86.7 | – | 27.1 | ||
| Carotid artery stenting + mechanical thrombectomy | 19 | 286.1 | – | 43.8 | ||
| Greece | Vossou et
al.( | Hepatic chemoembolization | 218 | 141 | 0.634 | 12.4 |
| Iliac stent placement | 130 | 0.330 | 17.9 | |||
| Femoropopliteal revascularization | 28 | 0.112 | – | |||
| Germany | Opitz et
al.( | Endovascular treatment of UIAs | 583 | 183 | – | – |
| Endovascular treatment of ruptured intracranial aneurysms | 246 | – | – | |||
| Germany | Ozpeynirci et al.( | Endovascular coil embolization in carotid-cavernous fistulas | 30 | 376.2 | – | 241.8 |
| Germany | Ozpeynirci et al.( | Spinal angiography in spinal dural arteriovenous fistulas | 62 | 329.41 | – | – |
| Germany | Opitz et
al.( | Diagnostic angiography in carotid-cavernous fistula | 26 | 215 | – | – |
| Embolization in carotid-cavernous fistula | 60 | 350 | – | – | ||
| Germany | Opitz et
al.( | Endovascular therapy in cranial dural arteriovenous fistula | 94 | 507.33 | – | – |
| Diagnostic angiography in cranial dural arteriovenous fistula | 256.65 | – | – | |||
| Endovascular therapy in spinal dural arteriovenous fistula | 37 | 482.72 | – | – | ||
| Diagnostic angiography in spinal dural arteriovenous fistula | 396.39 | – | – | |||
| Greece | Papanastasiou et
al.( | Cerebral angiography | 142 | 70 | 0.494 | 9.2 |
| PTC | 34 | 0.194 | 14.2 | |||
| Transarterial chemoembolization | 189 | 1.186 | 27.5 | |||
| Percutaneous transhepatic biliary drainage | 54 | 0.400 | 22.9 | |||
| Germany | Forbrig et al.( | Endovascular treatment in patients with intracranial lateral dural arteriovenous fistulae | 70 | 414 | – | 142 |
| South Africa | Peter et al.( | Intracranial aneurysm coil embolization | 30 | 52.1 | – | 17.8 |
| South Africa | Malan et
al.( | Leg – aorto-bifemoral angiogram | 590 | 51 | 0.15 | 6 |
| Leg – lower limb angiogram (trauma) | 70 | 42 | 0.16 | 8 | ||
| Diagnostic cerebral angiogram | 61 | 55 | 0.289 | 14 | ||
| Leg – aorto-bifemoral intervention | 287 | 73 | 0.249 | 18 | ||
| Nephrostomy (unilateral) | 265 | 10 | 0.063 | 4 | ||
| Bronchial artery embolization | 208 | 73 | 0.259 | 38 | ||
| PTC drainage | 173 | 46 | 0.227 | 20 | ||
| Nephrostomy (bilateral) | 147 | 9 | 0.057 | 4 | ||
| Nephrostomy and stent (unilateral) | 122 | 39 | 0.196 | 12 | ||
| Selective abdominal vessels – interventional angiogram | 77 | 170 | 0.877 | 29 | ||
| Selective upper extremity – interventional angiogram (trauma) | 73 | 30 | 0.094 | 13 | ||
| Selective neck vessel – interventional angiogram (trauma) | 65 | 75 | 0.587 | 27 | ||
| Interventional cerebral angiogram | 55 | 63 | 0.505 | 25 | ||
| PTC stent ± dilatation | 54 | 80 | 0.443 | 19 | ||
| Nephrostomy and stent (bilateral) | 45 | 54 | 0.342 | 24 | ||
| Greece | Tzanis et
al.( | EVAR ≥ 5 | 24 | 196.2 | 1.239 | 23.8 |
| EVAR 5–7 | 35 | 244.6 | 1.358 | 31.1 | ||
| EVAR > 7 | 14 | 375.6 | 2.284 | 44.1 | ||
| EVAR | 76 | 230.6 | – | – | ||
| Germany | Forbrig et
al.( | Endovascular treatment of UIAs – coiling | 26 | 130 | – | – |
| UIAs – flow diverter and Woven EndoBridge | 45 | 176 | – | – | ||
| UIAs – combined techniques | 16 | 209 | – | – | ||
| Ireland | Acton et
al.( | Four-vessel angiogram | 189 | 96 | – | – |
| Aneurysm coiling | 109 | 123 | – | – | ||
| Greece | Metaxas et
al.( | Cervical interventions | 45 | 0.10 | 0.0047 | 0.15 |
| Thoracolumbar interventions | 111 | 0.71 | 0.0032 | 0.29 | ||
| South Africa | Slave et
al.( | Percutaneous transhepatic biliary drainage | 146 | 24 | 131.8 | 6.2 |
| Bronchial artery embolization | 57 | 131 | 343 | 33.5 | ||
| Pigtail insertion | 44 | 7.5 | 37 | 2.4 | ||
| Nephrostomy (unilateral) | 42 | 10 | 26 | 3.4 | ||
| Nephrostomy (bilateral) | 37 | 10 | 62 | 6.3 | ||
| Selective abdominal vessels-interventional angiogram | 26 | 776 | 2227.8 | 28.3 | ||
| Diagnostic cerebral angiogram | 26 | 209.3 | 868.5 | 28.4 | ||
| PICC | 25 | 2 | 5 | 4 | ||
| Percutaneous transhepatic biliary drainage internalization | 20 | 57 | 259 | 16.7 | ||
| Uterine artery embolization | 18 | 1463.8 | 4019 | 24.8 | ||
| Unilateral antegrade ureteric stent | 16 | 23 | 118.5 | 15.2 | ||
| PTC | 15 | 9 | 28.5 | 0.7 | ||
| Interventional cerebral angiogram | 15 | 275 | 1744 | 34.1 | ||
| Switzerland | Heilmaier et
al.( | Insertion of abscess drainage – simple | 10 | 2 | – | – |
| Insertion of abscess drainage – standard | 10 | 6 | – | – | ||
| Insertion of abscess drainage – difficult | 6 | 13 | – | – | ||
| Switzerland | Heilmaier et
al.( | Nephrostomy insertion – simple | 12 | 5 | – | – |
| Nephrostomy insertion – standard | 29 | 12 | – | – | ||
| Nephrostomy insertion – difficult | 13 | 30 | – | – | ||
| Nephrostomy change/removal – simple | 58 | 6 | – | – | ||
| Nephrostomy change/removal – standard | 31 | 8 | – | – | ||
| Nephrostomy change/removal – difficult | 8 | 25 | – | – | ||
| Percutaneous radiologic gastrostomy tube insertion – standard | 6 | 9 | – | – | ||
| Percutaneous radiologic gastrostomy control – standard | 7 | 8 | – | – | ||
| PTC drain insertion – simple | 7 | 32 | – | – | ||
| PTC drain insertion – standard | 41 | 40 | – | – | ||
| PTC drain insertion – difficult | 20 | 85 | – | – | ||
| PTC drain change/removal – simple | 21 | 12 | – | – | ||
| PTC drain change/removal – standard | 29 | 20 | – | – | ||
| PTC drain change/removal – difficult | 11 | 60 | – | – | ||
| Selective internal radiotherapy – standard | 18 | 175 | – | – | ||
| Transarterial chemoembolization – standard | 11 | 210 | – | – | ||
| Transarterial chemoembolization – difficult | 7 | 310 | – | – | ||
| Transjugular liver biopsy – simple | 6 | 18 | – | – | ||
| Transjugular liver biopsy – standard | 9 | 35 | – | – | ||
| Transjugular liver biopsy – difficult | 6 | 50 | – | – | ||
| Intervention to superior vena cava – standard venous | 14 | 10 | – | – | ||
| Intervention to inferior vena cava – simple | 11 | 22 | – | – | ||
| Intervention to inferior vena cava – standard | 6 | 35 | – | – | ||
| Fluoroscopy of port-a-cath – simple | 9 | 2 | – | – | ||
| Fluoroscopy of port-a-cath – standard | 7 | 5 | – | – | ||
| Insertion of PICC – simple | 92 | 1 | – | – | ||
| Insertion of PICC – standard | 56 | 2 | – | – | ||
| Insertion of PICC – difficult | 11 | 22 | – | – | ||
| Embolization therapy of varicocele – simple | 10 | 25 | – | – | ||
| Embolization therapy of varicocele – standard | 7 | 40 | – | – | ||
| Embolization therapy of varicocele – difficult | 6 | 55 | – | – | ||
| Phlebography, lower extremity – standard | 6 | 2 | – | – | ||
| Insertion of dialysis graft – simple arterial-venous | 7 | 6 | – | – | ||
| Insertion of dialysis graft – difficult | 5 | 10 | – | – | ||
| Thrombolysis of dialysis graft – standard | 15 | 3 | – | – | ||
| PTA of dialysis graft – standard | 7 | 40 | – | – | ||
| EVAR – standard | 17 | 185 | – | – | ||
| EVAR – difficult | 16 | 350 | – | – | ||
| Visceral artery angiography – standard | 12 | 140 | – | – | ||
| Visceral artery angiography – difficult | 8 | 245 | – | – | ||
| Visceral artery embolization – standard | 15 | 165 | – | – | ||
| Visceral artery embolization – difficult | 20 | 430 | – | – | ||
| Renal PTA – difficult | 6 | 220 | – | – | ||
| Renal artery embolization – standard | 6 | 105 | – | – | ||
| Renal artery embolization – difficult | 6 | 195 | – | – | ||
| Pelvic vessel embolization (venous/arterial) – standard | 11 | 150 | – | – | ||
| Pelvic vessel embolization (venous/arterial) – difficult | 12 | 205 | – | – | ||
| Pelvic PTA – simple | 7 | 50 | – | – | ||
| Pelvic PTA – standard | 26 | 60 | – | – | ||
| Pelvic PTA – difficult | 13 | 95 | – | – | ||
| Pelvic PTA and stent placement – simple | 11 | 20 | – | – | ||
| Pelvic PTA and stent placement – standard | 22 | 85 | – | – | ||
| Switzerland | Heilmaier et
al.( | Pelvic PTA and stent placement – difficult | 28 | 145 | – | – |
| Pelvic and femoral PTA – standard | 18 | 65 | – | – | ||
| Pelvic and femoral PTA – difficult | 16 | 70 | – | – | ||
| Pelvic and femoral PTA and stent placement – standard | 13 | 85 | – | – | ||
| Pelvic and femoral PTA and stent placement – difficult | 10 | 100 | – | – | ||
| Pelvic, femoral and lower leg PTA – standard | 8 | 25 | – | – | ||
| Pelvic, femoral and lower leg PTA – difficult | 9 | 75 | – | – | ||
| Diagnostic angiography lower extremity – simple | 15 | 3 | – | – | ||
| Diagnostic angiography upper extremity – standard | 10 | 5 | – | – | ||
| Insertion of thrombolysis catheter – simple | 7 | 20 | – | – | ||
| Insertion of thrombolysis catheter – standard | 11 | 25 | – | – | ||
| Insertion of thrombolysis catheter – difficult | 8 | 50 | – | – | ||
| Control of thrombolysis catheter – simple | 14 | 4 | – | – | ||
| Control of thrombolysis catheter – standard | 8 | 6 | – | – | ||
| Femoral PTA – simple | 14 | 8 | – | – | ||
| Femoral PTA – standard | 59 | 20 | – | – | ||
| Femoral PTA – difficult | 14 | 55 | – | – | ||
| Femoral PTA and stent placement – simple | 9 | 6 | – | – | ||
| Femoral PTA and stent placement – standard | 35 | 15 | – | – | ||
| Femoral PTA and stent placement – difficult | 27 | 45 | – | – | ||
| Femoral and lower leg PTA – simple | 8 | 5 | – | – | ||
| Femoral and lower leg PTA – standard | 49 | 10 | – | – | ||
| Femoral and lower leg PTA – difficult | 18 | 30 | – | – | ||
| Femoral and lower leg PTA and stent placement – simple | 8 | 4 | – | – | ||
| Femoral and lower leg PTA and stent placement – standard | 17 | 8 | – | – | ||
| Femoral and lower leg PTA and stent placement – difficult | 20 | 20 | – | – | ||
| Lower leg PTA – simple | 10 | 3 | – | – | ||
| Lower leg PTA – standard | 42 | 6 | – | – | ||
| Lower leg PTA – difficult | 22 | 25 | – | – | ||
| Lower leg PTA and stent placement – standard | 15 | 8 | – | – | ||
| Lower leg PTA and stent placement – difficult | 15 | 30 | – | – | ||
| Country | Study | Procedure | Sample (n) | DRL value | ||
|---|---|---|---|---|---|---|
| KAP (Gycm2) | CAK (Gy) | FT (min) | ||||
| Spain | Morcillo et
al.( | Hepatic/biliary interventions (5–15 kg) | 39 | 13.04 | – | 19.38 |
| Hepatic/biliary interventions (15–30 kg) | 15 | 21.21 | – | 22.65 | ||
| Sclerotherapy (15–30 kg) | 18 | 7.04 | – | 5.9 | ||
| Sclerotherapy (30–50 kg) | 21 | 40.49 | – | 7.45 | ||
| Sclerotherapy (50–80 kg) | 16 | 37.34 | – | 23.3 | ||
| Central venous catheters (5–15 kg) | 21 | 0.84 | – | 3.4 | ||
| Italy | Gerasia et
al.( | Retrograde wedge portography – children | 25 | 5.6 | 0.034 | – |
| Retrograde wedge portography – middle childhood | 20 | 6.4 | 0.018 | – | ||
| Retrograde wedge portography – early adolescence | 21 | 12.8 | 0.059 | – | ||
| Germany | Opitz et
al.( | IAC procedures of pediatric patients with RB – A2: 4–12 months | 85 | 3.9 | – | – |
| IAC procedures of pediatric patients with RB – A3: 13–72 months | 157 | 7.0 | – | – | ||
| IAC procedures of pediatric patients with RB – A4: 73 months-10 years | 4 | 14.5 | – | – | ||
| France | Farah et
al.( | PTC 0–5 kg | 7 | 0.06 | 0.001 | – |
| PTC 5–15 kg | 56 | 0.22 | 0.006 | – | ||
| PTC 15–30 kg | 43 | 0.68 | 0.035 | – | ||
| PTC 30–50 kg | 42 | 1.07 | 0.027 | – | ||
| DRL type | Study | Procedure | Sample (n) | DRL value | ||
|---|---|---|---|---|---|---|
| KAP (Gycm2) | CAK (Gy) | FT (min) | ||||
| Local (Facility in Greece) | Tzanis et
al.( | EVAR ≥ 5 | 24 | 196.2 | 1.239 | 23.8 |
| EVAR 5–7 | 35 | 244.6 | 1.358 | 31.1 | ||
| EVAR > 7 | 14 | 375.6 | 2.284 | 44.1 | ||
| EVAR | 76 | 230.6 | – | – | ||
| National (Spain) | Rial et
al.( | EVAR – mobile X-ray systems | 165 | 87.0 | 0.292 | – |
| EVAR – hybrid rooms | 123 | 278.0 | 1.403 | – | ||
| Regional (Europe) | Tuthill et al.( | Abdominal EVAR | 180 | 158.49 | – | 18.13 |
Peer Reviews
No public reviews on file for this paper yet. If you reviewed it on a platform where reviews are public (OpenReview, ICLR, NeurIPS, ICML), you can paste yours below so the community can read it here.
Videos
No videos yet. Explain this paper in a talk, walkthrough, or lecture? Add one.
Taxonomy
TopicsRadiology practices and education · Radiation Dose and Imaging · Advanced X-ray and CT Imaging
INTRODUCTION
Interventional radiology is a constantly evolving field, playing an essential role in the diagnosis and treatment of a wide variety of clinical conditions^(^1^)^. Radiation exposure remains a significant concern, particularly in fluoroscopy-guided interventional (FGI) procedures. Although the clinical benefits usually outweigh the risks associated with X-ray exposure, minimizing exposure whenever possible is crucial^(^2^)^. This is especially important for high-dose procedures, which require continuous monitoring and optimization.
The concept of diagnostic reference levels (DRLs) was introduced by the International Commission on Radiological Protection (ICRP) in Publication 73^(^3^)^. In ICRP Publication 135^(^4^)^, DRLs were established as an optimization strategy, serving as quality indicators for procedural performance^(^3^,^5^)^. Rather than being patient dose limits, DRLs are reference values statistically determined for standard patients to guide periodic institutional dose evaluations aimed at adhering to the “as low as reasonably achievable” principle^(^3^)^. Although DRLs constitute a valuable tool for optimizing patient radiological protection, challenges remain regarding the methodology for establishing and applying these values^(^6^,^7^)^. Those challenges are particularly pronounced for interventional diagnostic or therapeutic procedures, for which procedural complexity varies significantly.
The considerable variation in radiation doses across interventional radiology procedures suggests a need for greater attention to the variables influencing DRL values, with the objective of optimizing patient safety^(^7^)^. The aim of this study was to conduct a comprehensive, impartial systematic review of the scientific evidence for establishing DRLs in interventional radiology through an analysis of observational studies.
METHOD
This systematic review followed the Preferred Reporting Items for Systematic Reviews and Meta-Analyses guidelines^(^8^,^9^)^. Studies published up through August 2023 were considered. A filter was applied to select studies published from 2017 onward, covering a six-year period. Searches were conducted in the PubMed/Medline and Embase databases. Although a search was attempted in the Cochrane Library, no relevant results were found.
The search strategy included descriptors and their variations: Diagnostic reference levels; Radiology, interventional; Fluoroscopy; Tomography, X-Ray computed; Cholangiography; Image-guided biopsy; Catheterization; Balloon angioplasty; Cineradiography; Photofluorography; Cholangiography; Percutaneous transthoracic biopsy; Artery embolization; Neuroradiography; Cerebral ventriculography; Subtraction technique; Angiography; Cineangiography; Phlebography; Portography; Coronary angiography; and Arthrography.
The following inclusion criteria were applied: studies reporting DRL values for air kerma-area product (KAP), cumulative air kerma (CAK), and fluoroscopy time (FT); studies on FGI radiology procedures in adults and children; and studies using DRL metrics according to ICRP Publication 135 (median or 75th percentile). Studies on computed tomography-guided interventional radiology procedures were excluded, as were studies with incomplete data and systematic reviews. The protocol was registered in the International Prospective Register of Systematic Reviews under registration number CRD42023446225.
The articles were exported from the PubMed/Medline and Embase databases to an artificial intelligence-powered tool for systematic literature reviews (Rayyan; Qatar Computing Research Institute, Doha, Qatar). Initially, duplicate articles were automatically removed with Rayyan. Thereafter, two reviewers independently conducted the initial assessment phase, involving the analysis of abstracts and, finally, full-text articles. This process resulted in a collection of studies for evaluation by the assessors. A third assessor resolved discrepancies in selection to reach a consensus. In the consensus meeting, articles not aligned with the objectives of this review were excluded.
After articles had been selected for full-text review, they were exported and tabulated by one of the reviewers. The extracted data included the article title; digital object identifier; year of publication; procedures described; DRL values (KAP, CAK, and FT); and the type of equipment used. The identification of 113 procedures was based on the nomenclature as reported in the included studies, without reclassification or grouping into broader procedural categories. In addition, we determined whether the studies considered factors such as procedure complexity, patient age, patient body habitus, study limitations, practical recommendations, trend analysis, potential research gaps, and variability factors.
RESULTS
Study sample
In the initial screening, 376 articles were found in PubMed and 99 in Embase, totaling 475 articles. Of those, 37 articles were excluded for being in more than one database (duplicates) and 397 did not meet the eligibility criteria, leaving 41 articles eligible for evaluation. The final selection process resulted in the inclusion of 30 articles. All articles assessed DRL in various FGI procedures. The selection process is depicted in Figure 1.
Figure 1. Flow chart of the article selection process, after searches in the PubMed and Embase databases.
In total, 113 different types of FGI procedures were identified, with the most common being endovascular aneurysm repair (EVAR) procedures (n = 4) and nephrostomy (n = 3). Procedures were identified based on the descriptions provided in the studies, which primarily referenced the technical procedure performed rather than the clinical indication, equipment used, or detailed patient characteristics. Few procedures were repeated across studies, making it challenging to compare the DRL values obtained.
Only four studies^(^10^–^13^)^ addressed local DRLs for pediatric procedures, the remainder involving only adult patients. In the studies dedicated to pediatric procedures, the analysis of results was stratified based on the weight/height or age of the patients. In contrast, in the studies involving adult patients, the evaluation was performed for patients established as the standard.
Geographic distribution
According to ICRP Publication 135, a local DRL refers to the typical dose values derived from a sample within a single institution or a small group of facilities, representing standard clinical practice at the local level. Of the 30 studies analyzed, 23 (76.7%) reported dose values referenced as local/institutional DRLs, five (16.7%) reported national DRLs, and two (6.7%) reported regional DRLs. One study^(^14^)^, conducted in Malta, provided local DRLs for eight procedures, which also represented the national DRLs, because the study was conducted at the sole institution performing those procedures in the country. Another study^(^15^)^ presented the local DRL for a procedure that also represented the regional (European) DRL, because it brought together the major centers performing the EVAR procedure in the region.
The geographic distribution of the studies included is shown in Figure 2. The European continent showed the highest number of DRL studies in interventional radiology, with the majority of those studies (n = 13) conducted in Germany. None of the studies selected were conducted in North America, Latin America, the Caribbean, Oceania, or Antarctica.
Figure 2. Number/percentage of studies by region.
Reported dose descriptors
Although all of the studies provided a DRL for KAP, only 13 (43.3%) included the DRL for CAK value, whereas 16 (53.3%) included the DRL for FT. Only nine studies (30.0%) presented DRL values for all three dose descriptors (KAP, CAK, and FT). Some studies reported the mean FT, which was not taken into account in the present study.
DRL value
National DRLs were identified for Malta, Spain, France, Lebanon, and Germany. Table 1 presents those DRL values. National DRL information was collected through survey forms sent to eligible institutions. However, researchers encountered challenges in conducting these studies, including a low response rate to the questionnaires^(^16^)^, a lack of dose correction factors in KAP data^(^17^)^, and potential typing errors in manual data collection^(^14^)^, as well as a lack of CAK and exposure time data. In addition, all studies reported difficulty in assessing the complexity of procedures was reported in all of the studies. Pace et al.^(^14^)^ recommended the use of dose management software to facilitate data collection.
Local DRLs from small countries like Malta^(^14^)^ were treated as national DRLs. The selected studies encompassed various public and private institutions in different countries, including 14 hospitals in Spain, 150 in France, 15 in Lebanon, and 23 in Germany. It is important to note that none of the studies used previously published or compiled data, opting for retrospective and prospective data collection after including institutions. In the context of national DRL studies, the highest recorded value was for the EVAR procedure in hybrid rooms, with DRLs for the KAP and CAK of 278 Gycm^2^ and 1,403 Gy, respectively.
The two studies reporting regional DRLs were from Europe and described distinct procedures. Regional DRLs were defined in centers from various countries. One of the studies highlighting the EVAR procedure^(^15^)^ included large and medium-sized hospitals in Ireland and Italy, whereas the other^(^19^)^ included 16 hospitals in 13 different European countries. Table 2 compiles the data found for regional DRL values. Schegerer et al.^(^20^)^ reported that, despite selecting the largest centers in European countries over a 12-month period, they were not able to acquire a sample of 20 patients for eligible procedures at some centers. Similar to what was found for national DRLs, the authors of both studies reported that complexity was not considered and suggested that this analysis be included in future research. Within regional DRL studies, the highest values were found for hepatic embolization (transarterial chemoembolization), with DRLs for KAP and CAK of 241 Gycm^2^ and 1.868 Gy, respectively. In addition, 19 studies exclusively dedicated to local DRLs were identified, established in a sample of centers within a country, as outlined in Table 3, along with the two previously mentioned studies highlighting the interconnection of local DRLs across regional and national categories^(^14^,^15^)^.
Among the 19 studies that defined local DRLs, only two were multicenter studies. The study conducted by Ihn et al.^(^21^)^ involved 22 hospitals, totaling 22 X-ray systems, whereas that conducted by Isoardi et al.^(^22^)^ included 21 hospitals, with a total of 44 hybrid rooms and 16 mobile X-ray units. Slave et al.^(^38^)^ conducted a single-center study with two X-ray systems, and the remaining 16 studies were single-center studies with only one X-ray system^(^23^,^25^–^29^,^31^–^37^,^39^)^. Two studies do not provide details on the institution and X-ray systems used^(^24^,^30^)^. All of the studies were retrospective, except for that conducted by Tzanis et al.^(^34^)^, who described their study design as prospective. It is also noteworthy that the highest local DRLs were associated with uterine artery embolization, with specific values for KAP, CAK, and FT of 1463.8 Gycm^2^, 4.019 Gy, and 24.8 min, respectively.
Complexity assessment
Only Heilmaier et al.^(^39^)^ and Tzanis et al.^(^34^)^ took into account the level of complexity of the procedures. In the first article, 40 FGI procedures were analyzed, classified as “simple”, “standard”, or “difficult”. To define those levels of complexity, interventional radiologists considered patient cooperation, patient body mass index, standard anatomy, access/puncture difficulties, and complications. In the Tzanis et al. study^(^34^)^, 70 EVAR procedures were included. The authors classified complexity by using a scoring system, considering access vessels (normal, unilateral, or bilateral), aortic neck anatomy, concomitant procedures, and contralateral limb catheterization time. Thus, they distributed the procedures into three categories of complexity: low (total score ≤ 5), medium (total score of 6 or 7), and high (total score
7).
Pediatric DRLs
Among the studies selected, all pediatric DRLs were local (Table 4). The authors stratified their samples by body weight or age group. The procedure with the highest pediatric DRL values was sclerotherapy for patients weighing 50–80 kg, with DRL values for KAP and FT of 37.34 Gycm^2^ and 23.3 min, respectively^(^10^)^. Not all authors collected CAK and exposure time data.
EVAR comparative analysis
The only procedure identified in studies of local, national, and regional DRL values was EVAR, although the EVAR classifications differed among them. As can be seen in the Table 5, the local DRL value for the KAP dose descriptor in the Tzanis et al. study^(^34^)^, which considered a single facility, was higher than the regional DRL value reported for Europe and the national DRL value reported for mobile X-ray systems in Spain (230.6 Gycm^2^ vs. 158.49 Gycm^2^ and 87 Gycm^2^, respectively). However, those values were all lower than the 278.0 Gycm^2^ reported for hybrid rooms in Spain^(^18^)^.
Table 5: Comparative regional, national, and local DRL values described for the EVAR procedure in the articles evaluated.
Variation factors
The variation factors influencing DRL values included equipment technology (such as additional X-ray beam filtration and improved detector sensitivity), the protocols adopted (standard vs low-dose), equipment quality control (accuracy of dose metrics like KAP and CAK), operator experience, patient characteristics, and procedural features. Schegerer et al.^(^20^)^ stated that newer X-ray equipment tends to offer better filtration and detector capabilities. Rial et al.^(^18^)^ observed that procedures performed in hybrid rooms resulted in higher DRL values than did those involving the use of C-arm systems. In additionally, some authors stressed the need for routine quality control tests to ensure the accuracy of dose measurements, particularly regarding correction factors for KAP and CAK.
No association was identified between DRL values and the type of institution, as evidenced by the multicenter study that analyzed potential variations between private clinics and public hospitals^(^16^)^. Operator experience^(^21^,^32^,^37^,^38^)^ was another reported variation factor deemed determinant for patient dose. Less experienced operators, such as interns and residents, tend to take longer to perform procedures, and consequently, the dose is proportionally higher. Peter et al.^(^32^)^ reported that when a procedure is considered more complex/challenging, it is performed by more experienced physicians, resulting in lower radiation doses.
As a dose optimization strategy, dedicated low-dose protocols have been reported. Forbrig et al.^(^23^)^ reported that a dedicated low-dose fluoroscopy protocol resulted in a 33% reduction in radiation exposure. Low-dose protocols in digital subtraction angiography have also been documented^(^26^,^27^,^31^,^35^)^, resulting in dose reductions ranging from 20% to 61%. Changing the exposure mode (from normal to low) and using the pulsed fluoroscopy mode have also been shown to decrease patient radiation doses^(^32^,^37^)^.
Trend analysis
A trend analysis could assess changes in DRL establishment processes and radiation exposure over time, considering improvements in technology and clinical practice. However, none of the studies reviewed the same procedures at the same centers or evaluated temporal changes in DRL values and optimization strategies. All of the studies presented cross-sectional data, which precluded the evaluation of DRL implementation outcomes within institutions.
Practical recommendations
Practical recommendations included standardizing procedural nomenclature to improve dose comparisons^(^21^)^, establishing separate DRLs for therapeutic and diagnostic procedures^(^28^)^, and encouraging the use of dose tracking software for data collection and DRL establishment, including complexity considerations^(^36^,^39^)^.
DISCUSSION
This review provides a comprehensive overview of the scientific evidence available to establish DRL values in interventional radiology. The studies evaluated addressed a wide range of procedures. However, the lack of standardization in nomenclature across studies hindered the direct comparison of DRL values. The results indicated a predominance of studies conducted in Europe, especially in Germany. The complexity of procedures and the lack of consideration of that complexity were recurring challenges faced by researchers, suggesting the need for more refined approaches that include this factor. In addition, the use of dose management software has emerged as an effective strategy to facilitate data collection and the establishment of DRLs. Examples of commonly used dose management systems include DoseWatch (GE Healthcare, Buc, France), Radimetrics (Bayer Healthcare, Whippany, NJ, USA), and OpenREM (an open-source platform: https://openrem.org/).
The breadth of interventional radiology was clearly highlighted with the identification of DRL values for 113 different procedures. Given that the DRL establishment process can be considered a form of optimization, it is recommended that institutions assess their typical dose values or, when available, evaluate local DRL values in relation to national or regional DRL benchmarks^(^5^)^. For this, it is essential that procedures have standardized terminology. Although the World Health Organization provides the International Classification of Health Interventions as an online reference^(^40^)^, it was not employed in any of the studies evaluated in this review.
In the quest to define DRLs, studies coming out of Europe have predominated. In 2013, the European Union published Council Directive 2013/59/Euratom^(^41^)^, which mandated member states to inform patients about the radiation dose received during procedures and to establish DRLs^(^42^)^. In this context, investments were made in dose management systems. This can be observed in this review in terms of practical recommendations from the majority of articles. National or regional regulatory frameworks play a crucial role in strengthening the implementation of the DRL establishment process.
The analysis of procedural complexity should take into account variations in anatomy and clinical factors (e.g., body habitus, vascular anatomical variations, diameter of normal vessels, and number of vessels to be treated) that determine technical parameters and FT^(^5^)^, directly impacting DRL values. That level of structure was not observed among the articles evaluated in this review. The absence of an established standard for defining procedural complexity hinders researcher understanding of how to consistently conduct and compare this analysis^(^37^)^, and all of the studies emphasized the need to include this factor in future research.
This review has some limitations. The predominance of studies conducted in Europe may limit the generalizability of the findings to other regions. Although standardization across diverse procedures was necessary, the considerable heterogeneity in DRL values and methodologies complicated direct comparisons. In addition, despite using comprehensive descriptors, the search strategy may not have captured all relevant interventional radiology procedures.
This systematic review revealed significant gaps in the global implementation of DRLs in interventional radiology. Standardizing procedural nomenclature and complexity is essential for consistent data collection and comparisons. Expanding data collection to underrepresented regions, especially Latin America and, in particular, Brazil, is crucial. European legal frameworks have proven effective in promoting radiation safety, underscoring the need for national regulatory initiatives.
To further enhance the implementation of DRL establishment processes, it is recommended that the adoption of dose tracking and management software be encouraged, that national standardization efforts following the European model be proposed, and that the involvement of centers in Brazil and the rest of Latin America in collaborative data networks be actively promoted. Such coordinated efforts are fundamental to enhancing the effectiveness, reproducibility, and global applicability of DRL initiatives.
The reference list from the paper itself. Each links out to its DOI / PubMed record.
- 1Doherty MG. Value of interventional radiology: past, present, and future Semin Intervent Radiol.2019362683093661310.1055/s-0039-1679951 PMC 6440898 · doi ↗ · pubmed ↗
- 2Vanzant D. Mukhdomi J. Safety of fluoroscopy in patient, operator, and technician Stat Pearls [Internet]Treasure Island (FL)Stat Pearls Publishing 202334033329 · pubmed ↗
- 3ICRP ICRP Publication 73: Radiological protection and safety in medicine SAGE Publications Ltd 1996
- 4ICRP ICRP Publication 135: Diagnostic reference levels in medical imaging SAGE Publications Ltd 201710.1177/014664531771720929065694 · doi ↗ · pubmed ↗
- 5VañóE Miller DL. Martin CJ. ICRP Publication 135: Diagnostic reference levels in medical imaging Ann ICRP 2017461114410.1177/014664531771720929065694 · doi ↗ · pubmed ↗
- 6Damilakis J Frija G. Brkljacic B. How to establish and use local diagnostic reference levels: an ESR Euro Safe Imaging expert statement Insights Imaging 202314273674683210.1186/s 13244-023-01369-x PMC 9902573 · doi ↗ · pubmed ↗
- 7Lee MY. Kwon J. Ryu GW. Review of national diagnostic reference levels for interventional procedures Prog Med Phys.2019307588
- 8Mc Innes MDF. Moher D. Thombs BD. Preferred reporting items for a systematic review and meta-analysis of diagnostic test accuracy studies: the PRISMA-DTA statement JAMA 2018319388962936280010.1001/jama.2017.19163 · doi ↗ · pubmed ↗