Psychosocial factors associated with alcohol use in lower socioeconomic position populations: a scoping review
Sarah Dance, Sally Adams, Andrew Weyman, Amy Herbert, Chloe Burke, Netanya Cassidy, Nina Higson-Sweeney, Charlotte Dack

TL;DR
This review explores psychosocial factors linked to alcohol use in lower socioeconomic populations to guide better interventions for reducing alcohol-related harm.
Contribution
The study provides a comprehensive synthesis of psychosocial factors influencing alcohol use in lower socioeconomic position populations.
Findings
Psychosocial factors like mental health, stress, and drinking motives are associated with alcohol use in lower SEP populations.
Quantitative studies dominate the evidence base, with a need for more qualitative research to understand lived experiences.
Environmental factors in disadvantaged neighborhoods may amplify individual drinking motivations, requiring targeted interventions.
Abstract
Improved understanding of psychosocial factors associated with alcohol use in lower socioeconomic position (SEP) populations could inform theory and practice in the development of interventions aimed at reducing alcohol-related harm in this population. This review aimed to review and synthesise the literature on these associations for lower SEP populations. We conducted a scoping review of studies examining associations between psychosocial factors and alcohol use in lower SEP populations. Web of Science (Core Collection), Scopus, Embase (Embase and Medline), PubMed, and APAPsycNet (PsycInfo) were searched. Out of 6597 identified articles, 26 articles were included from the databases. Hand searching of references of these studies identified four additional eligible studies. Narrative synthesis was used to synthesise identified factors. 30 studies in total (21 quantitative, nine…
Genes, proteins, chemicals, diseases, species, mutations and cell lines named across the full text — each resolved to its canonical identifier and authoritative record.
Click any figure to enlarge with its caption.
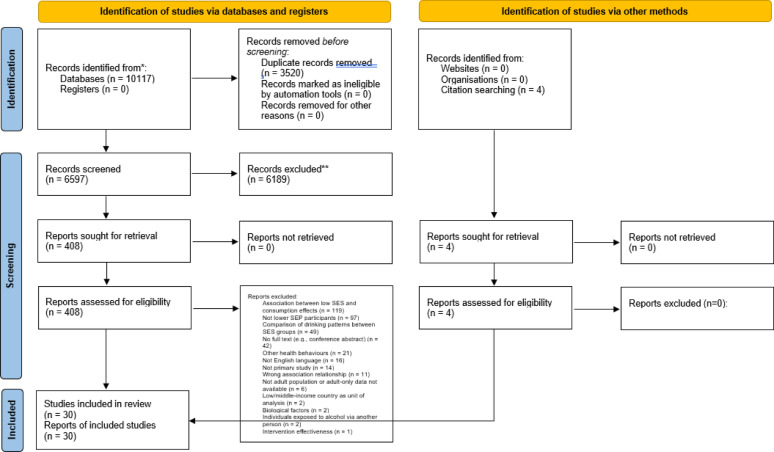 Figure 1
- —https://doi.org/10.13039/501100000835University of Bath
Peer Reviews
No public reviews on file for this paper yet. If you reviewed it on a platform where reviews are public (OpenReview, ICLR, NeurIPS, ICML), you can paste yours below so the community can read it here.
Videos
No videos yet. Explain this paper in a talk, walkthrough, or lecture? Add one.
Taxonomy
TopicsSubstance Abuse Treatment and Outcomes · Alcohol Consumption and Health Effects · Homelessness and Social Issues
Background
Alcohol use (AU) is linked to three million deaths and more than 200 health conditions each year worldwide [1]. However, alcohol harms are not equally distributed. The alcohol harm paradox is where lower socioeconomic position (SEP) populations exhibit higher rates of alcohol-related ill health and mortality, despite evidence of lower consumption rates than higher SEP populations [2] (predominantly based on evidence from high-income countries [3, 4]). This suggests that socioeconomic differences in health impacts cannot be explained by consumption rates alone [3]. Therefore, tailored interventions for lower SEP populations may need to account for contextual variables.
Most alcohol public health interventions focus on reduced AU in non-targeted approaches focused on the general population. However, reduced participation in public health campaigns (e.g., Dry January) among lower SEP populations [5] may suggest reduced impact in this group, whereas legislative action such as minimum unit pricing (MUP) demonstrates greater impact in reducing alcohol-related harms among lower SEP populations [6]. Enhanced understanding of the psychosocial context of AU in lower SEP populations may increase the impact of tailored public health interventions, in line with Medical Research Council guidance on intervention design [7] and as demonstrated by tailored public health interventions [8, 9]. However, only one intervention published in English, from the UK, aimed at reducing AU has been specifically developed for lower SEP populations. This text-messaging intervention did not significantly reduce binge drinking, but high levels of engagement were observed [10]. Therefore, there may be scope to investigate the potential for a tailored approach among this population.
Epidemiological [3, 11–13] and sociological [14–16] literature has focused on how SEP populations may differ in terms their AU, drinking patterns, and alcohol-related consequences. The literature on contextual psychosocial factors associated with AU tends to focus on associations within younger populations, such as adolescents [17, 18] and university students [19, 20]. For example, low self-esteem, stress, anxiety [20], and social norms [19] have been associated with greater disposition to drinking in student populations. It is unclear to what extent factors associated with drinking in these populations may apply to other groups. A systematic review of proposed hypothetical and empirical explanations to explain the alcohol harm paradox identified a range of variables, ranging from individual (e.g., biological impact of multiple health risks) to structural (e.g., corporate influence on policy decisions) explanations. Risk behaviours, such as drinking patterns, clustered health behaviours (e.g., a combination of tobacco and alcohol and other drug use, as well as low physical activity levels), type of alcoholic drink, and alcohol quantity consumption history, were the most common explanations for the paradox [4]. In support, a systematic review of socioeconomic differences in mortality suggests that heavy episodic drinking explains approximately 15–30% of socioeconomic inequalities in mortality [3]. Other proposed explanations included individual explanations (e.g., stereotypes may lead individuals to exhibit behaviours others assume of them), contextual explanations (e.g., reduced social support), social disadvantage explanations (e.g., reduced access to services), and structural explanations (e.g., occupational working conditions) [4]. However, a broader literature on psychosocial factors associated with AU in lower SEP populations (beyond proposed explanations of the paradox) has yet to be synthesised. In particular, it has not been synthesised from a health psychology perspective informed by a psychosocial approach [21], with a focus on identifying targets to inform interventions. Interventions accounting for the psychosocial context of a health behaviour tend to have increased effectiveness among target populations [7].
We conducted a scoping review to investigate psychosocial factors associated with AU in lower SEP populations. Scoping reviews are useful for outlining factors within a diverse research area [22].
Methods
Design
This scoping review mapped psychological and social factors associated with AU among lower SEP populations. A scoping review aligns with our aim to map concepts within a heterogeneous research area. It is also appropriate for examining a wider objective than a systematic review may do [22]. Our approach involved synthesising reported findings related to reported factors. This aligns with other scoping reviews which have mapped factors associated with a health-related concept and considered significance of reported findings [23–25]. Following relevant guidance [22], a protocol was pre-registered (https://osf.io/6574d) and the PRISMA Extension for Scoping Reviews (PRISMA-ScR) reporting guidelines [26] were followed (see Supplementary Materials).
Inclusion criteria
Inclusion criteria aligned with the Population-Concept-Context (PCC) framework; a recommended framework for scoping reviews [22]. The population was lower SEP populations. We included both studies which focused on a lower SEP population, and studies which compared lower and higher SEP populations. Where a spectrum of SEP was reported, we used the lower range as lower SEP. In order to scope the existing literature, we considered lower SEP broadly and included studies with measurements such as income, education, occupation, and community disadvantage. This approach was informed by nationally used measurements of socioeconomic status (SES) and social class in the UK, including occupation [27] and social grade based on qualifications and occupation [28]. We were also informed by the index of multiple deprivation, which incorporates several measures (e.g., income, employment, education) and is a nationally used measurement in the UK to assess alcohol-related inequalities [29]. We excluded studies which focused on health inequalities in some populations, such as populations experiencing homelessness, refugee populations, immigrant populations, and indigenous populations. Whilst these populations may experience social disadvantage, we did not consider these populations as part of a lower SEP population specifically for the purposes of this review. We also excluded studies which used a lower- or middle-income country as their unit of analysis for SEP, although studies from a lower- or middle-income country which defined a lower SEP population according to the criteria above (e.g., based on measurements such as income, education, occupation, and community disadvantage) would have been eligible for inclusion. We included studies with adult populations aged 18 years old or above (or a mean average age of at least 18 years for studies with participants above and below 18 years). We included only adult populations because we anticipated that there may be distinct psychosocial factors associated with AU in adolescent populations and to inform interventions targeted towards AU in adulthood.
The concept was psychosocial factors associated with AU. We sought to identify psychological factors (e.g., mental health) or social factors (e.g., alcohol availability). Associated factors could be referred to in studies by terms such as an association (quantitative studies) or related concept (qualitative studies). In this review, we defined psychosocial factors according to the biopsychosocial model. This model considers health more broadly than the biomedical model of health and disease, and proposes that psychological (e.g., factors related to an individual) and social (e.g., factors related to their social and physical environment) factors also play a role in health experiences and diseases [21].
The context was any setting or location. We included quantitative and qualitative studies of any design in English.
Search strategy
Search terms were developed to capture broad references to SEP and psychosocial factors (see Supplementary Materials for full search strategy). Five databases were searched: Web of Science (Core Collection), Scopus, Embase (Embase and Medline), PubMed, and APAPsycNet (PsycInfo). Databases were searched from January 2000 – December 2022, with a search update performed on 6th January 2025. Articles were downloaded into Endnote and imported into Covidence for de-duplication. All articles were screened by one author and independently screened by a second reviewer at title/abstract and full-text stage (K = 0.36, K = 0.30). Differences were resolved through reviewer discussion. To supplement the database searches, reference lists of included studies were hand-searched for relevant references (see Fig. 1).
Fig. 1PRISMA flow chart
Data extraction and charting
Data were extracted using a Microsoft Excel document by one author, which was reviewed for accuracy by a second reviewer. Extracted data included: study characteristics, design, sample, lower SEP measure, AU measure, analysis method, number of participants, psychosocial factor measure (quantitative studies), and qualitative and quantitative findings.
Study characteristics are presented in Table 1 and findings are presented in Tables 2, 3, 4, 5 and 6. A narrative summary of study findings is provided in categories of psychosocial factors investigated and methodological designs. Supporting statistics are provided for identified associations among lower SEP populations. When populations are reported for each study, we used the term used by the primary study to describe SEP populations. In order to meet the aim of the review, we mainly focus on findings for lower SEP populations rather than extensively discuss higher SEP populations.
Table 1. Study characteristicsStudyCountryDesignSampleDatasetSEP measureNumber of participantsAge of samplePsychosocial factorMeasure of alcohol useArora et al. [54]IndiaQualitative - Focus groupsResidents in two states in IndiaN/ASES17118–58Social acceptanceN/AAssanangkornchai et al. [30]ThailandQuantitative - Secondary analysis of repeated cross-sectional surveyAdults in Thailand2014 Thai National Health Examination SurveyWealth index and highest education level13, 17720+ (46.7 mean average)Major depressive episodeQuestionnaire (AUDIT-10)Boniface et al. [50]UKQuantitative - Secondary analysis of cross-sectional surveyResidents in two boroughs of LondonSouth East London Community Health studyIncome, occupation, housing status, and education1, 05216+Common mental disorderQuestionnaire (AUDIT-10)Cerda et al. [33]USAQuantitative - Secondary analysis of repeated cross-sectional surveyResidents in Louisiana, Mississippi, and Alabama, USA before Hurricanes Katrina/RitaPanel Study of Income DynamicsIncome, education43918–85 (41.4 mean average)Exposure to hurricane-related stressorsQuestionnaire (other)Elliot and Lowman [49]USAQuantitative - Secondary analysis of longitudinal studyRespondents who completed both waves of the National Co-Morbidity SurveyNational Co-Morbidity SurveyIncome, education4, 97915–59 (33.1 mean average, 10.7 SD)Psychological resources (locus of control, religiosity)Questionnaire (other)Grzywacz & Almeida [34]USAQuantitative - Repeated telephone interviewsAdults who had previously participated in the National Survey of Midlife Development in the United StatesNational Study of Daily ExperiencesEducation80225–74 (44.6 mean average, 13.4 SD)1. Daily stress and stress pile-up2. Negative affectQuestionnaire (other)Hart [58]AustraliaQualitative - InterviewsYoung adults living in or around a suburb in Melbourne, AustraliaN/AResidence in disadvantaged areaNot reported18–241. Family influence.2. Memories and emotions during drinking.N/AHeim et al. [40]UKQuantitative - Cross-sectional surveyUK adultsN/ASocial grade1, 63918–75 (47.7 mean average, 14.7 SD)Coping drinking motiveQuestionnaire (AUDIT-10)Järvinen [57]DenmarkQualitative - InterviewsEmployees in a Danish companyN/ASocial class3024–65 (43 average)Risk conceptionN/ALunnay et al. [51]AustraliaQualitative - InterviewsMidlife Australian womenN/AEconomic capital, social capital, cultural capital2745–641. Enjoyment.2. Coping drinking motiveN/ALunnay et al. [53]AustraliaQualitative - InterviewsMidlife Australian womenN/AEconomic capital, social capital, cultural capital5045–641. Coping drinking motive2. Stress3. Mental health benefits4. LonelinessN/ALunnay et al. [16]AustraliaQualitative - InterviewsMidlife Australian womenN/AEconomic capital, social capital, cultural capital5045–641. Stress2. Coping drinking motive3. LonelinessN/AMartinez et al. [32]NorwayQuantitative - Secondary analysis of two cross-sectional studiesAdults in NorwayThe Health Study in Opplandand Hedmark, and the Oslo Health StudyEducation10, 87240–45Depressive symptomsQuestionnaire (other)McCarthy et al. [45]USAQuantitative - Secondary analysis of longitudinal studyAdults from a study on the long-term course of adolescent alcohol and drug abuseA longitudinal study of the long-term course of adolescentalcohol and drug abuseEducation, occupation17222.12 average (1.6 SD)Alcohol expectanciesQuestionnaire (other)Molina de la Fuente et al. [56]SpainQualitative - Participatory actionResidents in two districts in Madrid, SpainN/ADistrict SES2639–78SocialisingN/AMolina de la Fuente et al. [55]SpainQualitative - Participatory actionResidents in two districts in Madrid, SpainN/ADistrict SES2639–78 (57 average)GamblingN/AMonk et al. [41]UKQuantitative – Secondary analyses of two cross-sectional surveysAdults in the UKN/ASocial grade based on occupation11, 70018–851. Mental health2. Drinking motivesQuestionnaire (AUDIT-C)Mulia & Zemore [31]USAQuantitative - Secondary analysis of cross-sectional surveyAdults in the USA2005 U.S. National Alcohol SurveyPoverty status based on income4, 08018+Psychological stress (depressive symptoms)Questionnaire (other)Pollack et al. [46]USAQuantitative – Cross-sectional surveys combined with datasetsAdults interviewed during one of the cross-sectional surveys1. Stanford Heart Disease Prevention Program 1979–19902. 1980 census data3. Alcohol availability records from California Department of Alcoholic Beverage ControlNeighbourhood deprivation8, 19725–74Alcohol availabilityQuestionnaire (other)Puddephatt et al. [48]UKQuantitative – Secondary analysis of cross-sectional surveyAdults in the UK2014 Adult Psychiatry Morbidity SurveyOccupation, education, and housing tenure143616+1. Social support2. Neighbourhood environmentQuestionnaire (AUDIT-10)Rocheleau [35]USAQuantitative - Secondary analysis of longitudinal studyRespondents to the National Longitudinal Study of Adolescent to Adult HealthNational Longitudinal Study of Adolescent to Adult HealthSocial class based on parental education and employment3, 74922–31Working long and intense hours during adolescenceQuestionnaire (other)Rodriguez-Stanley et al. [42]USAQuantitative – Cross-sectional surveyAdults in the USN/A1. Socioeconomic status based on education, income, employment.2. Subjective Social Status41218–85Psychological distressQuestionnaire (other)Sabia et al. [38]FranceQuantitative - Prospective cohort studyEmployees of a French companyGAZEL cohortEducation, occupational position4, 07355–65Cognitive performanceQuestionnaire (other)Segrin et al. [44]USAQuantitative - Cross-sectional survey combined with datasetUS adults2015 American Community SurveyNeighbourhood disadvantage105021–70 (43.2 mean average, 13.7 SD)1. Social Support2. Negative emotionalityQuestionnaire (other)Segrin et al. [43]USAQuantitative – Repeated cross-sectional survey combined with datasetUS adults2018 American Community SurveyNeighbourhood disadvantage61821–65 (30.80 mean average, 9.81 SD)Psychological distressQuestionnaire (AUDIT – 7 items)Shortt et al. [37]UKQuantitative – secondary analysis of repeated cross-sectional surveyIndividuals living in private households in ScotlandScottish Health Survey 2008–2011Income24, 55716+Alcohol outlet densityQuestionnaire (other)Shuai et al. [39]UKQuantitative - Cross-sectional surveyUndergraduate students who reported past year hazardous drinkingN/ASubjective social status21918–25 (19.84 mean average, 1.32 SD)1. Exposure to aversive experience2. Internalizing symptoms3. Drinking to copeQuestionnaire (AUDIT-10)Ward et al. [52]AustraliaQualitative - InterviewsMidlife Australian womenN/AEconomic capital, social capital, cultural capital5045–641. Personal and family stressors2. Coping drinking motiveN/AYaogo et al. [36]FranceQuantitative - Prospective longitudinal cohort studyIndividuals who participated in TEMPO studyTEMPO cohortChildhood family income67422–35Adolescent alcohol repeated intoxicationQuestionnaire (AUDIT-10)Zhu et al. [47]ChinaQuantitative - Cross-sectional surveyUniversity studentsN/AFamily economic hardship51317–22 (19.29 mean average, 5.11 SD)1. Perceived discrimination2. ImpulsivityQuestionnaire (other)AUDIT = Alcohol use disorder identification test. N/A = Not applicable. Questionnaire (other): survey or question(s) other than AUDIT used
Table 2. Quantitative studies investigating associations between alcohol use and psychosocial factors within a lower SEP populationMental healthStressAdolescenceAvailabilityCognitiveAssanangkornchai et al. [30]Major depressive disorder---**Cerda et al. **[33]Exposure to hurricane-related stressors---Grzywacz & Almeida [34]Daily stress and stress pile up✓**Martinez et al. **[32]Depressive symptoms---Mulia & Zemore [31]Psychological stress (depressive symptoms)✓Rocheleau [35]Working intense hours in adolescenceXSabia et al. [38]Cognitive performance✓**Shortt et al. **[37]Alcohol outlet density---**Yaogo et al. **[36]Repeated alcohol intoxication in adolescence✓ Total
3
2
2
1
1 ✓ = Significant association. --- = Mixed findings. X = Non-significant association
Table 3. Specificity of associations between alcohol use and psychosocial factors to a lower SEP population, compared to higher SEP populationsMental healthStressAdolescenceAvailabilityCognitiveAssanangkornchai et al. [30]Major depressive disorderXCerda et al. [33]Exposure to hurricane-related stressors✓Grzywacz & Almeida [34]Daily stress and stress pile up✓Martinez et al. [32]Depressive symptomsXMulia & Zemore [31]Psychological stress (depressive symptoms)XRocheleau [35]Working intense hours in adolescenceXSabia et al. [38]Cognitive performance✓Shortt et al. [37]Alcohol outlet density✓Yaogo et al. [36]Repeated alcohol intoxication in adolescenceX Total
3
2
2
1
1 ✓ = Significant association only found among lower SEP populations. X = Significant association found among higher SEP populations
Table 4. Quantitative studies of investigations of psychosocial factors pathways associated with alcohol consumption in lower SEP populationsMental healthDrinking motivesStressCognitiveAvailabilitySocial - otherPsychological - otherElliot and Lowman [49]Psychological resources [locus of control, religiosity] (psychological - other)✓✓**Heim et al. **[40]Coping drinking motive✓**McCarthy et al. **[45]Alcohol expectancies (cognitive)✓Monk et al. [41]Mental health (mental health)Drinking motives (drinking motives)------Pollack et al. [46]Alcohol availabilityXPuddephatt et al. [48]Social support (social – other)Neighbourhood environment (social – other)✓✓Rodriguez-Stanley et al. [42]Psychological distress (mental health)XSegrin et al. [44]Social support (social – other)Negative emotionality (mental health)✓XSegrin et al. [43]Psychological distress (mental health)✓**Shuai et al. **[39]Exposure to aversive experience (stress)Internalising symptoms (mental health)Drinking to cope (drinking motives)✓✓✓Zhu et al. [47]Impulsivity (psychological – other)X Total number of factors
5
3
1
1
1
4
3 ✓ = Significant association. X = Non-significant association. --- Mixed findings. Note: Pollack et al. (2005) states ‘data not shown’ for this finding
Table 5. Quantitative studies investigating associations between alcohol use and lower SEP tested with a psychosocial factor adjusted for as a confounderMental healthSocial - otherBoniface et al. [50]Common mental disorderXGrzywacz & Almeida [34]Negative affect✓Zhu et al. [47]Perceived discrimination (social – other)X Total
2 ✓ = Significant association remains when adjusted for psychosocial factor as confounder. This indicates that the psychosocial factor may not contribute to the relationship. X = Significant association no longer remains when adjusted for psychosocial factor as confounder. This indicates that the psychosocial factor may contribute to the relationship
Table 6. Qualitative studies investigating psychosocial factors associated with alcohol consumption in lower SEP populationsDrinking motivesStressMental healthPsychosocial - otherArora et al. [54]Social acceptanceMolina de la Fuente et al. [56]SocialisingMolina de la Fuente et al. [55]GamblingHart **[58]Family influence, memories and emotions during drinking**Järvinen [57]Risk conceptionLunnay et al. **[51]Enjoyment (psychosocial – other)Coping drinking motive (drinking motives)**Lunnay et al. [53]Coping drinking motive (drinking motives)StressMental health benefits (mental health)Loneliness (psychosocial – other)****Lunnay et al. [16]Stress (stress)Coping drinking motive (drinking motives)Loneliness (psychosocial – other)*Ward et al. [52]Personal and family stressors (stress)Coping drinking motive (drinking motive) Total
4
3
1
9
- = Indicates factor identified in qualitative study
Findings
Search results and study characteristics
The searches identified 6597 articles after duplicate removal (5565 from the original search and 1032 from the updated search), of which 408 were screened at full text (see Fig. 1).
30 studies (21 quantitative, nine qualitative) were included (see Table 1). The studies originated from the following countries: USA (n = 10), UK (n = 6), Australia (n = 5), France (n = 2), Spain (n = 2), and one study each from China, Denmark, India, Norway and Thailand.
Quantitative studies
Associations between alcohol use and psychosocial factors in lower SEP populations
Nine studies investigated associations between AU and psychosocial factors in lower SEP populations (see Tables 2 and 3).
Mental health
Three quantitative studies investigated associations between mental health and AU in lower SEP populations. One study investigated major depressive episode (MDE) [30] and two studies investigated depressive symptoms [31, 32]. Assanangkornchai et al. [30] found a significant association between MDE and harmful-dependent AU among the lowest (adjusted odds ratio (OR) = 7.14, 95% confidence interval (CI): 3.71, 13.73) and highest, but not middle, tercile of a wealth index. An association between MDE and hazardous drinking was not significant among the lowest, but was among the middle and highest, wealth tercile. Associations between MDE and hazardous or harmful-dependent drinking were both not significant among a lower education level, but were significant among the higher education level [30]. Mulia and Zemore [31] found that an association between depressive symptoms and heavy drinking was significant both among those with income below the federal poverty line (β = 0.24, p < 0.001), and above the federal poverty line [31]. Similarly, Martinez et al. [32] found significant associations between depressive symptoms and an increased risk of consuming five or more drinks per past year typical drinking occasion, compared to one to two drinks per past year typical drinking occasion, among individuals across three education tertiles. Once adjusted for demographics (e.g., age, gender), the association remained significant among the lowest (relative risk ratio (RRR) = 1.60, 95% CI: 1.13, 2.34, p ≤ 0.05) and middle, but not among the highest tertile. The same association for risk of consuming three to four drinks per past year typical drinking occasion was significant only among the middle (this was no longer significant once adjusted for demographics), and not among the lowest or highest, education tertile. Associations between depressive symptoms and an increased risk of having seven to 12 heavy episodic drinking episodes in the past year were not significant across education tertiles. The same association for risk of having 13 or more heavy episodic drinking episodes was only significant among the middle education tertile, although this was again no longer significant once adjusted for demographics [32].
Stress
Two quantitative studies investigated associations between stress and AU in lower SEP populations. Exposure to hurricane-related stressors [33] and exposure to general stressors [34] were investigated. Cerda et al. [33] found a positive association (reported by authors as marginally significant at p < 0.10) between exposure to post hurricane-related (Hurricanes Katrina and Rita in 2005) stressors and increased AU in individuals with a history of low income (estimate = 58.41, standard error (SE) = 31.45), but not among individuals with a history of middle income. There was also a significant positive association between pre-Katrina/Rita and Katrina/Rita-associated events and increased AU among individuals with less than high school education (estimate = 92.69, SE = 42.06, p < 0.05), but not those with high school education, low-income history, or middle-income history. However, an association between pre-Katrina/Rita and Katrina/Rita-associated events and the odds of binge drinking for a higher number of days in 2007 (controlled for the number of days binged in 2005) was not significant for individuals with a low or middle income history, or those with less than high school, or high school, education [33]. In addition, Grzywacz and Almeida [34] found a significant association between daily stressors and binge drinking for individuals with less than high school education (b=−0.63, SE = 0.09, p < 0.001), but not for individuals with high school, or a vocational/technical degree or some college, education. An association between stress pile-up and binge drinking was significant for individuals with less than high school education (b = 0.67, SE = 0.19, p < 0.001), but not for individuals with high school, or a vocational/technical degree or some college, education [34].
Adolescence
Two quantitative studies investigated associations between adolescence-related factors and AU in adulthood in lower SEP populations. Intense working hours during adolescence [35] and experiencing repeated alcohol intoxication during adolescence [36] were investigated. Rocheleau [35] found that lower social class background did not significantly moderate an association between invested work in adolescence and binge drinking likelihood among 22- to 25-year-olds or 27- to 31-year-olds. Higher social class background significantly moderated this association among 22 to 25 (b=−1.22, p < 0.05; SE = 0.32; marginal effect=−0.19, p < 0.05), but not among 27 to 31, year olds [35]. Whereas, Yaogo et al. [36] found significant associations between repeated adolescent alcohol intoxication and adulthood alcohol abuse among individuals from low-income families (OR = 11.86, CI: 3.35, 41.94, p = 0.0001), and individuals from intermediate or high-income families (OR = 2.49, CI: 1.09, 5.68, p = 0.02) [36].
Availability
Shortt et al. [37] found that total alcohol outlet density was significantly positively associated with AU probability for three out of four measures (exceeding guidelines, binge drinking, and problem drinking; all p < 0.05), but not harmful drinking (although there were significant increases for both on-sales (consumption on premises licenced to sell alcohol, e.g., a pub) and off-sales (alcohol for consumption away from the point-of-sale premise, e.g., a supermarket) outlet densities for harmful drinking; p < 0.05), among a low-income group. A high income group demonstrated non-significant increases for exceeding guidelines and binge drinking, and non-significant decreases for harmful drinking and problem drinking [37].
Cognitive factors
Sabia et al. [38] found a significant association between drinking more than 21 drinks a week and a reduced lower cognitive performance test score, than those who drank four to 14 drinks a week, in a low occupational group (unskilled workers) (95% CI: −3.9, −0.3, p < 0.05), and a low educational group (primary school education only) (95% CI: −7.1, −0.0, p < 0.05). This was also significant among those who drank one to three drinks a week in the low education group (95% CI: −8.8, −0.5, p < 0.05). Associations were not significant in the intermediate (professional qualification) and high educational (secondary school or higher), and intermediate (skilled worker) and high occupational (managers), groups for any AU levels [38].
Psychosocial pathways contributing to associations between AU and lower SEP
Eleven studies investigated psychosocial factor pathways associated with AU in lower SEP populations (see Table 4).
Stress, mental health, and drinking motives
Shuai et al. [39] found a significant indirect pathway (β = 0.012, SE = 0.006, CI = 0.003, 0.026) between socioeconomic deprivation and susceptibility to AU via aversive experience, internalizing symptoms and drinking to cope. This remained significant once demographic covariates were accounted for [39]. Similarly, Heim et al. [40] found that lower social grade was associated with greater reporting of coping drinking motives (r = 0.082, p < 0.01), whilst no other drinking motives were associated with social grade. Structural equation modelling indicated that social grade was significantly associated with coping drinking motives (standardised estimate = 0.06, p < 0.05), which were in turn significantly associated with AU (standardised estimate = 0.28, p < 0.001) [40]. Monk et al. [41] also found that lower social grade was significantly associated with increased coping drinking motives (estimate=−0.068, SE = 0.024, β=−0.039, p = 0.006), which were significantly associated with increased AU (estimate = 0.755, SE = 0.051, β = 0.232, p < 0.001). Social grade was not significantly associated with mental health, which was significantly associated with coping (estimate = 0.181, SE = 0.014, β = 0.213, p < 0.001) and conformity (estimate = 0.044, SE = 0.011, β = 0.065, p < 0.001) drinking motives (but not with social and enhancement drinking motives). Coping, social (estimate = 0.226, SE = 0.049, β = 0.088, p < 0.001) and enhancement (estimate = 0.957, SE = 0.049, β = 0.368, p < 0.001) drinking motives were significantly associated with increased AU, whereas conformity drinking motives (estimate=−0.385, SE = 0.063, β=−0.095, p < 0.001) were significantly associated with reduced AU [41].
Mental health and other social factors
Rodrigues-Stanley et al. [42] found non-significant indirect effects of SES and subjective social status on AU or AU change via psychological distress (comprising depressive cognition, depressive affect, and perceived stress) [42]. Whereas, Segrin et al. [43] found a significant indirect effect of neighbourhood disadvantage on problem drinking via psychological distress (comprising depression, perceived stress, loneliness) over a six month period (b = 6.588e − 7, 95% CI = 1.109e − 7, 1.329e − 6, β = 0.03, p < 0.05) [43]. Segrin et al. [44] also found a significant indirect effect of neighbourhood disadvantage on increased AU via negative emotionality (b = 0.02, 95% CI = 0.01, 0.04), SE = 0.01, p = 0.01), but a non-significant indirect effect of neighbourhood disadvantage on AU via social support [44].
Cognitive factors
McCarthy et al. [45] found a significant indirect effect of education on AU via positive alcohol expectancies (Z=–1.85, p < 0.05) [45].
Availability
Pollack et al. [46] found that alcohol availability did not significantly mediate an association between neighbourhood deprivation and the odds of heavy AU [46].
Other psychosocial factors
Zhu et al. [47] found that impulsivity did not significantly moderate an association between family economic hardship and risky AU [47]. Puddephatt et al. [48] found that compared to a higher SES class (professional occupation, degree-level educated, homeowners), there were significant indirect associations between a class of economically inactive, GCSE level or lower social renters and harmful/probable dependent drinking via social support (unstandardised coefficient (SE) = 0.23(0.09), 95% CI = 0.08, 0.39, p = 0.01) and neighbourhood environment (e.g., social cohesion) (unstandardised coefficient (SE) = 0.13(0.06), 95% CI = 0.03, 0.22, p = 0.03). An indirect effect of social support was also significant for another class (retired, no formal education, homeowners) (unstandardised coefficient (SE) = 0.06(0.03), 95% CI = 0.01, 0.11, p = 0.04). Compared to a higher SES class, there were no significant indirect associations between any other SES classes and hazardous drinking via social support or neighbourhood environment [48]. Elliott and Lowman [49] found that: (a) associations between higher education (β=−0.007, p < 0.05) and income (β=−0.005, p < 0.05) and reduced AU were mediated by external locus of control, (b) an association between higher income and reduced likelihood of meeting criteria for alcohol abuse or dependence over time was mediated by internal locus of control (β=−0.009, p < 0.01], c) an association between higher income and increased alcohol misuse was mediated by religiosity (β = 0.008, p < 0.01], and d) an association between higher income and increased likelihood of meeting criteria for alcohol abuse or dependence was mediated by religiosity (β = 0.006, p < 0.05). The authors report religiosity as a protective factor against, and external locus of control as a risk factor for, AU among lower income individuals [49].
Associations between AU and lower SEP, with a psychosocial factor adjusted for as a confounder
Three studies investigated associations between AU and lower SEP, tested with a psychosocial factor adjusted for as a confounder (see Table 5).
Mental health and other social factors
Two studies investigated whether a mental health factor may contribute to an association between AU and lower SEP. Boniface et al. [50] found that an association between socioeconomic group and risk of harmful or dependent AU among economically inactive renters with low education levels was significant when adjusted for confounders such as age and gender (RRR = 3.05, SE = 1.63, 95% CI: 1.07, 8.71, p = 0.037). However, this association was no longer significant when also adjusted for common mental disorder (RRR = 1.71, SE = 0.96, 95% CI = 0.57, 5.14, p = 0.335) [50]. In contrast, Grzywacz and Almeida [34] found that after adjusting for negative affect as a covariate in associations between binge drinking and (a) daily stressors (b=−0.42, SE = 0.05, p < 0.001) and (b) stress pile-up (b = 0.43, SE = 0.11, p < 0.001), significant associations remained for individuals with less than high school education [34]. Furthermore, Zhu et al. [47] found that an association between family economic hardship and risky AU was no longer significant once perceived discrimination was accounted for as a mediator (b = 0.09, p > 0.05) [47].
Qualitative studies
Nine qualitative studies were included (see Table 6).
Drinking motives, stress, and mental health
Four qualitative studies outlined drinking motives, stress, and mental health factors related to AU in lower SEP populations [16, 51–53].
Lunnay et al. [51] found that working class women described AU as something enjoyable to look forward to, which enabled them to avoid thinking about negative occurrences in daily life and relieve loneliness and boredom. Experiencing a hangover was described as a way to occupy the day in the absence of limited other options, distract from daily life, and demonstrate control over their life. These factors, as well as a lack of social support, were highlighted as reducing inclinations to decrease AU [51]. Lunnay et al. [53] found that working class women described AU as a tool to cope with and remove stress, particularly in the context of alternative coping methods (e.g., social activities) being higher in cost. Alcohol was described as beneficial for their mental health, by enabling a sense of more control in their lives and bringing people closer together. They described drinking alcohol alone at home to cope with loneliness and stress [53]. Similarly, Lunnay et al. [16] found that working class women reported using alcohol to provide comfort and stress relief (in the absence of alternatives, such as secure employment). Alcohol was also reported to provide accessible support during difficult life events (e.g., losing a home), distract from loneliness, and act as a coping tool for stress [16]. In support, Ward et al. [52] found that working class women described using alcohol reactively as a means to manage stress in their lives, which resulted from personal and family stressors (e.g., health and financial issues). AU was seen to promote relaxation and wellness in the context of coping with stress. They described having less access to alternative means other than alcohol to enhance wellness (e.g., exercise classes). Reduced access to alternative means was described in terms of both financial access (e.g., classes were financially unaffordable), as well as reduced cultural and social access (e.g., feeling of not fitting in at classes) [52].
Other psychosocial factors
Five qualitative studies outlined additional psychosocial factors related to AU in lower SEP populations [54–58].
Arora et al. [54] found that differences in drinking behaviours between SES groups were explained via social acceptance of group drinking patterns, in which lower SES groups described heavy drinking and being drunk as socially acceptable. This was contrasted to the higher SES groups who described consuming a small amount of alcohol at one time, which was seen by this group as necessary for being presentable [54]. Järvinen [57] found that working class individuals described engaging in a pattern of occasional binge drinking (e.g., only weekend drinking), which they saw as less risky than daily drinking. This was contrasted with upper social class individuals who described drinking a little alcohol daily, with some combining this with occasional binge drinking. Working class individuals saw regular drinking (e.g., daily wine drinking) as riskier than middle- or upper-class individuals [57]. Molina de la Fuente et al. [56] found that residents of a lower socioeconomic district described drinking alcohol as enabling socialising with friends. Drinking socially with friends outside the home, at a bar or social event, was seen as common [56]. In a similar study, Molina de la Fuente et al. [55] found that residents of a lower socioeconomic district highlighted that drinking alcohol was linked to other addictive behaviours, such as gambling [55]. Hart [58] found that residents from disadvantaged communities described the influence of their family experience with alcohol on their drinking, in terms of either replicating or avoiding it. A family culture of occasional binge drinking was linked to frequent AU. Whereas a family and religious culture of not drinking alcohol was linked to feeling shame and conflicts with peer social norms for those who drank alcohol. Participants who had experienced traumatic alcohol-related events in their family described experiencing negative emotions and memories while drinking alcohol [58].
Discussion
This scoping review synthesises the literature on psychosocial factors associated with AU in lower SEP populations to inform tailored interventions. Factors related to mental health, stress, drinking motives, alcohol availability, factors measured in adolescence, cognitive factors, and other psychosocial factors.
Four quantitative studies indicated that mental health may contribute to a relationship between lower SEP and AU [39, 43, 44, 50]. However, three quantitative studies found significant associations between mental health factors and AU among both lower and higher SEP populations [30–32], suggesting that mental health may be associated with AU across SEP. In support, individuals in the global general population with common mental health disorders (compared to those without) have twice the likelihood of having an alcohol use disorder [59]. However, rates of mental health disorders tend to be higher among lower SEP populations [60], suggesting that links between AU and mental health in lower SEP populations could be due to the elevated rate of mental health disorders in this demographic. In contrast, one qualitative study highlighted perceived mental health benefits from drinking in a lower SEP population [53]. However, AU in the general population has negative mental health impacts in the long-term [61]. Therefore, possible misconceptions about the long-term mental health benefits of drinking among lower SEP populations may represent a target for interventions. Interventions may also need to account for the perceived mental health benefits reported by lower SEP individuals as potential motivations for AU.
Stress may contribute to a potential pathway explaining the relationship between lower SEP and AU [39]. Two quantitative studies found that stress exposure is associated with AU among lower SEP populations [33, 34]. This supports the stressor-vulnerability model, which highlights that those most likely to drink in response to stress may have increased positive expectations of drinking and reduced resources to cope with stress [62]. A link between stress and AU among lower SEP populations may also be explained by the qualitative studies in this review. Two qualitative studies reported that AU among lower SEP populations was linked to having less access to alternatives (e.g., exercise classes) other than alcohol to enhance wellbeing [52], and that alternative coping methods (e.g., social activities) were more expensive than alcohol [53]. Stressors identified in this review varied from daily life stressors [34] to disaster-related stressors (e.g., hurricane) [33], which may reflect that AU-promoting stress may be derived from individual stressful events (e.g., divorce) and societal stressful events (e.g., terrorism) [63]. The COVID-19 pandemic is an example of a societal event linked to AU [64]. The impact of stress on AU may be amplified among lower SEP populations due to greater exposure to poverty-related stressors (e.g., finances, conflict, discrimination) [65]. Moreover, the quantitative studies indicated that coping drinking motives may contribute to an association between AU and lower SEP [39–41]. The qualitative studies highlighted that drinking motives include: distraction from daily life [51], coping with stress [16], coping with stress and improving mental health [53], and managing personal and family stressors [52]. This aligns with a motivational model which suggests that individuals drink when the perceived affective benefits exceed those of not drinking [66]. Consequently, interventions may need to account for lower SEP populations experiencing more stressors and different types of stressors, yet having reduced access to alternative coping resources other than alcohol for stress.
Findings for alcohol availability were mixed. One quantitative study found significant associations between density of alcohol outlets and AU for most drinking measures among lower SEP populations [37]. This supports an availability theory which proposes that increased alcohol availability is linked to increased AU and related harms [67]. Moreover, alcohol outlets are more likely to be located within disadvantaged districts [68]. However, another quantitative study found that alcohol availability did not significantly mediate an association between deprivation and AU [46]. This aligns with a review which indicated a lack of conclusive evidence on the relationship between alcohol outlet density and AU [69]. The lack of consensus may be explained by limitations of availability measurement, such as outlets often being categorised at a broad level (e.g., rather than, for example, supermarkets specifically), and a lack of consideration of online availability and individuals travelling to purchase alcohol [70]. Furthermore, a qualitative review of the impact of alcohol availability suggested that high availability not only increases exposure to alcohol, but may promote drinking in the absence of alternative community-based recreational activities [71]. This indicates that increased access to alcohol may exacerbate the use of alcohol as a coping strategy for stress in absence of access to alternative stress management methods in underserved communities, in line with the stress and coping drinking motive factors identified in this review.
One quantitative study found that increased AU was significantly associated with a lower cognitive test score among a lower SEP population [38]. However, AU also negatively impacts cognitive task performance among the general population [72], and it is difficult to determine causality between impaired cognition and AU in most studies [73]. Another quantitative study found that an association between AU and lower SEP was partly mediated by positive expectations of AU [45]. The mediating role of positive expected outcomes of drinking supports a social cognitive approach [74]. It may be that the particular stressors and reduced coping resources experienced by lower SEP populations lead this group to seek positive outcomes from drinking. Furthermore, findings for adolescence-related factors were mixed. One quantitative study found that repeated adolescent alcohol intoxication was associated with increased later alcohol abuse in adulthood among a lower SEP population [36]. Whereas another quantitative study found that an association between long working hours in adolescence and binge drinking was not significantly moderated by lower social class background [35]. An association between behavioural adolescence factors and later adult drinking reflects a life course perspective which highlights the importance of time periods in influencing AU [75]. Therefore, interventions for lower SEP adult drinking could incorporate a longitudinal perspective by targeting at-risk adolescents.
Furthermore, social and risk perceptions of drinking patterns were identified by two qualitative studies. A social acceptance of heavy drinking and being drunk among lower SEP individuals was identified by one qualitative study [54], and binge drinking being perceived as less risky than regular drinking was identified by another qualitative study [57]. However, evidence indicates that organ damage may be more likely to follow binge drinking than moderate drinking [76]. The influence of family drinking culture was identified by another qualitative study [58]. Evidence suggests a positive association between parental drinking and drinking in their children, although causality is unclear [77, 78].
Health interventions should be informed by factors associated with a health behaviour [7]. Public health interventions for AU in lower SEP groups could target the following areas: (1) poor mental health and perceived mental health benefits of drinking, (2) stress exposure, drinking response, and reduced alternative coping resources, (3) drinking motives and underlying motivations for drinking (e.g., expected positive outcomes), (4) alcohol availability, (5) adolescent behaviours, and (6) social and risk perceptions of different drinking patterns (e.g., heavy episodic drinking) and cultural family influence. This review indicates that individual motivations for AU to cope with stress and mental health may be compounded by the environmental context of living in underserved districts, and therefore having increased access to alcohol, but reduced access to alternative coping strategies. This supports explanations of the alcohol harm paradox which suggest that lower SEP populations have reduced access to protective resources for coping with stress [4]. Policymakers implementing interventions for AU could consider not only why lower SEP populations drink alcohol on an individual level (e.g., stress), but how this is impacted by the unequal balance of low availability of alternative coping and wellbeing resources (e.g., exercise classes [52]) and high availability of alcohol [37] at a community level. For example, recommended interventions to reduce availability of and access to alcohol [79] may also need to increase availability of and access to alternative stress management resources (e.g., studies in this review highlight reduced access to social activities [53] and exercise classes [52]) in underserved communities to increase intervention acceptability among lower SEP populations. Future research could investigate what kinds of alternative community resources to support wellbeing would be acceptable to lower SEP populations.
Strengths and limitations
This review provides insight into the range of psychosocial factors associated with AU in lower SEP populations. The use of a scoping review design and incorporation of a psychosocial approach to associated factors enabled mapping of a broad research area [21].
However, this review should be considered with the following limitations in mind. Lower SEP measurement and ranges within studies varied across studies, which limits comparisons. However, a broad approach was necessary due to the variety of measures in the literature, and to meet our objective to scope the existing literature. Guidelines on SEP measurement highlight that there may not be one optimal indicator due to differing underlying theoretical bases of each indicator [80]. Other reviews on socioeconomic health inequalities have also incorporated the range of available measures [81–83]. Use of a single SEP measure may have excluded relevant studies, as income and education indicators tend to be preferred in the USA, whereas occupational indicators tend to be preferred in Europe [84]. Many studies were correlational. We therefore cannot infer causality between most factors and AU, and variables not measured in these studies may have explanatory value. Whilst the lack of quality appraisal or risk of bias assessment aligns with scoping review methodology, it does limit the interpretability of reported associations. Whilst our synthesis of reporting significant associations aligns with other scoping reviews which have followed this approach [23–25], the lack of quality appraisal notably hinders inferences which can be drawn. We therefore suggest that implications of findings of this scoping review should be validated by further systematic review and quality assessment to enable strong recommendations for interventions. The incorporation of a broad set of psychosocial factors [21] may also hinder interpretation of findings to some extent. Moreover, AU measurement varied, again limiting comparability. Most studies used self-report measures, and AU tends to be under-reported [85]. The studies identified within this review were also dependent on the search strategy used, informed by the psychosocial approach. Therefore, we may not have fully captured insights from studies beyond the boundaries of our defined search terms, such as studies which focused on more structural and policy level factors linked with AU. The quantitative studies identified were also dependent on statistical associations being investigated, which may arguably be harder to examine for structural factors affecting AU. We also did not search the grey literature.
Conclusions
We identified an array of psychosocial factors associated with AU in lower SEP populations which could inform the direction of future research for the development of tailored interventions. The evidence base is predominantly comprised of quantitative studies investigating factors such as mental health and stress. Future research in the area would benefit from greater use of qualitative studies to complement these insights and generate improved understanding of experiences of AU among lower SEP populations. This may advance knowledge of the alcohol harm paradox and its potential mechanisms. Taken altogether, the findings of this scoping review suggest that individual-level drinking motivations (e.g., coping with stress and mental health, positive expected outcomes, risk perception of drinking patterns) may be amplified by structural neighbourhood designs that increase availability of alcohol as a coping tool, yet reduce access to alternative coping strategies. Therefore, recommended population level alcohol availability and access reduction intervention approaches [79] could concurrently integrate improved access to alternative stress management resources in underserved communities to increase the acceptability of such interventions among lower SEP populations.
Supplementary Information
Below is the link to the electronic supplementary material.
Supplementary Material 1
Supplementary Material 2
The reference list from the paper itself. Each links out to its DOI / PubMed record.
- 1World Health Organziation, Alcohol. Available from https://www.who.int/news-room/fact-sheets/detail/alcohol. 2022.
- 2Alcohol Change UK. Dry January evaluation 2018. Available from: https://alcoholchange.org.uk/publication/dry-january-evaluation-2018. 2019.
- 3Office for National Statistics. The National Statistics Socio-economic classification (NS-SEC). Available from: https://www.ons.gov.uk/census/census 2021 dictionary/variablesbytopic/labourmarketvariablescensus 2021/nationalstatisticssocio-economicclassificationns-sec. 2023.
- 4Office for National Statistics. Approximated Social Grade, England and Wales: Census 2021. Available from: https://www.ons.gov.uk/employmentandlabourmarket/peopleinwork/employmentandemployeetypes/bulletins/approximatedsocialgradeenglandandwales/census 2021. 2023.
- 5Office for National Statistics. Alcohol-specific deaths in the UK. Available from: https://www.ons.gov.uk/peoplepopulationandcommunity/birthsdeathsandmarriages/deaths/datasets/alcoholspecificdeathsintheuk. 2024.
- 6World Health Organization. Tacking NC Ds. ‘Best buys’ and other recommended interventions for the prevention and control of noncommunicable diseases. Available from: https://iris.who.int/bitstream/handle/10665/259232/WHO-NMH-NVI-17.9-eng.pdf?sequence=. 2017.