Comprehensive proteome profiling of cytochrome P450 isoforms in cancer models
Sadr ul Shaheed, Ahood A. Al-Eidan, Klaus Pors, Laurence Patterson, Chris W. Sutton

TL;DR
This study maps CYP450 enzyme expression in various cancers, revealing differences that could help improve drug treatments and reduce side effects.
Contribution
The first semi-quantitative proteomic map of CYP450 isoforms across multiple cancer models is presented.
Findings
CRC models showed high expression of CYP2W1 and CYP2S1.
HNSCC models exhibited prominent CYP1B1 and CYP2W1 expression.
Hepatic cancer models were enriched in CYP3A and CYP2C subfamily members.
Abstract
Cytochrome P450 (CYP450) enzymes are essential for drug metabolism, xenobiotic detoxification, and procarcinogen activation, playing a pivotal role in both normal physiology and cancer biology. Their expression varies significantly across tissues and tumour types, reflecting the metabolic heterogeneity of cancers. Understanding these variations is critical for developing targeted therapies, optimizing drug efficacy, and minimizing toxicity. This study aimed to comprehensively profile CYP450 expression across colorectal cancer (CRC), head and neck squamous cell carcinoma (HNSCC), breast cancer, and hepatic cancer models using proteomic techniques. We analysed various cancer models (cell lines, xenografts, and patient tissue biopsies) using gel electrophoresis coupled with liquid chromatography-mass spectrometry (GEL-LC-MS). Equal amounts of protein were separated by gel electrophoresis,…
Genes, proteins, chemicals, diseases, species, mutations and cell lines named across the full text — each resolved to its canonical identifier and authoritative record.
Click any figure to enlarge with its caption.
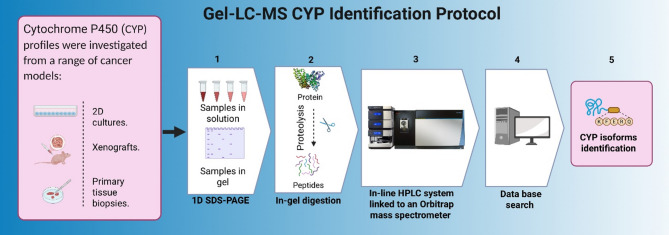 Figure 1
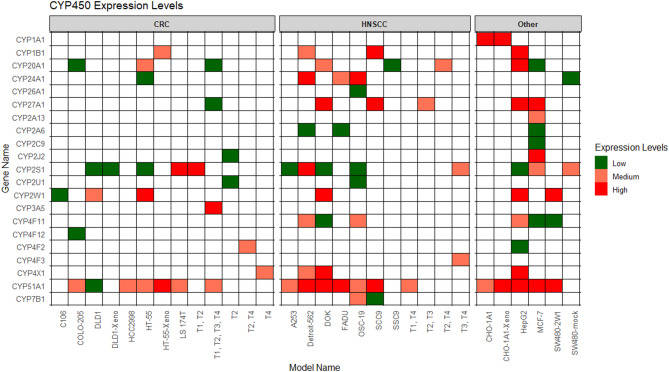 Figure 2
- —Yorkshire Cancer Research UK
Peer Reviews
No public reviews on file for this paper yet. If you reviewed it on a platform where reviews are public (OpenReview, ICLR, NeurIPS, ICML), you can paste yours below so the community can read it here.
Videos
No videos yet. Explain this paper in a talk, walkthrough, or lecture? Add one.
Taxonomy
TopicsPharmacogenetics and Drug Metabolism · Eicosanoids and Hypertension Pharmacology · Glutathione Transferases and Polymorphisms
Introduction
Cytochrome P450 (CYP450) enzymes are a superfamily of heme-containing monooxygenases that play a fundamental role in the metabolism of endogenous and exogenous compounds. These enzymes are involved in drug metabolism, xenobiotic detoxification, steroidogenesis, and the activation of procarcinogens, making them integral to both normal physiological processes and disease states, including cancer. The expression of CYP450 enzymes varies across tissues and tumour types, reflecting the metabolic heterogeneity of cancers and influencing drug efficacy, toxicity, and disease progression [1–3].
Understanding the differential expression of CYP450 enzymes in various cancers is essential for optimizing pharmacological interventions, predicting patient responses to treatment, and identifying novel therapeutic targets. Overexpression of certain CYP450 isoforms has been documented in various cancers, including breast, colorectal, lung, head and neck, gastric, oesophageal, hepatocellular, renal, childhood rhabdomyosarcoma, gall bladder carcinoma, and prostate cancers [4, 5]. Consequently, tumour-associated CYP450 isoforms, such as CYP1A1, CYP1B1, CYP2S1, and CYP2W1—have become a focus for the development of novel anticancer therapies [6]. Given the importance of CYP450 enzymes in cancer biology and treatment, comprehensive profiling of their expression in different tumour models is necessary to elucidate their functional significance and clinical implications [7].
Previous studies have employed various analytical techniques, including immunohistochemistry, Western blotting, and RNA sequencing, to investigate CYP450 expression. However, these methods have limitations in specificity and sensitivity, particularly in distinguishing between closely related CYP450 isoforms [8, 9]. Advances in proteomic technologies, such as liquid chromatography-mass spectrometry (LC-MS) [10], have provided a more precise and high-throughput approach for CYP450 profiling, allowing for the identification and quantification of these enzymes with greater accuracy.
In this study, we utilised gel electrophoresis coupled with liquid chromatography-mass spectrometry (GEL-LC-MS) to analyse the expression of CYP450 enzymes in CRC, HNSCC, breast cancer, and hepatic cancer models, including cell lines, xenografts, and patient tissue biopsies. The use of GEL-LC-MS offers several advantages, including improved protein separation, enhanced sensitivity, and the ability to identify CYP450 isoform-specific peptides. By focusing on the molecular weight range of 45–65 kDa, which encompasses most CYP450 enzymes, we aimed to generate a detailed expression profile and identify key isoforms involved in cancer metabolism.
Materials and methods
Clinical models
Cancer cell lines were sourced from the American Type Culture Collection (Manassas, VA). For the GEL-LC-MS analysis, the following cell lines were cultured under standard conditions to ensure optimal protein extraction. A panel of cancer cell lines representing multiple tumour types was included in this study: colorectal cancer (DLD1, HT-55, LS174T, COLO-205, HCC2998, C106, SW480-2W1, SW480-mock), head and neck squamous cell carcinoma (HNSCC) (A253, Detroit-562, FADU, DOK, OSC-19, SCC9), breast cancer (MCF-7), and hepatocellular carcinoma (HepG2). In addition, CHO-1A1 cells (CYP1A1-transfected Chinese hamster ovary cells) were included as a CYP450 overexpression model. Cells were maintained in the appropriate growth medium (RPMI-1640, DMEM, or DMEM/F-12), supplemented with 10% fetal bovine serum (FBS) and 1% penicillin–streptomycin, and incubated at 37 °C in a humidified atmosphere with 5% CO₂. Transfected cell lines were acquired as follows: CHO-1A1 cells were a kind gift from Thomas Freiburg (University of Dundee, UK), while SW480-2W1 and SW480-mock cells were kindly provided by Professor Magnus Ingelman-Sundberg (Karolinska Institute, Stockholm, Sweden). For harvesting, cells were detached by trypsin treatment, washed three times with sterile ice-cold PBS, and the resulting cell pellets (5 × 10⁶ cells) were stored at − 80 °C until further processing.
All animal procedures were conducted in accordance with UK National Cancer Research Institute guidelines for the Welfare of Animals. Immunodeficient Balb/C Nu/Nu mice aged 6 to 8 weeks were obtained from Harlan (Loughborough, UK). Human cancer cells were injected subcutaneously into these mice. Mice were sacrificed when tumours reached a volume of 300–500 mm³. Liver and xenograft tissues were extracted and stored at − 80 °C until required.
Human CRC tissue samples and head and neck cancer tissue samples were obtained from Ethical Tissue (ET), a Research Tissue Bank at the University of Bradford, approved by the University of Bradford’s Independent Scientific Advisory Committee (reference: application/13/051) and ethically approved by Leeds (East) Research Ethics Committee, reference 07/H1306/98 + 5.
Sample preparation
Total protein was extracted from cell lines, xenografts, and human tissue biopsies and mouse livers using the cryo-pulverization method [11]. Mouse liver microsomes were prepared from the S9 fraction of liver extracts using the Beckman Optima TL100 Ultracentrifuge (Beckman Coulter, UK) as described previously [10]. After protein estimation of each sample using the Bradford assay (Sigma Aldrich, USA), 20 µg of each sample was reduced with Laemmli buffer at 90 °C for 5 min. Denatured lysates were resolved on 10% SDS-polyacrylamide gels using a Mini-PROTEAN 3 Cell system (Bio-Rad, USA). After electrophoresis, the gels were stained with Coomassie Blue reagent (PhastGel^®^ Blue R) for 1 h at room temperature and then destained with a solution containing 50% v/v methanol, 40% v/v water, and 10% v/v acetic acid. Bands corresponding to proteins in the molecular weight range of 45 kDa to 65 kDa were excised, diced into 1 mm³ pieces, and digested as described in previous studies [10]. Extracted peptides were lyophilized by vacuum centrifugation at 45 °C and stored at − 20 °C. The experimental workflow is outlined in Fig. 1, which illustrates the GEL-LC-MS approach used for the preparation and analysis of cancer cell lines, patient tissue biopsies, and xenograft models.
Fig. 1GEL-LC-MS workflow for the analysis of cell lines, tissue, and xenografts
LC-MS analysis
Lyophilized peptide fractions were reconstituted in 12 µl of loading mobile phase (2% acetonitrile (ACN)), 0.1% formic acid. (FA)), and 4 µl were loaded onto a C18 PepMap100 trapping cartridge (5 mm × 300 μm ID, 5 μm particle) (Thermo Scientific, UK) at a flow rate of 25 µl/minute on a Dionex Ultimate 3000 nanoHPLC (Thermo Scientific). After a 4-minute wash with the loading mobile phase, the trapping cartridge was connected to an Acclaim PepMap 100 column (25 cm × 75 μm ID, 2 μm particle) at a flow rate of 300 nl/minute with 5% mobile phase B (100% ACN, 0.1% FA) in mobile phase A (2% ACN, 0.1% FA). Several reverse phase elution gradients were used, extrapolated from a 100-minute gradient from 7 to 45% solvent B, followed by column wash and equilibration. Peptide elution was coupled to electrospray ionization (ESI) at 22 kV using a steel emitter and analysed with an Orbitrap Fusion mass spectrometer (Thermo Scientific, UK). MS1 data acquisition was conducted using Xcalibur 4.0 with Foundation 3.1 SP1 software (Thermo Scientific) between 350 and 1500 m/z at 120,000 mass resolution, automatic gain control (AGC) target 3 × 10^5^, RF lens ~ 60%, with a maximum injection time of 100 ms. MS/MS acquisitions were performed on the Ion-trap in top speed mode with a 3s cycle time, with a quadrupole isolation window of 1.2 m/z, dynamic exclusion (± 5 ppm) of 60 s, intensity threshold 5000, with all ions in charge states 2 + to 5 + sequentially fragmented by collision-induced dissociation (CID) with a normalized collision energy (NCE) of 35%. A maximum 50 ms ion injection time was allowed, AGC target set as 1 × 10^4^ and polysiloxane (C_2_H_6_SiO) at 445.12003 was used as a MS lock-mass. Each reconstituted in-gel digest sample was analysed in triplicate.
GEL-LC-MS data analysis
Protein and peptide identification and quantification were performed using Proteome Discoverer 2.2, with Mascot software version 2.5 (Matrix Science, London, U.K.) against Swiss-Prot version 2022 containing 20,317 protein sequences (Human) and 17,135 (mouse). Proteins were identified by searching against reference human and mouse proteome databases, with trypsin as the proteolytic enzyme and allowing two missed cleavages. The mass tolerance for precursor and fragment ions was set to 5 ppm and 0.5 Da, respectively. Oxidation of methionine and deamidation of asparagine and glutamine were considered as variable modifications. Peptide spectrum match data were exported from Proteome Discoverer, including features such as protein name, number of peptides, unique peptides, number of PSMs, coverage, Mascot score, posterior error probability (PEP), charge states, and precursor intensity values. The list of protein identifications was manually assessed and filtered to include those with a protein Mascot score greater than the threshold value of 18 (equivalent to a significance of p ≤ 0.05), defined as Master Protein (≤ 1 unique peptide with peptide Mascot score greater than the threshold value of 18), and total PSMs ≥ 2. For visualization, protein abundance values were log₂-transformed prior to post-acquisition analysis and categorized into Low, Medium, and High expression groups by dividing the log₂ abundance distribution into tertiles (0–33%, 34–66%, 67–100%). All graphical and statistical analyses were conducted using Microsoft Excel 2016 and GraphPad PRISM software version 6.0 (GraphPad Software, San Diego, CA). The mass spectrometry proteomics data have been deposited to the ProteomeXchange Consortium via the PRIDE [12] partner repository with the dataset identifier PXD062999.
Results
Profiling of colorectal cancer models
The analysis of colorectal cancer (CRC) models identified 16 CYP450 isoforms across various cell lines and tumour types (Table 1). CYP2W1 was particularly abundant in DLD1 cells, with 31% sequence coverage, 11 total peptides, and a Mascot score of 809. CYP1B1, CYP2J2, and CYP2S1 were detected in multiple models, with CYP2S1 exhibiting the highest coverage (15%) in HT-55 cells (Fig. 2; Table 1).
Table 1. Detection of CYP450 enzymes in human colorectal cancer models: CYP450 enzymes were identified in colorectal cancer cell lines, xenografts, and patient biopsies (stages T1–T4)GeneAccessionProteinMW [kDa]CRC model typeCoverage [%]Total peptideUnique peptidesPSMsMascot scoreAbundances (log2)Expression levelCYP1B1Q16678Cytochrome P450 1B160.8HT-55-Xeno7331411523.97MediumCYP2J2P51589Cytochrome P450 2J255.8T273386222.83LowCYP2S1Q96SQ9Cytochrome P450 2S155.8DLD152269222.39LowDLD1-Xeno62243816.64LowHT-5515431218820.94LowLS 174T13551421526.59HighT1, T273386225.74HighCYP2U1Q7Z449Cytochrome P450 2U153.8T262221323.16MediumCYP2W1Q8TAV3Cytochrome P450 2W153.8C106135587719.10LowDLD13111119780923.84MediumHT-5582258027.06HighCYP3A5P20815Cytochrome P450 3A557.1T1, T2, T3, T414441010725.71HighCYP4F2P78329Phylloquinone omega-hydroxylase CYP4F259.8T2, T452266125.11MediumCYP4F12Q9HCS2Cytochrome P450 4F1260.2COLO-20552243421.05LowCYP4 × 1Q8N118Cytochrome P450 4 × 158.8T431125724.02MediumCYP20A1Q6UW02Cytochrome P450 20A152.4COLO205103352522.61LowHT-5510421411923.88MediumT1, T2, T3, T462233022.99MediumCYP24A1Q079731,25-dihydroxyvitamin D(3) 24-hydroxylase, mitochondrial58.8HT-5531135222.13LowCYP27A1Q02318Sterol 26-hydroxylase, mitochondrial60.2T1, T2, T3, T452243322.99MediumCYP51A1Q16850Lanosterol 14-alpha demethylase56.8COLO20512551013125.31MediumDLD1833712921.93LowHCC299873346224.51MediumHT-5514551116425.03MediumHT-55-Xeno28149530227.62HighLS 174T83379823.60MediumT1, T2, T3, T462248524.24MediumThe table summarizes gene symbol, UniProt accession, protein name, MW (kDa), CRC model, sequence coverage, peptide counts, PSMs, Mascot score, log₂ abundance, and qualitative expression (Low, Medium, High). Data are based on in-gel digestion of 45–65 kDa bands (n = 3 replicates)
Fig. 2. Heatmap of CYP450 Expression Levels Across Different Models and Sample Types. The heatmap displays the expression levels of CYP450 genes (rows) across different model types (columns), grouped by sample type. Gene IDs are sorted alphabetically (A to Z), and sample types are categorized into three groups: CRC, HNSCC, and Other (including Breast, Hepatoma, and Control). The color of each tile indicates protein expression level, with dark green = Low, coral = Medium, and red = High, defined by tertiles (0–33%, 34–66%, 67–100%) of the log₂-transformed abundance distribution
The analysis of CRC patient tissue biopsies identified multiple CYP450 isoforms across different tumour stages, providing insight into their role in disease progression. CYP2J2 was detected in CRC stage pT2 with 7% sequence coverage and a Mascot score of 62, while CYP2S1 was found in early-stage CRC (T1, T2) with similar sequence coverage. The CYP3A5 and CYP51A1 enzymes were consistently expressed across all CRC stages (T1–T4) (Fig. 2; Table 1).
Profiling of head and neck cancer models
The analysis of head and neck squamous cell carcinoma (HNSCC) models revealed a diverse expression of CYP450 isoforms across various cell lines and tumour stages (Table 2). CYP1B1 was among the most abundant enzymes, exhibiting 14% sequence coverage and a high Mascot score of 282 in SCC9 cells. CYP2S1 was detected across multiple models, including A253, Detroit-562, and OSC-19, while CYP2W1 was strongly expressed in DOK cells with 21% sequence coverage and a Mascot score of 172 (Fig. 2; Table 2).
Table 2. Detection of CYP450 enzymes in human head and neck squamous cell carcinoma models: CYP450 enzymes were identified in HNSCC cell lines, xenografts, and patient biopsies (stages T1–T4)GeneAccessionProteinMW [kDa]HNSCC model typeCoverage [%]Total peptideUnique peptidesPSMsMascot scoreAverage abundances (log2)Expression levelCYP2A6P11509Cytochrome P450 2A656.5Detroit-56221123721.46LowFADU21123022.21LowCYP1B1Q16678Cytochrome P450 1B160.8Detroit-56273379124.99MediumSCC914531428226.04HighCYP2S1Q96SQ9Cytochrome P450 2S155.8A25321145122.26LowDetroit-562632810426.40HighDOK21122421.98LowOSC-1942243521.14LowT3, T473378824.58MediumCYP2U1Q7Z449Cytochrome P450 2U161.9OSC-1941122622.55LowCYP2W1Q8TAV3Cytochrome P450 2W153.8DOK21772117227.45HighCYP4F11Q9HBI6Phylloquinone omega-hydroxylase CYP4F1160.1Detroit-562522410325.44MediumDOK311312123.33MediumOSC-19833510724.14MediumCYP4F3Q08477Docosahexaenoic acid omega-hydroxylase CYP4F359.8T3, T49411528924.02MediumCYP4 × 1Q8N118Cytochrome P450 4 × 158.8Detroit-56231123525.26MediumDOK632713325.63HighCYP7B1O7588125-hydroxycholesterol 7-alpha-hydroxylase58.2OSC-1921122224.58MediumSCC931123219.82LowCYP20A1Q6UW02Cytochrome P450 20A152.4DOK10441124025.47HighSSC9722511118.81LowT2, T414551126924.74MediumCYP24A1Q079731,25-dihydroxyvitamin D(3) 24-hydroxylase, mitochondrial58.8Detroit-56217741526627.13HighFADU52236723.46MediumOSC-1938131057112629.71HighCYP26A1O43174Cytochrome P450 26A156.2OSC-1931121820.41LowCYP27A1Q02318Sterol 26-hydroxylase, mitochondrial60.2DOK3512124152728.72HighSCC91244106926.35HighT2, T353355923.56MediumCYP51A1Q16850Lanosterol 14-alpha demethylase56.8A25311441220425.27MediumDetroit-5629321022427.38HighDOK26882147026.51HighFADU1142941226.74HighOSC-191344910825.10MediumSCC917631521326.40HighT1, T43012124267125.33MediumThe table summarizes gene symbol, UniProt accession, protein name, MW (kDa), HNSCC model, sequence coverage, peptide counts, PSMs, Mascot score, log₂ abundance, and qualitative expression (Low, Medium, High). Data are based on in-gel digestion of 45–65 kDa bands (n = 3 replicates)
In HNSCC, CYP4F3 and CYP20A1 were extensively expressed in patient tissue biopsies from advanced stages (T2-T4), with CYP4F3 showing 9% coverage and a high Mascot score (289), and CYP20A1 exhibiting 14% coverage and a score of 269 (Table 2). CYP2S1 was significantly detected in T3 and T4 tumours, with a sequence coverage of 7% and a Mascot score of 88, while CYP20A1 was detected across pT2 and T4 tumours (Fig. 2; Table 2).
Profiling of breast and hepatic cancer models
The analysis of breast (MCF-7) and liver (HepG2) cancer models revealed distinct CYP450 expression profiles, highlighting differential metabolic enzymes (Table 3). In HepG2 cells, CYP1B1 was prominently expressed, with 8% sequence coverage and a Mascot score of 212 and CYP2W1 was also detected in HepG2, with 17% sequence coverage and a Mascot score of 77 (Table 3). In MCF-7 breast cancer cells, multiple CYP450 isoforms were identified, including CYP2A6, CYP2A13, and CYP2J2, albeit at lower sequence coverages ranging from 1% to 7% (Fig. 2; Table 3).
Table 3. Detection of CYP450 enzymes in human breast Cancer, hepatocellular carcinoma and control cell linesGeneAccessionProteinMW [kDa]Cell lines/XenograftsCoverage [%]Total peptideUnique peptidesPSMsMascot scoreAbundances (log2)Expression levelCYP1A1P04798Cytochrome P450 1A158.1CHO-1A122991731429.71High58.1CHO-1A1-Xeno5116164275032.48HighCYP1B1Q16678Cytochrome P450 1B160.8HepG28441021225.62HighCYP2A6P11509Cytochrome P450 2A656.5MCF-742222719.65LowCYP2A13Q16696Cytochrome P450 2A1356.7MCF-773367424.49MediumCYP2C9P11712Cytochrome P450 2C955.6MCF-711122921.32LowCYP2J2P51589Cytochrome P450 2J257.6MCF-742245525.94HighCYP2S1Q96SQ9Cytochrome P450 2S155.8HepG242262523.13MediumMCF-731126625.21MediumSW480-mock52252924.43MediumCYP2W1Q8TAV3Cytochrome P450 2W153.8HepG21754157727.15HighSW480-2W1311075466831.38HighCYP4F11Q9HBI6Phylloquinone omega-hydroxylase CYP4F1160.1HepG262246424.71MediumMCF-731126023.23MediumSW480-2W131122522.61LowCYP4F2P78329Phylloquinone omega-hydroxylase CYP4F259.8HepG211131421.32LowCYP4 × 1Q8N118Cytochrome P450 4 × 158.8HepG211551219827.86HighCYP20A1Q6UW02Cytochrome P450 20A152.4HepG21254119525.71HighMCF-783374522.25LowCYP24A1Q079731,25-dihydroxyvitamin D(3) 24-hydroxylase, mitochondrial58.8SW480-mock31134020.52LowCYP27A1Q02318Sterol 26-hydroxylase, mitochondrial60.2HepG222983041027.78HighMCF-71866118927.67HighCYP51A1Q16850Lanosterol 14-alpha demethylase56.8CHO-1A152249324.14MediumCHO-1A1-Xeno1355918928.54HighHepG217651527426.79HighMCF-7271183254928.75HighSW480-2W118651427826.47HighCYP450 enzymes were detected in breast cancer, hepatocellular carcinoma, and control cell lines. The table summarizes gene symbol, UniProt accession, protein name, MW (kDa), cell line or xenograft model, sequence coverage (%), total and unique peptide counts, PSMs, Mascot score, log₂-transformed abundance, and qualitative expression level (Low, Medium, High). Data were obtained from in-gel digestion of 45–65 kDa protein bands (n = 3 replicates)
Profiling of control CYP2W1 and CYP1A1 models
The analysis of CYP2W1 and CYP1A1 control cell lines provided further insights into their expression dynamics and functional significance (Table 3). CYP1A1 was highly abundant in CHO-1A1 transfected cells, with 22% sequence coverage and a Mascot score of 314, confirming strong detectability as would be expected (Table 4). CYP1A1 expression increased significantly in CHO-1A1 xenograft models, reaching 51% sequence coverage and a Mascot score of 750, suggesting enhanced enzyme stability or metabolic activity under in vivo conditions (Fig. 2; Table 3).
Table 4. Detection of CYP450 enzymes in mouse liver microsomeGeneAccessionProteinMW [kDa]Coverage (%)Total peptideUnique peptidesPSMsMascot scoreAbundances (log2)Expression levelCYP1A1P00184Cytochrome P450 1A159.238333055526.43HighCYP1A2P00186Cytochrome P450 1A258.2269970101927.26HighCYP2A4P15392Cytochrome P450 2A456.78245154209194823.42MediumCYP2A5P20852Cytochrome P450 2A556.74151176237242526.08HighCYP2A12P56593Cytochrome P450 2A1256.179481615169222927.57HighCYP2B9P12790Cytochrome P450 2B955.74113443729524.90MediumCYP2B10P12791Cytochrome P450 2B1056.744311514423.99MediumCYP2C29Q64458Cytochrome P450 2C2955.71634115146195126.79HighCYP2C37P56654Cytochrome P450 2C3755.60649165146166025.72HighCYP2C40P56657Cytochrome P450 2C4055.763229911198928.45HighCYP2C44E9Q5K4Cytochrome P450 2C4456.42224884578125.28MediumCYP2C50Q91 × 77Cytochrome P450 2C5055.845154221281726.06HighCYP2C54Q6XVG2Cytochrome P450 2C5455.85843167187220026.50HighCYP2C70Q91W64Cytochrome P450 2C7056.0222883235425.83HighCYP2D9P11714Cytochrome P450 2D956.9514523355223.57MediumCYP2D10P24456Cytochrome P450 2D1057.233602112413472830.02HighCYP2D11P24457Cytochrome P450 2D1156.9882391145138223.69MediumCYP2D26Q8CIM7Cytochrome P450 2D2656.976371311166186529.22HighCYP2E1Q05421Cytochrome P450 2E156.8053411119784328.25HighCYP2F2P33267Cytochrome P450 2F255.949481515209223529.27HighCYP2J5O54749Cytochrome P450 2J557.784154497123.28MediumCYP3A11Q64459Cytochrome P450 3A1157.855451261139426.07HighCYP3A13Q64464Cytochrome P450 3A1357.49218663244324.41MediumCYP3A16Q64481Cytochrome P450 3A1657.8713412819920.74LowCYP3A41Q9JMA7Cytochrome P450 3A4157.98724838388124.68MediumCYP4A10O88833Cytochrome P450 4A1058.3352245421.76LowCYP4A14O35728Cytochrome P450 4A1458.7252244823.01MediumCYP4F3Q99N16Cytochrome P450 4 F59.843422726823.14MediumCYP4F14Q9EP75Leukotriene-B4 omega-hydroxylase 359.8733932823.14MediumCYP17A1P27786Steroid 17-alpha-hydroxylase/17,20 lyase57.6381866179425.32MediumCYP27A1Q9DBG1Sterol 26-hydroxylase, mitochondrial60.72501515223177328.24HighCYP51A1Q8K0C4Lanosterol 14-alpha demethylase56.776176688722.31LowCYP450 enzymes were detected in mouse liver microsomes. The table summarizes gene symbol, UniProt accession, protein name, MW (kDa), sequence coverage (%), total and unique peptide counts, PSMs, Mascot score, log₂-transformed abundance, and qualitative expression level (Low, Medium, High). Data were obtained from in-gel digestion of 45–65 kDa protein bands (n = 3 replicates)
CYP2W1 was prominently expressed in SW480-2W1 cells, with 31% sequence coverage and a high Mascot score of 668, reinforcing its robust detection. In contrast, its expression was minimal in SW480-mock cells, where only low levels of CYP2S1 (5% coverage) and CYP24A1 (3% coverage) were observed, while CYP4F11 was identified in SW480-2W1, at a lower abundance (3% coverage, Mascot score 25) (Fig. 2; Table 3).
Profiling of mouse liver microsomes
Mouse liver CYP450 profiling was performed to allow comparison of the current strategy with the previous established platform employing GEL -MALDI-MS [10]. The GEL-LC-MS analysis of CYP450 proteins in mouse liver microsomes identified 32 CYP450 isoforms (Table 4), highlighting the diversity of CYP450 enzymes involved in hepatic metabolism. Among the identified proteins, CYP2D10 exhibited the highest sequence coverage (60%) and the highest Mascot score (4728), with 21 total peptides and 12 unique peptides. Other highly abundant CYP450 isoforms included CYP2A5 (51% coverage, Mascot score 2425) and CYP2C37 (49% coverage, Mascot score 1660), indicating their significant presence in the microsomal proteome (Table 4).
Several CYP2 family members, including CYP2A4, CYP2A12, CYP2C29, and CYP2C50, were also well represented with sequence coverages ranging from 34% to 48% and Mascot scores exceeding 1900 (Table 4). The CYP3A subfamily, critical for xenobiotic metabolism, was represented by CYP3A11, CYP3A13, and CYP3A16, with coverage values between 13% and 45%, and Mascot scores ranging from 199 to 1394. These isoforms are mouse homologs of human CYP3A4 and CYP3A5, which are the major hepatic CYP3A enzymes responsible for drug metabolism in humans. Given the high sequence similarity within the CYP3A subfamily (> 70–75% at the amino acid level), it is possible that antibodies raised against human CYP3A4 or CYP3A5 may cross-react with these murine orthologs. This underscores the importance of validating antibody specificity when interpreting immunodetection data across species or closely related isoforms. Lower-abundance CYPs, such as CYP4A10, CYP4A14, and CYP4F3, showed limited sequence coverage (4–5%) and low Mascot scores (< 300), suggesting either lower expression levels or reduced detectability in the microsomal fraction (Table 4). This may be due to their inherently low expression in the cancer models studied, limited solubility or stability in microsomal preparations, or fewer tryptic peptides suitable for MS detection.
Discussion
LC-MS has emerged as a powerful analytical technique for profiling CYP450 enzymes, particularly due to its ability to resolve complex protein mixtures and provide high-resolution data on sequence coverage and peptide identification [9, 10, 13]. One of the key advantages of LC-MS is its unmatched precision in distinguishing highly homologous CYP450 isoforms, which pose challenges for traditional antibody-based detection methods. Consequently, some CYP450 isoforms have not previously been unequivocally detected in their protein form due to the difficulty in generating specific assays and monoclonal antibodies. However, GEL-LC-MS overcomes this challenge by combining the high-resolution separation of gel electrophoresis with the precise peptide mass detection of LC-MS, enabling the differentiation of closely related isoforms [10]. While DIA or other advanced LC-MS approaches offer higher throughput, they often struggle to detect low-abundance CYP450 isoforms due to signal suppression by abundant proteins. The Gel-LC-MS approach enriches the 45–65 kDa fraction, enhancing isoform-specific detection and enabling reliable semi-quantitative comparisons across samples.
The analysis of CRC, head and neck squamous cell carcinoma (HNSCC), and breast cancer models revealed distinct CYP450 expression profiles, highlighting tissue-specific metabolic adaptations that reflect the unique biochemical demands and microenvironmental conditions of each cancer type [14, 15]. In CRC models, the predominant expression of CYP2W1, CYP2S1, CYP1B1, and CYP2J2 suggests their potential functional involvement in tumour metabolism, xenobiotic processing and disease progression [16–19]. CYP2W1, in particular, has been previously associated with CRC and is known for its ability to metabolize pro-carcinogens into active compounds [16, 19]. The presence of CYP3A5 across all CRC patient biopsy stages T1 to T4, suggests its role in xenobiotic metabolism, possibly influencing drug response in CRC patients [20].
In head and neck squamous cell carcinoma (HNSCC) models, CYP1B1 was among the most abundant enzyme in SCC9 cells. CYP1B1 is known to metabolize a wide range of xenobiotics and is often overexpressed in cancer, making it a potential biomarker for HNSCC and a target for selective inhibitors [21–23]. The presence of CYP2W1 in HNSCC further reinforces its potential functional role in cancerous cells, expanding its relevance beyond CRC [23], while CYP2S1 has been implicated in inflammatory responses [24], potentially contributing to the aggressive nature of HNSCC tumours. Breast cancer models, particularly MCF-7 cells, exhibited a different CYP450 profile, with CYP2J2, CYP2S1, CYP2A6 and CYP2A13 being the most prominent isoforms. CYP2J2 has been implicated in the metabolism of chemotherapeutic agents, raising the possibility that its expression could influence drug resistance and treatment response [25]. Differential expression of CYP450 isoforms across cancer types has potential clinical implications, as these enzymes modulate drug metabolism, efficacy and toxicity. For example, elevated CYP2W1 in CRC and HNSCC could inform prodrug activation strategies, while CYP1B1 overexpression in HNSCC may guide selective inhibitor development. Linking these expression patterns to potential drug metabolism enhances the translational relevance of our dataset and may inform personalized therapeutic strategies.
The study also highlighted the influence of xenograft and tissue microenvironments on CYP450 expression. For example, CYP1A1 expression increased significantly in CHO-1A1 xenograft models, reaching 51% sequence coverage compared to 22% coverage in transfected cells. This suggests that the in vivo tumour microenvironment may enhance CYP1A1 stability or metabolic activity, possibly due to stromal interactions or extracellular matrix remodelling [26]. Similarly, CYP4F3 and CYP20A1 were prominently expressed in advanced-stage HNSCC patient biopsies, indicating that the tumour microenvironment may upregulate these isoforms to support cancer progression. These findings underscore the importance of considering the tissue context when studying CYP450 expression and designing therapeutic interventions.
GEL-LC-MS provides a highly sensitive and effective approach for enriching specific protein subgroups that are often undetectable in conventional total proteomic analyses. Notably, a search of the PRIDE database (https://www.ebi.ac.uk/pride/) did not reveal any datasets reporting the detection of CYP2W1 and CYP2S1 in colon or head and neck cancer models, underscoring the novelty of our findings. To further contextualize our results, we compared our GEL-LC-MS dataset with publicly available ProteomicsDB data (https://www.proteomicsdb.org/). This comparison identified 17 CYP isoforms consistently detected across seven common models (HepG2, SCC9, DOK, HT55, MCF-7, DLD1, HCC2998). Importantly, we detected CYP isoforms with established roles in drug metabolism; CYP2W1, CYP2J2, and CYP1A1, expressed uniquely in additional cancer cell lines (A253, C106, COLO-205, Detroit-562, FADU, LS174T, OSC-19, SSC9), transfected lines (CHO-1A1, SW480-2W1, SW480-mock), and xenografts (DLD-1-Xeno, HT55-Xeno, CHO-1A1-Xeno), which have not been previously reported. These findings demonstrate the ability of GEL-LC-MS to uncover low-abundance, drug-metabolizing CYP isoforms that may be missed in standard shotgun proteomics. However, a limitation of this approach is reduced accuracy in absolute protein quantification, primarily due to variability in trypsin digestion and peptide extraction from gels. Overall, our results highlight the unique strength of GEL-LC-MS for comprehensive, isoform-specific CYP450 profiling, providing novel insights into cancer-associated metabolic pathways and potential drug metabolism targets.
Log₂-transformed abundances and categorical expression levels (Low, Medium, High) enabled semi-quantitative comparisons of CYP450 expression across cancer models. Differential expression patterns suggest tissue-specific metabolic adaptations and have potential implications for drug metabolism. For example, CYP2W1, highly expressed in CRC and HNSCC models, represents an attractive target for prodrug activation strategies [16, 27], whereas CYP1B1 overexpression in HNSCC may guide selective inhibitor development. Similarly, CYP2J2 and CYP2S1 expression in breast cancer models could influence drug metabolism and treatment response. These findings highlight how isoform-specific CYP450 profiling can inform personalized therapeutic strategies. Microsomal enrichment and GEL-LC-MS provided sensitive detection of low-abundance isoforms, while comparison with public datasets (PRIDE, ProteomicsDB) confirmed the novelty of key drug-metabolizing CYPs uniquely detected in our models.
Microsomal isolation is a critical step in achieving in-depth CYP450 profiling [28–30]. Microsomes, vesicles derived from the endoplasmic reticulum, are enriched with CYP450 enzymes and other drug-metabolizing enzymes. Isolating microsomes allows researchers to focus on the functional fraction of the proteome, thereby enhancing the detection of low-abundance CYP450 isoforms. For instance, this study identified low-abundance CYPs such as CYP4A10 and CYP4A14 in mouse liver microsomes, demonstrating the utility of microsomal enrichment in overcoming detection challenges associated with whole-cell lysates. CYP450 profiles generated by GEL-LC-MS compared favourably with the previously established GEL-MALDI-MS strategy [10], with 22 CYP450 isoforms being common between the two approaches. Notably, CYP2C39, CYP3A25, and CYP8B1 were detected exclusively by GEL-LC-MS, while CYP17A1, CYP1A1, CYP2B10, CYP2C44, CYP2D11, CYP3A16, CYP4A10, CYP4F3, and CYP51A1 were only observed with GEL-MALDI-MS. These differences underscore the complementary nature of these techniques and their potential for comprehensive CYP profiling.
This study offers valuable insights into CYP450 expression across cancer models but has limitations. While GEL-LC-MS is effective for detecting specific isoforms, its sensitivity remains constrained by the dynamic range of protein expression, potentially leading to the omission of very low-abundance CYP450 enzymes. Targeted proteomic approaches, such as parallel reaction monitoring (PRM) or multiple reaction monitoring (MRM), could further enhance sensitivity and quantification accuracy. Additionally, this study focused on protein expression without assessing enzymatic activity, which is critical for functional relevance. The influence of post-translational modifications (PTMs), as well as genetic and epigenetic factors affecting CYP450 regulation, were not explored. Future studies incorporating activity assays, PTM analysis, and transcriptomic integration will provide a more comprehensive understanding of CYP450 function in cancer progression and drug metabolism.
Conclusion
This study demonstrates the effectiveness of GEL-LC-MS for profiling CYP450 enzymes across diverse cancer models and mouse liver microsomes, enabling detection of low-abundance isoforms often missed by conventional approaches. Distinct CYP450 expression patterns reveal metabolic heterogeneity and identify potential therapeutic targets. Differential CYP450 expression can influence drug efficacy, toxicity, pharmacokinetics, and resistance, underscoring the value of these findings for personalized treatment strategies. Xenograft and tissue microenvironments further modulate CYP450 expression, highlighting the importance of biological context. Future studies should focus on functional validation, measurement of enzymatic activity, targeted proteomics (PRM/MRM), and integration of transcriptomic and post-translational modification analyses to enhance the translational relevance of CYP450 profiling.