CYP2C9 polymorphism is associated with susceptibility to ischemic stroke in a Chinese population
Jinglu Zhang, Haiyu Jia, Yun Liu, Yong Zhang, Haihong Nie, Qiuhong Bao

TL;DR
A genetic variant in CYP2C9 is linked to a higher risk of ischemic stroke in a Chinese population.
Contribution
This study identifies a specific CYP2C9 polymorphism associated with increased ischemic stroke susceptibility in the Chinese Han population.
Findings
The CYP2C9 rs10509679 G>A polymorphism is associated with increased ischemic stroke risk (OR=1.48).
The association is significant in subgroups like those over 60 years old, non-diabetic individuals, and smokers.
A specific haplotype of CYP2C9 polymorphisms is linked to elevated ischemic stroke risk.
Abstract
Ischemic stroke (IS) is a global cerebrovascular disease with high morbidity and mortality. CYP2C9 genetic variants are significantly involved in the development of many diseases. However, the impacts that CYP2C9 genetic variants on the risk of IS remain to be comprehensively understood. We aim to determine the association of CYP2C9 with IS susceptibility in the Chinese Han population. This study recruited a total of 643 patients with IS and 643 healthy controls. CYP2C9 single-nucleotide polymorphisms (SNPs) were tested by the MassARRAY iPLEX platform. The associations of CYP2C9 polymorphisms (rs10509679, rs1934967, rs1934968, and rs9332220) and IS risk were analysed by the logistic regression analysis. Our study showed that rs10509679 G > A was significantly related to increased risk of IS (OR= 1.48, 95% CI= 1.05–2.09, p = 0.024). The stratified analysis further demonstrated that…
Genes, proteins, chemicals, diseases, species, mutations and cell lines named across the full text — each resolved to its canonical identifier and authoritative record.
Click any figure to enlarge with its caption.
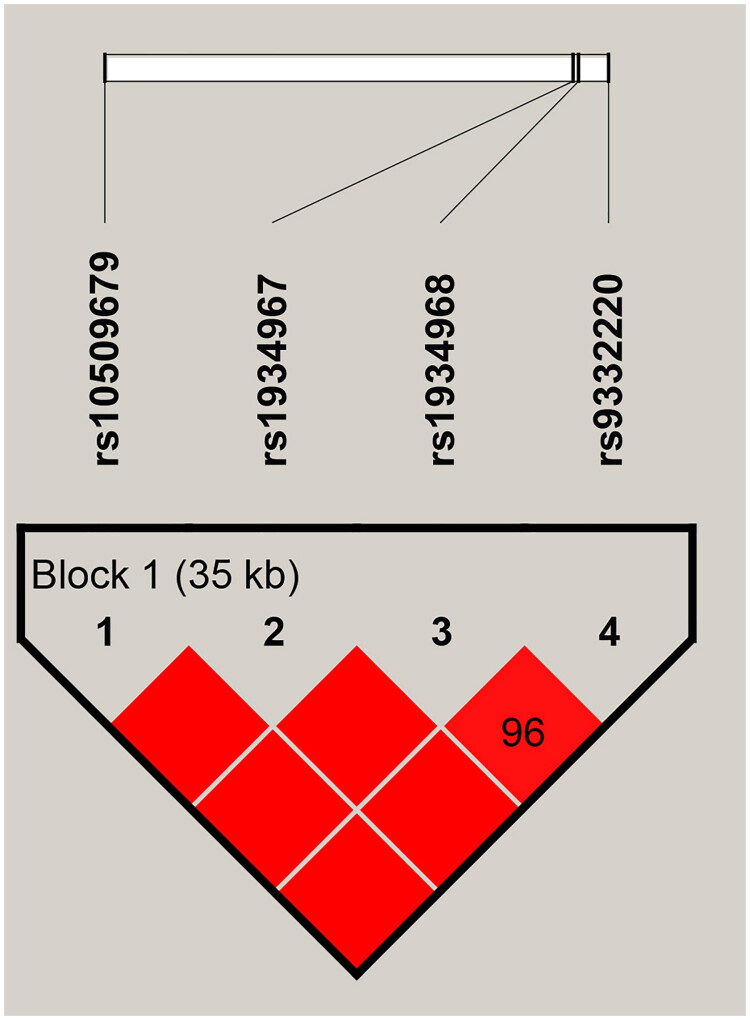 Figure 1
| Variables | Case group ( | Control group ( |
|
|---|---|---|---|
| Sexa | 0.859 | ||
| Men | 427 (66.4%) | 430 (66.9%) | |
| women | 216 (33.6%) | 213 (33.1%) | |
| Age, years (mean ± SD)b | 63.57 ± 9.92 | 60.69 ± 6.03 | < 0.001 |
| > 60 | 411 (63.9%) | 335 (52.1%) | |
| ≤ 60 | 232 (36.1%) | 308 (47.9%) | |
| Smokinga | 0.577 | ||
| Yes | 322 (50.1%) | 312 (48.5%) | |
| No | 321 (49.9%) | 331 (51.5%) | |
| Drinkinga | 0.823 | ||
| Yes | 328 (51.0%) | 324 (50.4%) | |
| No | 315 (49.0%) | 319 (49.6%) | |
| BMI (kg/m2)a | 0.200 | ||
| ≥ 24 | 217 (33.7%) | 239 (37.2%) | |
| < 24 | 426 (66.3%) | 404 (62.8%) | |
| Hypertension | |||
| No | 199 (30.9%) | 643 | |
| Yes | 444 (69.1%) | 0 | |
| Diabetes | |||
| Yes | 110 (17.1%) | 0 | |
| No | 533 (82.9%) | 643 |
| SNP ID | Chromosome position | Role | Alleles | MAF | HaploReg v4.2 | ||
|---|---|---|---|---|---|---|---|
| Case | Control | ||||||
| rs10509679 | Chr10: 94948469 | intron | A/G | 0.321 | 0.282 | 0.845 | Motifs changed, GRASP QTL hits, Selected eQTL hits |
| rs1934967 | Chr10: 94981669 | intron | T/C | 0.161 | 0.170 | 0.889 | Selected eQTL hits |
| rs1934968 | Chr10: 94982060 | intron | A/G | 0.392 | 0.413 | 0.935 | Motifs changed |
| rs9332220 | Chr10: 94984186 | intron | A/G | 0.094 | 0.096 | 0.645 | Enhancer histone marks, Motifs changed, Selected eQTL hits |
| SNP ID | Model | Genotype | Case N | Control N | Without adjusted | With adjusted | |||
|---|---|---|---|---|---|---|---|---|---|
| OR (95% CI) |
| OR (95% CI) |
| ||||||
| rs10509679 | Allele | G (Ref.) | 869 | 918 | 1 (Ref.) | ||||
| A | 411 | 360 |
|
| / | / | 0.120 | ||
| Codominant | G/G (Ref.) | 287 | 331 | 1 (Ref.) | 1 (Ref.) | ||||
| G/A | 295 | 256 |
|
|
|
| 0.135 | ||
| A/A | 58 | 52 | 1.29 (0.86–1.93) | 0.225 | 1.53 (0.84–2.79) | 0.166 | 0.663 | ||
| Dominant | G/G (Ref.) | 287 | 331 | 1 (Ref.) | 1 (Ref.) | ||||
| G/A-A/A | 189 | 176 |
|
|
|
| 0.095 | ||
| Recessive | G/G-G/A (Ref.) | 582 | 587 | 1 (Ref.) | 1 (Ref.) | ||||
| A/A | 58 | 52 | 1.13 (0.76–1.66) | 0.556 | 1.27 (0.72–2.25) | 0.414 | 0.827 | ||
| Log-additive | – | – | – |
|
|
|
| 0.827 | |
| rs1934967 | Allele | C (Ref.) | 1079 | 1064 | 1 (Ref.) | ||||
| A | 207 | 218 | 0.94 (0.76–1.15) | 0.536 | / | / | 0.714 | ||
| Codominant | C/C (Ref.) | 454 | 442 | 1 (Ref.) | 1 (Ref.) | ||||
| C/A | 171 | 180 | 0.92 (0.72–1.18) | 0.535 | 0.89 (0.61–1.31) | 0.568 | 1.136 | ||
| A/A | 18 | 19 | 0.92 (0.48–1.78) | 0.810 | 0.81 (0.27–2.45) | 0.711 | 0.711 | ||
| Dominant | C/C (Ref.) | 454 | 442 | 1 (Ref.) | 1 (Ref.) | ||||
| C/A-A/A | 189 | 199 | 0.92 (0.73–1.17) | 0.519 | 0.89 (0.61–1.29) | 0.527 | 0.702 | ||
| Recessive | C/C-C/A (Ref.) | 625 | 622 | 1 (Ref.) | 1 (Ref.) | ||||
| A/A | 18 | 19 | 0.94 (0.49–1.81) | 0.860 | 0.84 (0.28–2.51) | 0.753 | 0.753 | ||
| Log-additive | – | – | – | 0.94 (0.76–1.15) | 0.538 | 0.90 (0.64–1.25) | 0.514 | 0.753 | |
| rs1934968 | Allele | A (Ref.) | 782 | 749 | 1 (Ref.) | ||||
| C | 504 | 527 | 0.92(0.78–1.07) | 0.276 | / | / | 0.553 | ||
| Codominant | A/A (Ref.) | 241 | 219 | 1 (Ref.) | 1 (Ref.) | ||||
| A/C | 300 | 311 | 0.88 (0.69–1.12) | 0.286 | 0.93 (0.64–1.34) | 0.682 | 0.909 | ||
| C/C | 102 | 108 | 0.86 (0.62–1.19) | 0.359 | 0.77 (0.46–1.29) | 0.320 | 0.639 | ||
| Dominant | A/A (Ref.) | 241 | 219 | 1 (Ref.) | 1 (Ref.) | ||||
| A/C-C/C | 402 | 419 | 0.87 (0.69–1.10) | 0.239 | 0.88 (0.62–1.26) | 0.493 | 0.986 | ||
| Recessive | A/A-A/C (Ref.) | 541 | 530 | 1 (Ref.) | 1 (Ref.) | ||||
| C/C | 102 | 108 | 0.93 (0.69–1.24) | 0.607 | 0.80 (0.50–1.29) | 0.365 | 1.462 | ||
| Log-additive | – | – | – | 0.92 (0.78–1.07) | 0.278 | 0.89 (0.69–1.13) | 0.339 | 1.462 | |
| rs9332220 | Allele | T (Ref.) | 1163 | 278 | 1 (Ref.) | ||||
| A | 121 | 264 | 0.98(0.76–1.28) | 0.903 | / | / | 0.903 | ||
| Codominant | T/T (Ref.) | 1163 | 278 | 1 (Ref.) | 1 (Ref.) | ||||
| T/A | 121 | 264 | 1.06 (0.80–1.42) | 0.687 | 0.91 (0.57–1.45) | 0.704 | 0.704 | ||
| A/A | 524 | 527 | 0.43 (0.11–1.68) | 0.225 | 0.50 (0.06–4.13) | 0.520 | 0.694 | ||
| Dominant | T/T (Ref.) | 115 | 109 | 1 (Ref.) | 1 (Ref.) | ||||
| T/A-A/A | 3 | 7 | 1.02 (0.77–1.36) | 0.875 | 0.89 (0.56–1.40) | 0.608 | 0.608 | ||
| Recessive | T/T-T/A (Ref.) | 524 | 527 | 1 (Ref.) | 1 (Ref.) | ||||
| A/A | 118 | 116 | 0.43 (0.11–1.66) | 0.219 | 0.51 (0.06–4.18) | 0.529 | 0.705 | ||
| Log-additive | – | – | – | 0.98 (0.75–1.28) | 0.902 | 0.87 (0.57–1.33) | 0.531 | 0.705 | |
| Allele/Genotype | Without adjusted | With adjusted | Without adjusted | With adjusted | |||||||
|---|---|---|---|---|---|---|---|---|---|---|---|
| OR (95% CI) |
| OR (95% CI) |
| OR (95% CI) |
| OR (95% CI) |
| ||||
|
|
| ||||||||||
| G (Ref.) | 1 (Ref.) | 1 (Ref.) | |||||||||
| A |
|
| / | / | 0.109 | 1.11 (0.86–1.45) | 0.419 |
|
| 0.839 | |
| GG (Ref.) | 1 (Ref.) | 1 (Ref.) | 1 (Ref.) | 1 (Ref.) | |||||||
| AG |
|
|
|
| 0.167 | 1.16 (0.81–1.65) | 0.429 | 1.36 (0.75–2.46) | 0.314 | 1.223 | 0.82 |
| AA | 1.34 (0.79–2.28) | 0.276 | 1.51 (0.70–3.24) | 0.297 | 1.188 | 1.20 (0.63–2.28) | 0.582 | 1.50 (0.55–4.14) | 0.429 | 1.382 | |
| GG (Ref.) | 1 (Ref.) | 1 (Ref.) | 1 (Ref.) | 1 (Ref.) | |||||||
| AG-AA |
|
|
|
| 0.150 | 1.16 (0.82–1.64) | 0.391 | 1.38 (0.78–2.44) | 0.268 | 1.053 | 0.67 |
| GG-AG (Ref.) | 1 (Ref.) | 1 (Ref.) | 1 (Ref.) | 1 (Ref.) | |||||||
| AA | 1.11 (0.67–1.85) | 0.684 | 1.21 (0.58–2.51) | 0.616 | 1.232 | 1.12 (0.60–2.08) | 0.725 | 1.29 (0.49–3.38) | 0.603 | 1.744 | 0.78 |
|
|
| ||||||||||
| G (Ref.) | 1 (Ref.) | 1 (Ref.) | |||||||||
| A | 1.12 (0.91–1.38) | 0.273 | / | / | 1.091 |
|
| / | / | 0.106 | |
| GG (Ref.) | 1 (Ref.) | 1 (Ref.) | 1 (Ref.) | 1 (Ref.) | |||||||
| AG | 1.20 (0.90–1.58) | 0.213 | 1.44 (0.93–2.25) | 0.105 | 0.420 |
|
| 1.47 (0.79–2.70) | 0.221 | 0.442 | 0.99 |
| AA | 1.17 (0.71–1.93) | 0.548 | 1.43 (0.68–3.03) | 0.344 | 1.378 | 1.55 (0.78–3.11) | 0.214 | 1.54 (0.55–4.28) | 0.412 | 0.825 | |
| GG (Ref.) | 1 (Ref.) | 1 (Ref.) | 1 (Ref.) | 1 (Ref.) | |||||||
| AG-AA | 1.19 (0.91–1.56) | 0.203 | 1.44 (0.94–2.21) | 0.092 | 0.367 |
|
| 1.48 (0.83–2.65) | 0.188 | 0.377 | 0.91 |
| GG-AG (Ref.) | 1 (Ref.) | 1 (Ref.) | 1 (Ref.) | 1 (Ref.) | |||||||
| AA | 1.07 (0.66–1.74) | 0.781 | 1.19 (0.59–2.42) | 0.627 | 1.255 | 1.24 (0.63–2.41) | 0.536 | 1.29 (0.48–3.45) | 0.610 | 1.220 | 0.94 |
|
|
| ||||||||||
| G (Ref.) | 1 (Ref.) | 1 (Ref.) | |||||||||
| A |
|
| / | / | 0.064 | 1.07 (0.81–1.42) | 0.625 |
|
| 2.500 | |
| GG (Ref.) | 1 (Ref.) | 1 (Ref.) | 1 (Ref.) | 1 (Ref.) | |||||||
| GA |
|
| 1.48 (0.96–2.28) | 0.075 | 0.300 | 1.28 (0.87–1.89) | 0.215 | 1.43 (0.75–2.72) | 0.278 | 1.110 | 0.70 |
| AA | 1.66 (0.96–2.86) | 0.068 | 1.90 (0.89–4.06) | 0.098 | 0.392 | 0.94 (0.50–1.77) | 0.859 | 1.29 (0.47–3.55) | 0.629 | 1.258 | |
| GG (Ref.) | 1 (Ref.) | 1 (Ref.) | 1 (Ref.) | 1 (Ref.) | |||||||
| GA-AA |
|
|
|
| 0.165 | 1.20 (0.83–1.74) | 0.323 | 1.40 (0.76–2.58) | 0.283 | 1.132 | 0.72 |
| GG-GA (Ref.) | 1 (Ref.) | 1 (Ref.) | 1 (Ref.) | 1 (Ref.) | |||||||
| AA | 1.44 (0.85–2.44) | 0.177 | 1.58 (0.76–3.26) | 0.221 | 0.462 | 0.84 (0.46–1.54) | 0.574 | 1.08 (0.41–2.83) | 0.873 | 1.350 | 0.40 |
| Allele/Genotype | Without adjusted | With adjusted | Without adjusted | With adjusted | |||||||
|---|---|---|---|---|---|---|---|---|---|---|---|
| OR (95% CI) |
| OR (95% CI) |
| OR (95% CI) |
| OR (95% CI) |
| ||||
|
|
| ||||||||||
| G (Ref.) | 1 (Ref.) | 1 (Ref.) | |||||||||
| A |
|
| / | / |
| 1.07 (0.84–1.35) | 0.603 |
|
| 2.412 | |
| GG (Ref.) | 1 (Ref.) | 1 (Ref.) | 1 (Ref.) | 1 (Ref.) | |||||||
| AG |
|
|
|
| 0.120 | 1.13 (0.82–1.55) | 0.472 | 1.24 (0.76–2.04) | 0.394 | 1.574 | 0.36 |
| AA | 1.55 (0.88–2.71) | 0.129 | 2.22 (0.91–4.90) | 0.428 | 1.256 | 1.05 (0.58–1.90) | 0.867 | 0.94 (0.36–2.46) | 0.902 | 0.902 | |
| GG (Ref.) | 1 (Ref.) | 1 (Ref.) | 1 (Ref.) | 1 (Ref.) | |||||||
| AG-AA |
|
|
|
|
| 1.11 (0.82–1.52) | 0.494 | 1.19 (0.74–1.93) | 0.471 | 1.882 | 0.21 |
| GG-AG (Ref.) | 1 (Ref.) | 1 (Ref.) | 1 (Ref.) | 1 (Ref.) | |||||||
| AA | 1.25 (0.73–2.14) | 0.422 | 1.70 (0.81–3.57) | 0.164 | 0.656 | 0.99 (0.56–1.76) | 0.984 | 0.85 (0.34–2.15) | 0.727 | 0.727 | 0.29 |
|
|
| ||||||||||
| G (Ref.) | 1 (Ref.) | 1 (Ref.) | |||||||||
| A |
|
| / | / |
| 1.07 (0.84–1.36) | 0.564 | / | / | 0.752 | |
| GG (Ref.) | 1 (Ref.) | 1 (Ref.) | 1 (Ref.) | 1 (Ref.) | |||||||
| AG |
|
|
|
| 0.089 | 1.09 (0.78–1.51) | 0.625 | 1.22 (0.72–2.05) | 0.465 | 0.930 | 0.59 |
| AA | 1.45 (0.81–2.58) | 0.210 | 1.81 (0.80–4.10) | 0.154 | 0.308 | 1.14 (0.64–2.02) | 0.652 | 1.28 (0.53–3.11) | 0.588 | 2.353 | |
| GG (Ref.) | 1 (Ref.) | 1 (Ref.) | 1 (Ref.) | 1 (Ref.) | |||||||
| AG-AA |
|
|
|
| 0.064 | 1.09 (0.80–1.50) | 0.572 | 1.23 (0.74–2.02) | 0.424 | 0.849 | 0.30 |
| GG-AG (Ref.) | 1 (Ref.) | 1 (Ref.) | 1 (Ref.) | 1 (Ref.) | |||||||
| AA | 1.16 (0.66–2.02) | 0.611 | 1.38 (0.63–3.00) | 0.417 | 0.834 | 1.10 (0.63–1.90) | 0.742 | 1.16 (0.50–2.72) | 0.727 | 2.908 | 0.78 |
|
|
| ||||||||||
| G (Ref.) | 1 (Ref.) | 1 (Ref.) | |||||||||
| A | 0.93 (0.68–1.29) | 0.680 |
|
| 2.720 |
|
|
|
|
| |
| GG (Ref.) | 1 (Ref.) | 1 (Ref.) | 1 (Ref.) | 1 (Ref.) | |||||||
| GA | 1.00 (0.66–1.53) | 0.988 | 1.73 (0.72–4.15) | 0.217 | 0.870 |
|
|
|
| 0.135 | NA |
| AA | 0.77 (0.33–1.77) | 0.537 | 0.68 (0.08–5.54) | 0.722 | 1.444 | 1.42 (0.93–2.16) | 0.105 | 1.53 (0.84–2.79) | 0.166 | 0.663 | |
| GG (Ref.) | 1 (Ref.) | 1 (Ref.) | 1 (Ref.) | 1 (Ref.) | |||||||
| GA-AA | 0.96 (0.64–1.45) | 0.857 | 1.55 (0.66–3.65) | 0.317 | 1.267 |
|
|
|
| 0.095 | NA |
| GG-GA (Ref.) | 1 (Ref.) | 1 (Ref.) | 1 (Ref.) | 1 (Ref.) | |||||||
| AA | 0.77 (0.34–1.74) | 0.525 | 0.52 (0.07–4.02) | 0.535 | 2.138 | 1.20 (0.80–1.80) | 0.373 | 1.27 (0.72–2.25) | 0.414 | 0.827 | 1.00 |
| Haplotypes | OR (95% CI) |
|
|---|---|---|
| Grs10509679Crs1934967Ars1934968Grs9332220 | 1 (reference) | |
| Ars10509679Crs1934967Grs1934968Grs9332220 |
|
|
| Grs10509679Trs1934967Grs1934968Grs9332220 | 0.99 (0.80–1.24) | 0.960 |
| Grs10509679Crs1934967Grs1934968Ars9332220 | 1.06 (0.80–1.41) | 0.670 |
| Grs10509679Crs1934967Grs1934968Grs9332220 | 0.95 (0.61–1.49) | 0.830 |
- —Health Science and Technology Program of Inner Mongolia Autonomous Region
- —Education and teaching reform project of Inner Mongolia Medical University
Peer Reviews
No public reviews on file for this paper yet. If you reviewed it on a platform where reviews are public (OpenReview, ICLR, NeurIPS, ICML), you can paste yours below so the community can read it here.
Videos
No videos yet. Explain this paper in a talk, walkthrough, or lecture? Add one.
Taxonomy
TopicsEicosanoids and Hypertension Pharmacology · Pharmacogenetics and Drug Metabolism · Antiplatelet Therapy and Cardiovascular Diseases
Introduction
Ischemic stroke (IS), commonly known as cerebral infarction, is a cerebrovascular disease caused by ischemia and hypoxia in local brain tissue due to cerebral vascular occlusion, which leads to brain cell death [1]. The main clinical features of IS are sudden local neurological dysfunction, such as limb weakness, slurred speech, facial deviation, etc [2]. The aetiology of IS is very complicated, including atherosclerosis, cardiogenic embolism, and vasculitis, with atherosclerosis being the most common cause [3]. Previous studies have demonstrated that some risk factors (like smoking, drinking, diabetes, obesity, hypertension, and hyperlipidaemia) can significantly increase the risk of IS [3,4]. Recently, it has been shown that genetic factors strongly contribute to the progress of IS. For example, some genetic variants may affect blood coagulation mechanisms and increase the risk of thrombosis [5,6]. Besides, genetic factors may also indirectly increase the risk of stroke by affecting blood pressure, blood lipids, and other physiological indicators [7,8]. Moreover, Deng et al. have demonstrated that ERCC1 rs3212986 polymorphism is related to increased IS risk [9]. Wang et al. showed that NQO1 rs2917673 was a risk factor for IS [10]. IS is extremely harmful, which not only leads to a serious decline in patients’ quality of life but also results in long-term disability and even death. Therefore, an in-depth exploration of the role of genetic factors in IS will not only help to reveal the pathogenesis of the disease but also give a scientific basis for the development of targeted gene therapy strategies, thereby offering patients more effective treatment options.
Cytochrome P450 2C9 (CYP2C9), the human cytochrome P450 enzyme family member, has a key role in various biochemical processes such as drug metabolism, hormone synthesis, and cholesterol synthesis [11]. CYP2C9 is mainly expressed in the liver and plays a key role in the metabolism of various drugs, including non-steroidal anti-inflammatory drugs, anticoagulants, and antiepileptic drugs. CYP2C9 influences the activity of antithrombotic medications such as warfarin and clopidogrel via metabolic activation. Genetic polymorphisms reduce enzymatic activity, leading to abnormal drug metabolism and increased risks of thrombosis or haemorrhage [12–15]. Additionally, CYP2C9 polymorphisms are associated with enhanced vulnerability of atherosclerotic plaques and elevated risk of embolic stroke, potentially mediated by disrupted eicosanoid metabolism that exacerbates vascular inflammation and endothelial dysfunction [16,17]. Furthermore, CYP2C9 activity is regulated by Nrf2, which indirectly modulates stroke risk during antithrombotic therapy through its influence on atrial fibrosis [18]. CYP2C9 polymorphism is involved in many diseases’ occurrence and progression. Research showed that certain variants in the CYP2C9 gene can accelerate the susceptibility of cardiovascular disease [12]. Cullell et al. reported the CYP2C9 genetic polymorphisms may influence the metabolism of warfarin, thereby affecting its efficacy and the risk of bleeding [19]. Furthermore, multiple studies have suggested that CYP2C9 may play a potential role in stroke susceptibility. For instance, a study conducted by Peng et al. in 2025 found that the CYP2C9 rs2860905 variant significantly increased the risk of IS in the Taiwanese population [20]. Additionally, another study by Peng et al. demonstrated that the CYP2C9 rs4918758 variant significantly influenced the risk of IS in Taiwanese males [21]. In mainland China, research on the association between CYP2C9 genetic polymorphisms and IS remains relatively limited, and comprehensive studies clarifying this relationship are still lacking. However, some studies have begun to explore the distribution of CYP2C9 genetic polymorphisms across different regions of China and their impact on drug response. For example, a 2025 study found regional differences in the frequency of CYP2C9*2 and 3 alleles in Chinese populations, with these polymorphisms being closely associated with warfarin dose requirement [22]. From a global perspective, research on CYP2C9 genetic polymorphisms indicates significant differences in their distribution across various ethnic and racial groups. For instance, the CYP2C92 and *3 alleles are more prevalent in European and Middle Eastern populations but relatively rare in East Asian and sub-Saharan African populations [22]. The impact of these polymorphisms on drug metabolism also varies among populations, underscoring the importance of conducting studies in diverse populations to advance the goals of precision medicine.
Thus, we conducted this case-control study to determine the association between CYP2C9 polymorphisms with IS risk in a Chinese Han population. The study cohort comprised 643 IS patients and 643 healthy controls. Four candidate SNPs (rs10509679, rs1934967, rs1934968, and rs9332220) were selected as tag-SNPs based on the following criteria: minor allele frequency (MAF) >5% in CHB from the 1000 Genomes Project, min genotype > 75%, r^2^ < 0.8, and Hardy-Weinberg equilibrium (HWE) p-value > 0.05, and call rate >95%.
Methods
Study subjects
The sample size was determined using G*Power software (version 3.1.9.7). The calculation process proceeded as follows: First, we selected the t-test as the statistical method and specified the analysis type for ‘Difference between two independent means (two groups)’. Subsequently, parameters were configured with these settings: two-tailed test (tail = 2), effect size d = 0.2, significance level α = 0.05, statistical power (1-β) = 0.9475, and allocation ratio N2/N1 = 1. The calculation yielded a required sample size of 643 participants for both the case group and the control group. This research was approved by the ethics committee of the Affiliated Hospital of Inner Mongolia Medical University and all experiments were carried out following the principles of the 1964 Declaration of Helsinki. All participants were informed and signed a written informed consent form. In this project, we recruited 1286 unrelated adult subjects consisting of 643 IS patients and 643 healthy controls from the Affiliated Hospital of Inner Mongolia Medical University. The patients were newly diagnosed and confirmed as IS by two experienced neurologists based on clinical symptoms, physical examination, magnetic resonance imaging (MRI), and/or cranial computed tomography according to the diagnostic criteria for stroke [23]. The exclusion criteria for cases were: (1) age≤ 18 years old. (2) patients with a history of stroke. (3) patients with transient ischaemic attack and haemorrhagic stroke. (4) patients with cerebral vascular malformation. (5) patients with brain tumours. (6) patients with any type of disease, including cardiac, neurological, and autoimmune diseases. Controls were selected from healthy individuals who had a physical examination at the same hospital during the same period. Controls were matched to patients by gender. Individuals with hypertension and diabetes (including current and prior diagnoses) were excluded based on medical record review and structured health questionnaires. Additionally, participants with a family history of neurological or brain disorders were excluded. Demographic characteristics and environmental exposures, such as smoking and drinking status, for all participants were collected through medical records and health questionnaires.
Polymorphism selection and genotyping
The selection criteria of the four CYP2C9 gene SNPs (rs10509679, rs1934967, rs1934968, and rs9332220) were as follows: First, we extracted CYP2C9 variants from the human GRCh37 reference genome (chromosome 10: 94,938,658-94,990,091) using VCF to PED Converter, obtaining 249 SNPs from the Chinese Han in Beijing (CHB) population. Subsequently, Haploview software was applied for quality control and tag-SNP selection, with thresholds set as minor allele frequency (MAF) > 0.05, min genotype > 75%, r^2^ < 0.8, and Hardy-Weinberg equilibrium (HWE) p-value > 0.05. Additionally, SNPs with call rates below 95% were excluded. The finalized SNPs were retained for analysis. Genomic DNA was extracted from peripheral blood samples of each participant using a Gold Purification Kit. Genotyping was performed using Agena MassARRAY iPLEX platform under the protocols of the manufacturer. Besides, the data of genotyping was analyzed using Agena Bioscience TYPER software.
Bioinformatic analysis
The potential functions of each SNP were predicted through HaploReg V4.2 online software (https://pubs.broadinstitute.org/mammals/haploreg/haploreg.php).
Statistical analyses
Fisher’s exact test was used to evaluate the Hardy–Weinberg equilibrium (HWE) of these SNPs in the controls. The associations between CYP2C9 polymorphisms and IS risk were assessed using logistic regression analysis under five genetic models (allele, codominant, dominant, recessive, and log-additive), with adjustments for age, hypertension, and diabetes. Besides, we also investigated the associations stratified by age, sex, BMI, smoking, drinking, hypertension, and diabetes. The relative risk of IS was calculated by using adjusted odds ratios (ORs) and 95% confidence intervals (CIs). The genetic models are defined as follows (with A representing the wild-type allele and B the mutant allele): Allelic model: B allele vs. A allele (reference allele: A). Codominant model: BB vs. AA and AB vs. AA (reference group: AA). Dominant model: AB/BB vs. AA (reference group: AA). Recessive model: BB vs. AA/AB (reference group: AA/AB). Log-additive model: Trend effect per additional B allele (comparison: AA vs. AB vs. BB). The Benjamini–Hochberg false discovery rate (FDR) method was used to control for multiple testing. The false-positive report probability (FPRP) was carried out to validate the significant findings. Furthermore, Linkage disequilibrium (LD) was analyzed using Haploview V4.2 software, and haplotype analyses were conducted using the SNPStats online tool. Statistical analyses were conducted by SPSS 22.0 software. The chi-square test was used to detect the statistical difference of discrete variables, such as sex, drinking, and smoking status between the two groups. The difference in age between age and controls was compared by student’s t-test. The significance level was set at p < 0.05.
Results
Demographic characteristics
The clinical features are shown in Table 1. Our study included 643 patients with IS (427 men and 216 women) and 643 (430 men and 213 women) healthy controls. No significant difference was found in age between the cases and controls (p < 0.001). In terms of sex, BMI, drinking, and smoking status, no significant differences were observed (all p > 0.05).
Association between CYP2C9 polymorphisms and is susceptibility
In this study, we detected four SNPs (rs10509679, rs1934967, rs1934968, and rs9332220) in the CYP2C9 gene. Table 2 exhibited detailed information on the SNPs. The genotype distributions of these SNPs followed HWE in the controls (p = 0.845, p = 0.889, p = 0.935, and p = 0.645, respectively). The association of these SNPs with IS risk was analysed by logistic regression analysis, as depicted in Table 3. We found that rs10509679 was associated with an increased susceptibility to IS (A Vs G: OR= 1.21, 95% CI= 1.02–1.43, p = 0.030, p (FDR)= 0.120; GA Vs GG: OR= 1.47, 95% CI= 1.03–2.11, p = 0.034, p (FDR)= 0.135; GA-AA Vs GG: OR= 1.48, 95% CI= 1.05–1.70, p = 0.024, p (FDR)= 0.095).
Stratification analysis of significant SNPs
We further assessed the relationship between CYP2C9 polymorphisms and the risk of IS stratified by age, sex, BMI, smoking, drinking, and diabetes. As shown in Table 4, our study revealed that rs10509679 was significantly related to IS risk among individuals aged> 60 years (OR= 1.23, 95% CI= 1.03–1.61, p = 0.027, p (FDR)= 0.109; GA Vs GG: OR= 1.61, 95% CI= 1.02–2.53, p = 0.042, p (FDR)= 0.167; AG-AA Vs GG: OR= 1.59, 95% CI= 1.03–2.45, p = 0.037, p (FDR)= 0.150), women (OR= 1.40, 95% CI= 1.04–1.88, p = 0.027, p (FDR)= 0.106), and BMI< 24 (OR= 1.30, 95% CI= 1.05–1.61, p = 0.016, p (FDR)= 0.064; AG-AA Vs GG: OR= 1.54, 95% CI= 1.02–2.33, p = 0.041, p (FDR)= 0.165). Furthermore, rs10509679 showed an increased risk for IS patients in the subgroups of smokers (OR= 1.37, 95% CI= 1.08–1.74, p = 0.011, p (FDR)= 0.043; GA Vs GG: OR= 1.77, 95% CI= 1.06–2.96, p = 0.030, p (FDR)= 0.120; AG-AA Vs GG: OR= 1.85, 95% CI= 1.14–3.02, p = 0.013, p (FDR)= 0.045), drinkers (OR= 1.36, 95% CI= 1.07–1.72, p = 0.013, p (FDR)= 0.049; GA Vs GG: OR= 1.77, 95% CI= 1.09–2.89, p = 0.022, p (FDR)= 0.089; AG-AA Vs GG: OR= 1.78, 95% CI= 1.11–2.84, p = 0.016, p (FDR)= 0.064), and individuals without diabetes (OR= 1.27, 95% CI= 1.06–1.51, p = 0.008, p (FDR)= 0.034; GA Vs GG: OR= 1.47, 95% CI= 1.03–2.11, p = 0.034, p (FDR)= 0.135; AG-AA Vs GG: OR= 1.48, 95% CI= 1.05–2.09, p = 0.024, p (FDR)=) (Table 5).
Haplotype analysis
We used Haploview software to analyze linkage disequilibrium (LD) in CYP2C9 variants. A strong LD block spanning 35 kb was identified, encompassing rs10509679, rs1934967, rs1934968, and rs9332220 (Figure 1). Additionally, we performed a haplotype analysis to assess the combined effects of four CYP2C9 SNPs. As shown in Table 6, the A_rs10509679_C_rs1934967_G_rs1934968_G_rs9332220_ haplotype was significantly associated with an increased risk of IS compared to the reference haplotype G_rs10509679_C_rs1934967_A_rs1934968_G_rs9332220_ (OR= 1.21, 95% CI: 1.00–1.46, p = 0.045).
Haplotype Block Map of SNPs in CYP2C9.The numbers inside the diamonds indicate the pairwise D’.
FPRP result
We set the FPRP threshold at 0.2. As indicated in Table S1, the positive results for the rs10509679 remained noteworthy in the whole group and subgroups at the prior probability of 0.25 (FPRP< 0.2).
Discussion
Stroke is a global cerebrovascular disease with high morbidity and mortality. Approximately 1.5 million people die from stroke each year in China, and 2.5 million new cases have been reported [24]. Stroke is mainly divided into IS and haemorrhagic stroke, and IS accounts for 87% of stroke cases [25]. The pathogenesis of IS involves multiple factors, including traditional risk factors and genetic factors [26,27]. CYP2C9 plays an important role in IS progression. However, the impact of CYP2C9 polymorphisms on IS susceptibility is unclear. Thus, this study explored the association of CYP2C9 polymorphisms with IS risk. Our study demonstrated that rs10509679 polymorphism is related to an increased risk of IS. These findings may serve as potential genetic markers for IS risk assessment, facilitating early diagnosis, personalized treatment, and the development of prevention strategies for IS.
In this study, we observed that CYP2C9 rs10509679 was significantly associated with an increased risk of IS. However, Zhang et al. did not find a significant correlation between rs10509679 and lung cancer [28], which may be attributed to differences in genetic background, sample size, or disease heterogeneity across study populations. Age, sex, BMI, smoking, drinking, and diabetes were risk factors in the development of IS [29–31]. To further explore the relationship between CYP2C9 polymorphism and IS susceptibility, we conducted a stratified analysis based on age, sex, BMI, smoking, drinking, and diabetes. Our study revealed that the association between rs10509679 and IS risk was more pronounced in subgroups of individuals aged> 60 years, those with BMI< 24, smokers, drinkers, and those without diabetes. These findings suggest that the impact of the CYP2C9 rs10509679 polymorphism on IS risk may be modulated by environmental and clinical factors such as age, BMI, smoking, alcohol consumption, and diabetes. The result of the stratified analysis suggest that gene-environment interactions may play a crucial role in the occurrence of IS. For instance, individuals aged> 60 years may experience a heightened impact of CYP2C9 polymorphism on IS risk due to exacerbated metabolic dysfunction or increased oxidative stress. Individuals with a BMI< 24 may have lower levels of inflammation, which makes the potential impact of CYP2C9 polymorphisms on endothelial function more pronounced. Additionally, smoking and alcohol consumption may further enhance the susceptibility to IS risk by increasing oxidative stress and inflammatory responses, amplifying the effect of CYP2C9 polymorphisms. The absence of diabetes may reflect the regulatory role of metabolic status on CYP2C9 function, which warrants further investigation.
It is noteworthy that other studies also support the role of gene–environment interactions in IS risk. For example, Liu et al. showed that miR-122 rs17669 was associated with risk of IS in non-drinker and men [32]. Additionally, CYP4F2 rs2108622 exhibited a significant association in those aged> 60 years, those with BMI≥ 24, smokers, and drinkers [33]. Additionally, Huang et al. demonstrated that CYP19A1 rs28757157 and rs3751591 polymorphisms conferred an increased susceptibility to IS in individuals aged> 60 years, drinkers, and smokers [34]. Besides, it was found that CDH13 rs7193788 had higher risks for IS in patients with diabetes [35]. Taken above, we hypothesize that genetic susceptibility to IS may be regulated by age, sex, BMI, smoking, drinking, and diabetes, highlighting the significance of considering individual heterogeneity when exploring the relationship of genetic factors with IS risk. Future studies should further investigate how these factors regulate the genetic susceptibility to IS and consider the impact of environmental factors.
The rs10509679 polymorphism resides within an intron of CYP2C9. Although there have been no specific studies on the function of rs10509679 polymorphism, existing studies show that genetic variation within introns can affect gene expression through changing splice sites or affecting mRNA stability [36–38]. Here, we predicted the potential functions of rs10509679 through bioinformatic analysis. We found that rs10509679 was involved in the regulation of Selected eQTL hits, Motifs changed, and GRASP QTL hits. Future studies will verify the functional effects of rs10509679 on the CYP2C9 gene expression and explore their association with IS risk.
This study has certain limitations, First, the study individuals were restricted to the Han population, which limits the generalizability of our findings to other ethnic groups. Further studies will include more diverse ethnic groups to improve the generalizability of the findings. Second, to more fully understand the functional significance of the CYP2C9 polymorphisms, further studies is needed to validate the biological relevance of the findings through functional experiments.
Conclusion
In summary, our study demonstrated that CYP2C9 rs10509679 polymorphism may be associated with a higher risk of IS in the Chinese population. These findings contribute to our deeper understanding of how genetic variation influences IS risk.
Supplementary Material
supplemental_tables.docx
The reference list from the paper itself. Each links out to its DOI / PubMed record.
- 1Feske SK. Ischemic stroke. Am J Med. 2021;134(12):1457–1464. doi:10.1016/j.amjmed.2021.07.027.34454905 · doi ↗ · pubmed ↗
- 2Herpich F, Rincon F. Management of acute ischemic stroke. Crit Care Med. 2020;48(11):1654–1663. doi:10.1097/ccm.0000000000004597.32947473 PMC 7540624 · doi ↗ · pubmed ↗
- 3Marto JP, Strambo D, Livio F, et al. Drugs associated with ischemic stroke: a review for clinicians. Stroke. 2021;52(10):e 646–e 659. doi:10.1161/strokeaha.120.033272.34404236 · doi ↗ · pubmed ↗
- 4Gabet A, Guenancia C, Duloquin G, et al. Ischemic stroke with atrial fibrillation: characteristics and time trends 2006 to 2017 in the Dijon Stroke Registry. Stroke. 2021;52(6):2077–2085. doi:10.1161/strokeaha.120.030812.33874745 · doi ↗ · pubmed ↗
- 5Ekkert A, Šliachtenko A, Grigaitė J, et al. Ischemic stroke genetics: what is new and how to apply it in clinical practice? Genes (Basel). 2021;13(1):48. doi:10.3390/genes 13010048.35052389 PMC 8775228 · doi ↗ · pubmed ↗
- 6Marston NA, Patel PN, Kamanu FK, et al. Clinical application of a novel genetic risk score for ischemic stroke in patients with cardiometabolic disease. Circulation. 2021;143(5):470–478. doi:10.1161/circulationaha.120.051927.33185476 PMC 7856243 · doi ↗ · pubmed ↗
- 7Linden AB, Clarke R, Hammami I, et al. Genetic associations of adult height with risk of cardioembolic and other subtypes of ischemic stroke: a mendelian randomization study in multiple ancestries. P Lo S Med. 2022;19(4):e 1003967. doi:10.1371/journal.pmed.1003967.35452448 PMC 9032370 · doi ↗ · pubmed ↗
- 8Kim Y, Hwang S, Sharp SJ, et al. Genetic risk, muscle strength, and incident stroke: findings from the UK Biobank Study. Mayo Clin Proc. 2021;96(7):1746–1757. doi:10.1016/j.mayocp.2021.01.034.34218855 · doi ↗ · pubmed ↗