Dynamic data visualizations as events: effects of framing and change salience on segmenting dynamic maps
Reena Pauly, Stephan Schwan

TL;DR
This study explores how people segment dynamic data visualizations into events, showing that perceptual and conceptual factors influence their understanding of trends in animated maps.
Contribution
The study introduces a novel framework for analyzing how framing and change salience affect event segmentation in dynamic data visualizations.
Findings
Inter-individual segmentation agreement in dynamic maps occurs above chance and is influenced by the direction of the trend.
A three-way interaction between trend, framing, and salience significantly affects segmentation agreement in high-salience conditions.
Segmentation agreement is higher for negative trends when population decline is salient and framed as endangered.
Abstract
Event segmentation theory, which explores how individuals divide continuous experiences into discrete events, has been extensively studied in naturalistic stimuli. We investigate whether key findings generalize to animated data visualizations, specifically dynamic thematic maps. Experiment 1 showed that inter-individual segmentation agreement in dynamic maps occurs above chance levels and is influenced by the direction of the depicted trend. Experiments 2 and 3 build on these findings by systematically varying the depicted trend in maps showing population changes of fictional insect species. In addition, we examined how conceptual (framing of the species as endangered or invasive) and perceptual factors (salience of directional change) interact to shape segmentation agreement. In Experiment 2, salience was manipulated using different color scales: Saturation-based scales as the…
Genes, proteins, chemicals, diseases, species, mutations and cell lines named across the full text — each resolved to its canonical identifier and authoritative record.
Click any figure to enlarge with its caption.
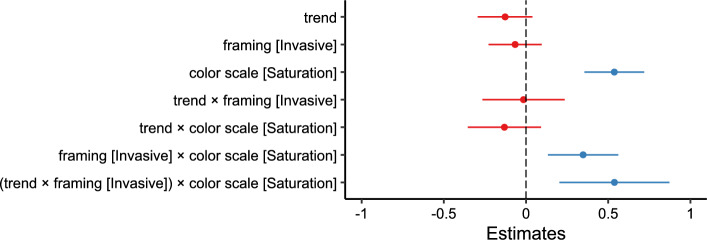 Figure 10
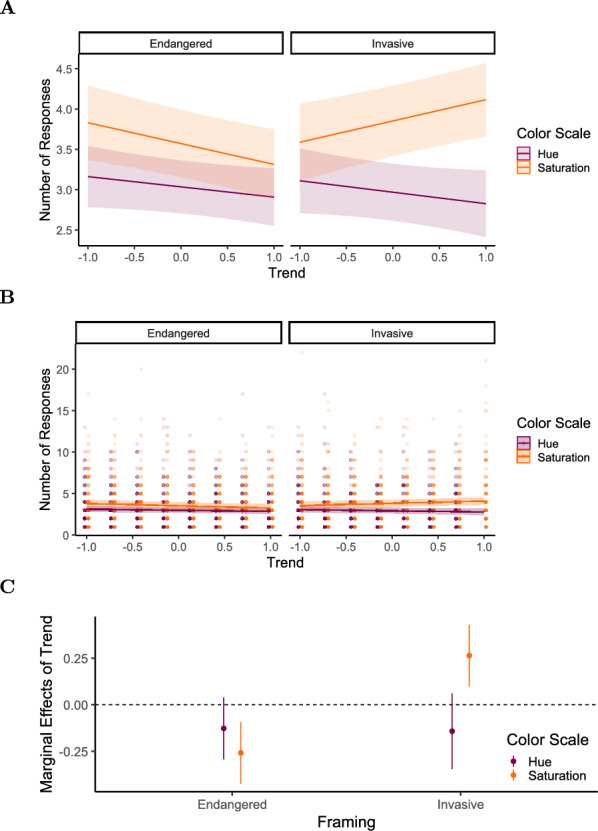 Figure 11
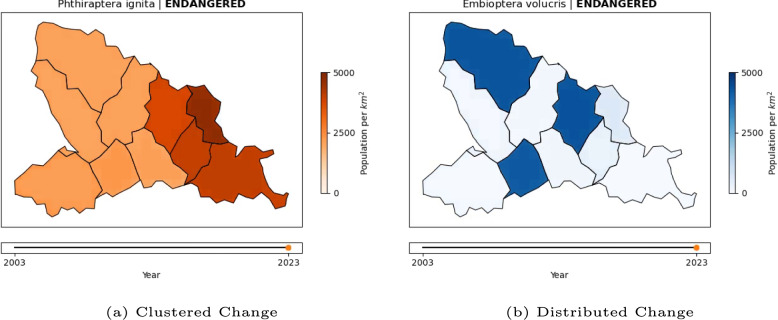 Figure 12
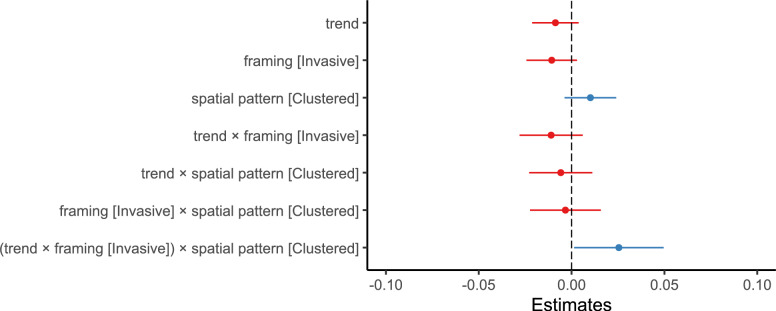 Figure 13
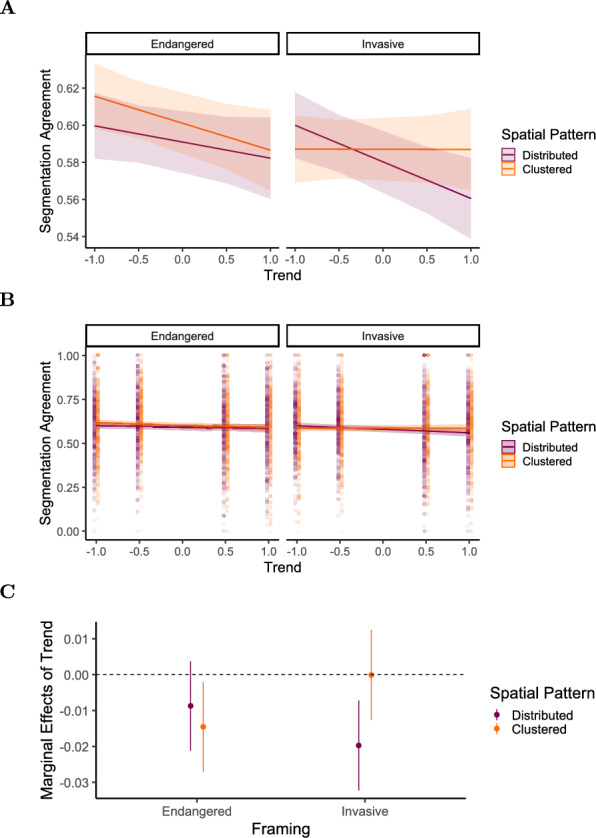 Figure 14
 Figure 15
 Figure 16
 Figure 1
 Figure 2
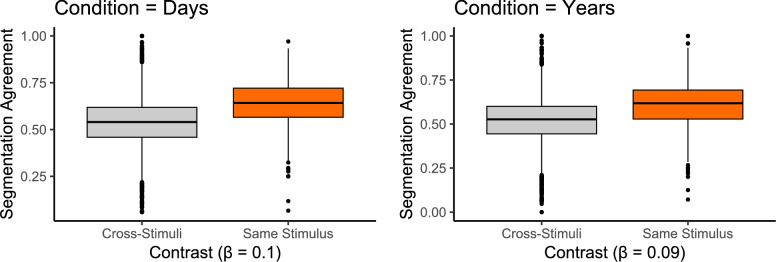 Figure 3
 Figure 4
 Figure 5
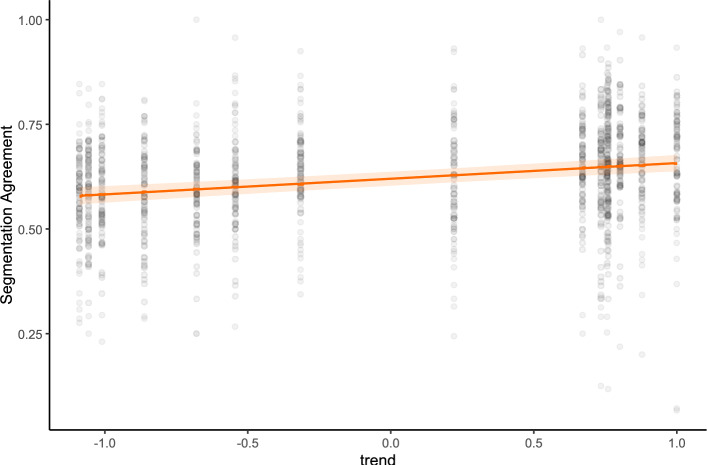 Figure 6
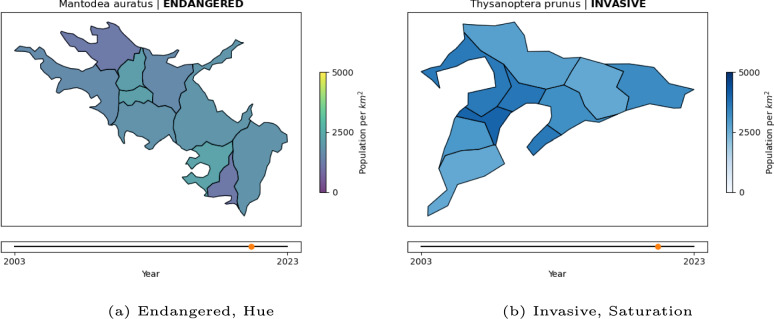 Figure 7
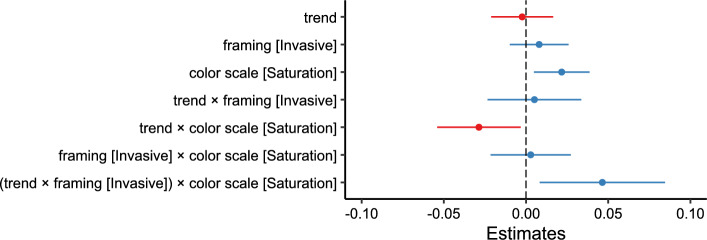 Figure 8
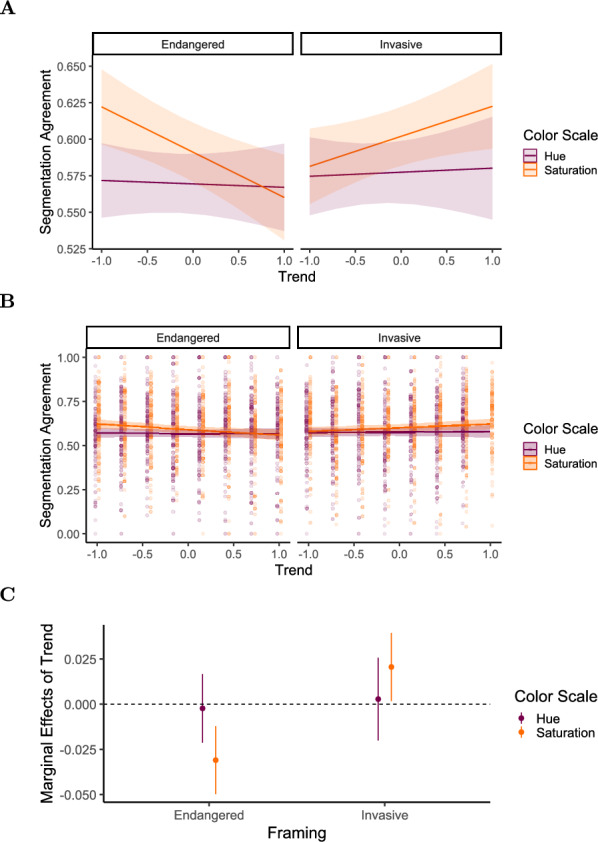 Figure 9
Peer Reviews
No public reviews on file for this paper yet. If you reviewed it on a platform where reviews are public (OpenReview, ICLR, NeurIPS, ICML), you can paste yours below so the community can read it here.
Videos
No videos yet. Explain this paper in a talk, walkthrough, or lecture? Add one.
Taxonomy
TopicsData Visualization and Analytics · Visual perception and processing mechanisms · Animal Behavior and Reproduction