Advanced Dimensionality Reduction for Imaging Mass Spectrometry of Human Eye Tissue through Low-Rank Modeling with Sparse and Dense Residuals
Roger A. R. Moens, Lukasz G. Migas, David M. G. Anderson, Jeffrey D. Messinger, Olga S. Ovchinnikova, Richard M. Caprioli, Christine A. Curcio, Kevin L. Schey, Jeffrey M. Spraggins, Raf Van de Plas

TL;DR
This paper introduces new dimensionality reduction methods for imaging mass spectrometry data of human eye tissue, improving data compression and analysis.
Contribution
The paper proposes low-rank models with sparse and dense residuals for better IMS data compression and signal preservation.
Findings
PCP and SPCP outperform PCA in dimensionality reduction and data compression for IMS.
The methods reduce signal overestimation while preserving spatially sparse features in eye tissue data.
Results are demonstrated on MALDI Q-TOF IMS measurements of human cornea and retina.
Abstract
Imaging mass spectrometry (IMS) yields high-dimensional and large data sets commonly exceeding 100,000 pixels, each reporting a mass spectrum of 200,000 intensity values or more. Reducing the dimensionality and size of IMS data is often necessary to enable downstream analysis, and matrix-factorization-based approaches are often used for this purpose. However, the model underlying most of these techniques, decomposing measurements into the sum of a low-rank term (presumed signal) and a small entry-wise residual term (presumed noise), is often not optimal for IMS. For example, while spatially or spectrally sparse signals are common in IMS data, they can heavily distort the low-rank approximation. Therefore, we propose capturing the IMS data structure using low-rank models that, in addition to a dense residual, allow for sparse variation to be captured separately. We implement two such…
Genes, proteins, chemicals, diseases, species, mutations and cell lines named across the full text — each resolved to its canonical identifier and authoritative record.
Click any figure to enlarge with its caption.
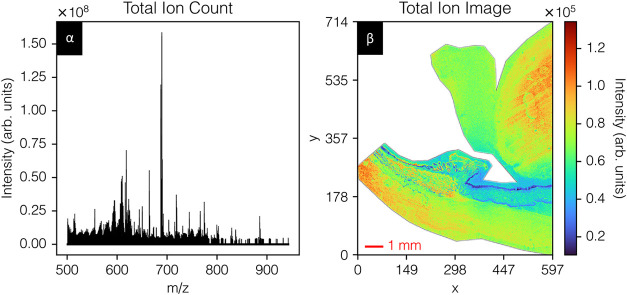 Figure 1
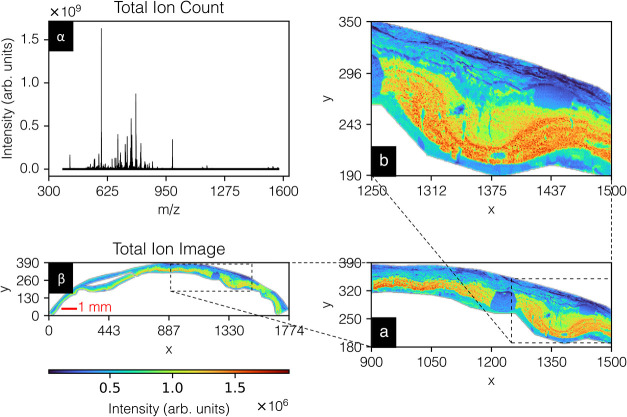 Figure 2
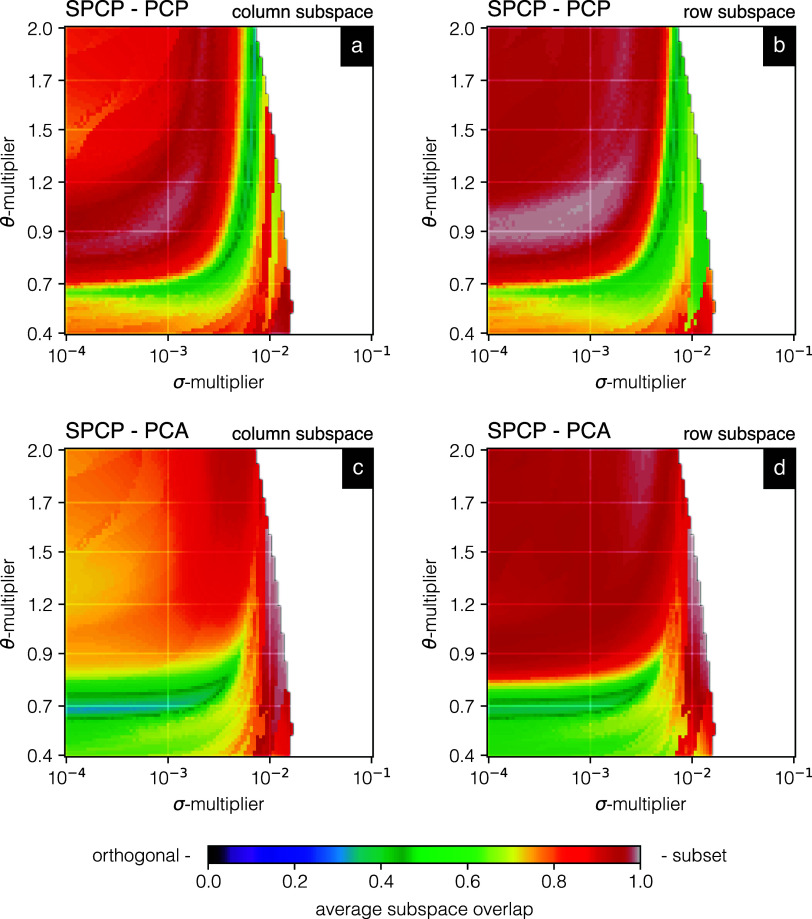 Figure 3
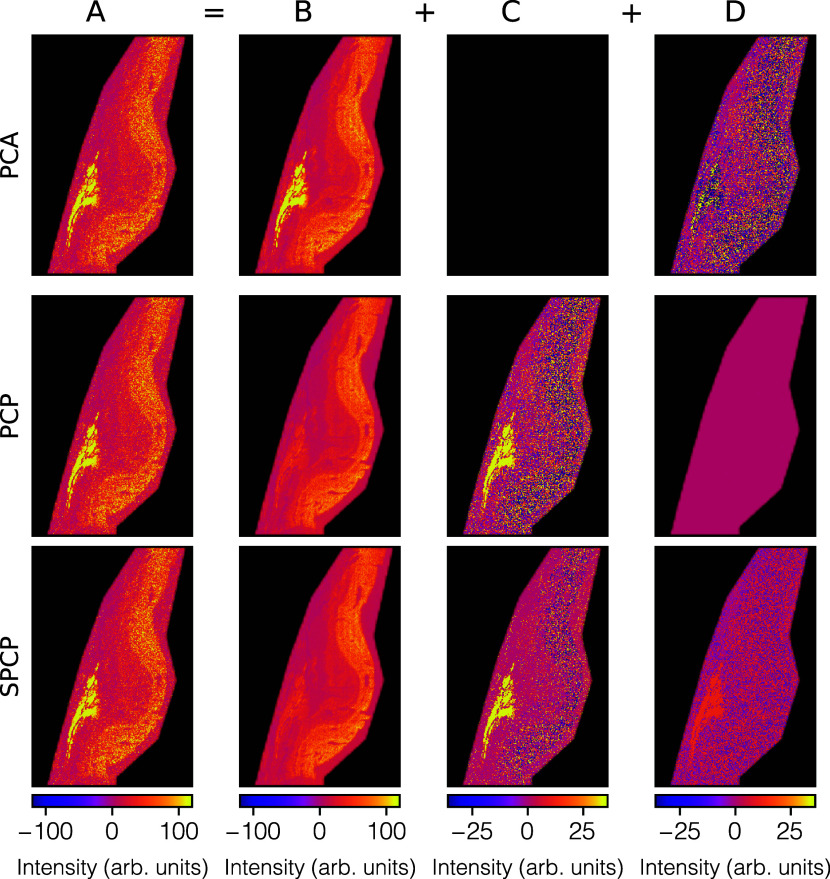 Figure 4
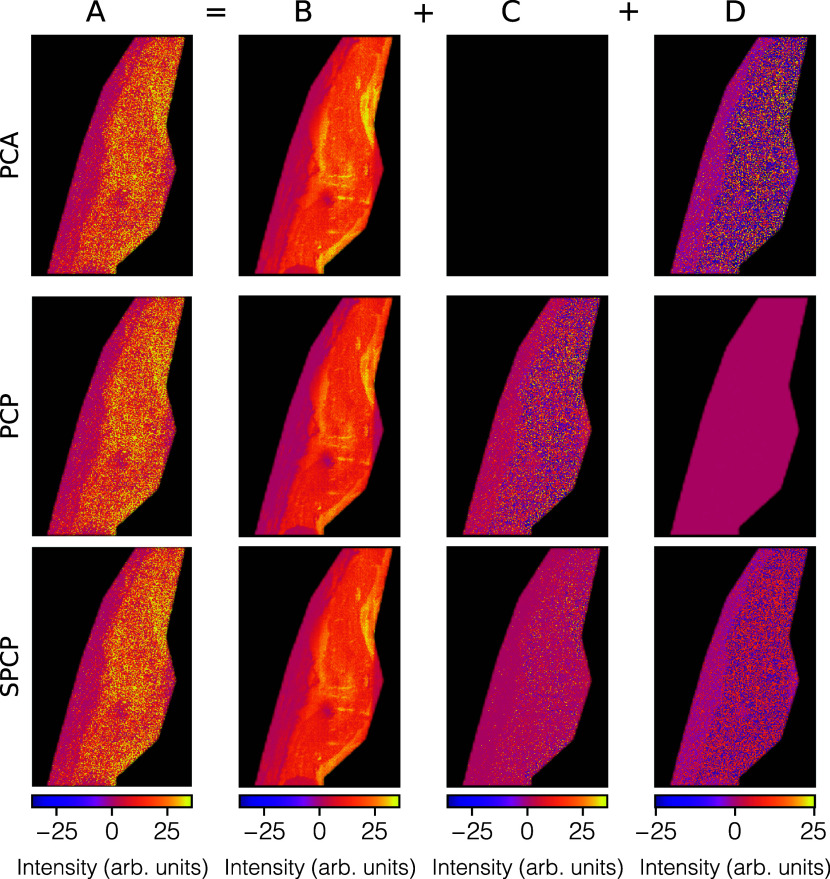 Figure 5
 Figure 6
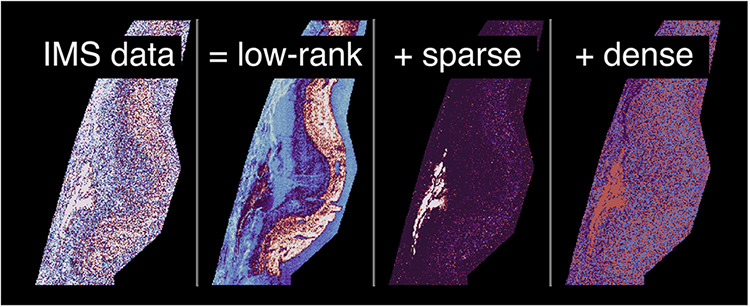 Figure 7
 Figure 8
 Figure 9
 Figure 10
 Figure 11
 Figure 12
 Figure 13
 Figure 14
 Figure 15
 Figure 16
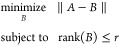 Figure 17
 Figure 18
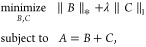 Figure 19
 Figure 20
 Figure 21
 Figure 22
 Figure 23
 Figure 24
 Figure 25
 Figure 26
 Figure 27
 Figure 28
 Figure 29
 Figure 30
 Figure 31
 Figure 32
 Figure 33
 Figure 34
Peer Reviews
No public reviews on file for this paper yet. If you reviewed it on a platform where reviews are public (OpenReview, ICLR, NeurIPS, ICML), you can paste yours below so the community can read it here.
Videos
No videos yet. Explain this paper in a talk, walkthrough, or lecture? Add one.
Taxonomy
TopicsMass Spectrometry Techniques and Applications · Metabolomics and Mass Spectrometry Studies · Molecular spectroscopy and chirality