Seeing Through the Mimicry of Papilio bootes by Combining Computer‐Aided and Human Eyesight Morphological Comparisons
Yuan‐Rui‐Xue Xie, Zhi‐Xing Ding, Adam M. Cotton, Zhen‐Bang Xu, Yue Pan, Yi‐Ting Lin, Shao‐Ji Hu

TL;DR
The study explores how different subspecies of the Tailed Redbreast butterfly mimic local Byasa species in China, revealing patterns of mimicry and evolutionary implications.
Contribution
The study provides the first quantitative analysis of Batesian mimicry in Papilio bootes subspecies and their relationship with Byasa species.
Findings
Western P. bootes subspecies mimic four-spotted Byasa species, while northeastern ones mimic spotless ones.
B. polyeuctes acts as a morphological bridge between four-spotted and spotless Byasa species.
The four-spotted trait in P. bootes is likely ancestral, with spotless traits evolving later.
Abstract
The Tailed Redbreast Papilio bootes exhibits a tendency for specific mimicry of sympatric Byasa species across its distribution range, but this phenomenon has not yet been quantitatively analysed. To address this intriguing example of Batesian mimicry, the present study focused on three provinces (Yunnan, Sichuan, and Shaanxi) in West China, which have high taxonomic diversity of both P. bootes and Byasa. We combined computer‐aided and human eyesight morphological comparisons to reveal the visual similarity between five subspecies of P. bootes and 13 species of Byasa. Our findings demonstrate that the subspecies mindoni and parcesquamata of P. bootes in the western part of its range primarily mimic Byasa species with four hindwing white spots ( B. latreillei , B. polla and B. genestieri), while the black subspecies nigricauda and dealbatus in the northeastern part of the range…
Genes, proteins, chemicals, diseases, species, mutations and cell lines named across the full text — each resolved to its canonical identifier and authoritative record.
Click any figure to enlarge with its caption.
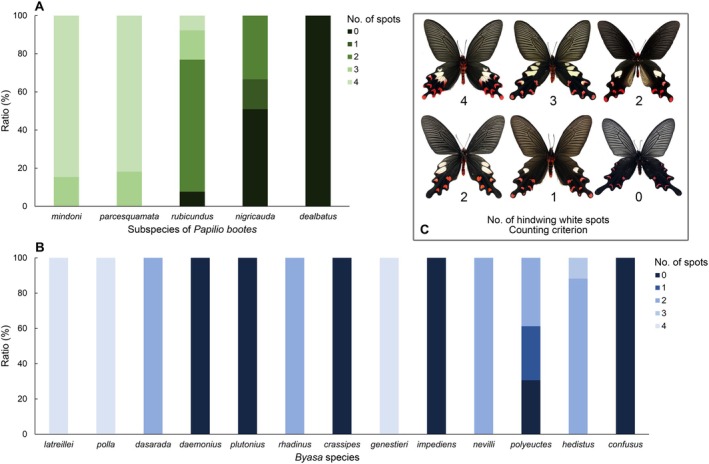 FIGURE 1
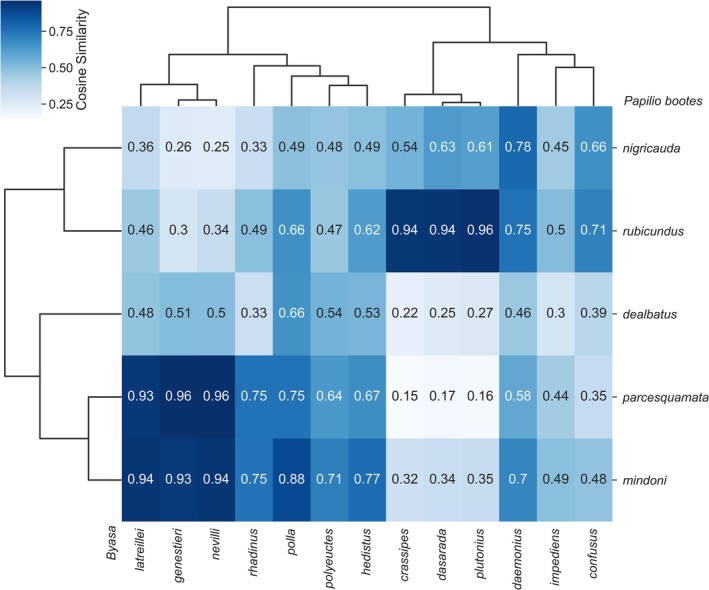 FIGURE 2
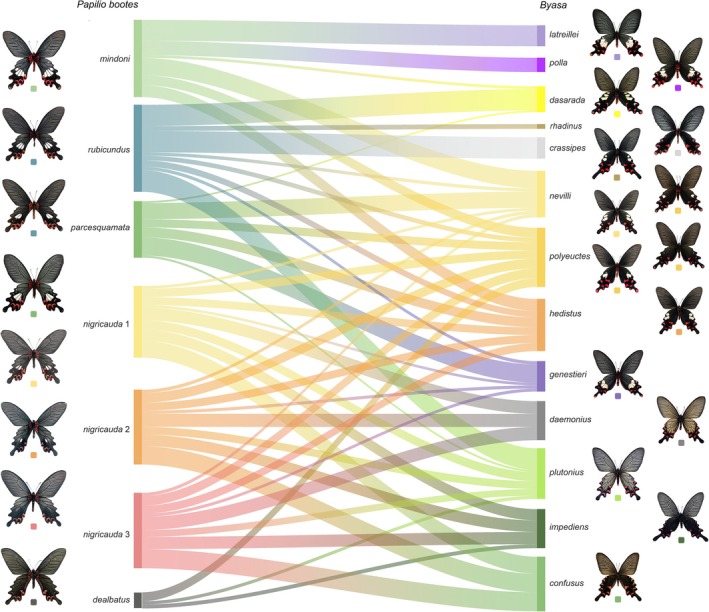 FIGURE 3
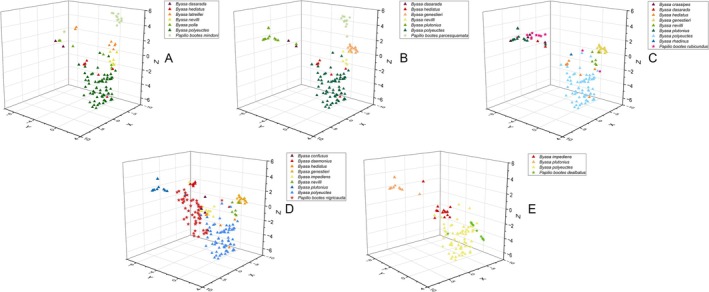 FIGURE 4
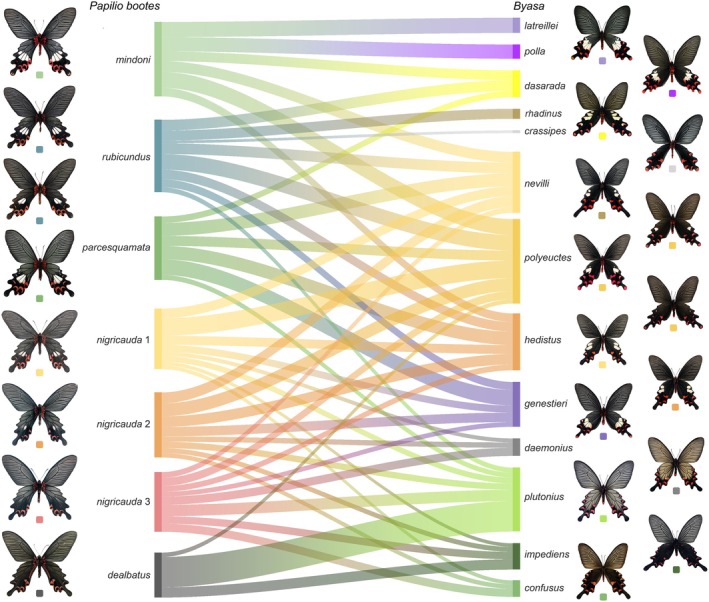 FIGURE 5
| Taxon name | Distribution range |
|---|---|
|
| Dulongjiang‐Irrawaddy valley, west of Gaoligong Shan |
|
| Nujiang‐Salween valley, east of Gaoligong Shan |
|
| Lancang‐Mekong and Yuanjiang‐Red River valleys |
|
| Upper Yangtze watershed in Yunnan and Sichuan |
|
| Qinling Mountains |
|
| Confined to the west of Gaoligong Shan, including Dulongjiang valley of Yunnan and S.E. Tibet |
|
| Confined to the west of Gaoligong Shan, and S.E. Tibet |
|
| Mainly found in N.W. to |
|
| Upper Yangtze River valley in N.W. Yunnan |
|
| Montane areas in of the Lancang‐Mekong, Nujiang‐Salween, and Dulong‐Irrawaddy valley of Yunnan; and subalpine montane areas in W. Sichuan to S. Shaanxi |
|
| A narrow‐ranged species endemic to the Cang Shan area in Dali, Yunnan |
|
| Confined to the lowlands of W., S.W., S., and S.E. Yunnan |
|
| Widely distributed in the montane areas east of the Gaoligong Shan to the S.E. part of Yunnan |
|
| Found in |
|
| Widely distributed throughout Yunnan, and part of Sichuan, Guizhou, and S.E. Tibet |
|
| Widely distributed in S.W., S., C., and part of N. China south of Yanshan Mountains |
|
| Widely distributed throughout Yunnan; also found in Sichuan |
|
| East margin of the Hengduan Mountains |
| Taxon name | No. of specimens | Collection locality |
|---|---|---|
|
| 13 | Dehong, Yunnan |
|
| 11 | Fugong, Yunnan |
|
| 11 | Kunming and Dali, Yunnan |
|
| 51 | Ganzi and Ya'an, Sichuan |
|
| 11 | Qinling Mountains, Shaanxi |
|
| 7 | Dehong, Yunnan |
|
| 9 | Dehong, Yunnan |
|
| 2 | Dehong, Yunnan |
|
| 9 | Diqing, Yunnan |
|
| 12 | Dali, Yunnan |
|
| 1 | Dali, Yunnan |
|
| 4 | Dehong, Yunnan |
|
| 18 | Kunming, Yunnan |
|
| 16 | Ya'an, Sichuan |
|
| 6 | Kunming, Yunnan |
|
| 69 | Dehong, Dali, and Kunming, Yunnan; Ya'an, Sichuan |
|
| 7 | Dali and Kunming, Yunnan |
|
| 6 | Ya'an, Sichuan |
- —Yunnan Provincial Science and Technology Department10.13039/501100008871
Peer Reviews
No public reviews on file for this paper yet. If you reviewed it on a platform where reviews are public (OpenReview, ICLR, NeurIPS, ICML), you can paste yours below so the community can read it here.
Videos
No videos yet. Explain this paper in a talk, walkthrough, or lecture? Add one.
Taxonomy
TopicsLepidoptera: Biology and Taxonomy · Animal Behavior and Reproduction · Plant and animal studies
Introduction
1
Batesian mimicry refers to a phenomenon that nontoxic or palatable species in nature evolved to have a resemblance in shape, colour and texture to the toxic or unpalatable species to avoid predation (Mallet and Gilbert 1995; Outomuro et al. 2016; Ruxton et al. 2019). Batesian mimicry is an example of adaptation under natural selection and is an important aspect in biological research (Bonner 1988; Prudic et al. 2007; Futahashi and Fujiwara 2008). This phenomenon is common in nature but much more noticeable in butterflies (Kristensen et al. 2007), which has long been a focus of evolutionary biology research (Anderson and de Jager 2020).
Visual features are crucial in Batesian mimicry, particularly the colour patterns of butterfly wings. These patterns, including complex elements like stripes and spots with diverse shapes and colours resulting from coevolution (Turner 1984; Nishida and Fukami 1989; Nijhout 2001; Kunte 2009; Kronforst and Papa 2015), facilitate visual identification by predators. This visual signalling both prevents prey from being taken and serves to confuse or warn predators (Chai 1996; Basu et al. 2023). During the evolution of butterfly patterns, the same set of individual pattern elements is arranged in new ways to produce species‐specific patterns, including adaptations such as mimicry and camouflage (Nijhout 2001).
Predators perceive visual features to evaluate the palatability of the preys. Unpalatable butterflies ward off predators by displaying distinctive wing patterns, such as the banded markings in the genus Heliconius (Nymphalidae: Heliconiinae) as a means of announcing toxicity (Nijhout 1991). The white‐spotted mimicry of the unpalatable Pachliopta aristolochiae to avoid predation by female Papilio polytes in the family Papilionidae has also been validated by a series of studies (Clarke and Sheppard 1972; Mallet 2008; Kunte 2009; Song and Liang 2009; Nishikawa et al. 2013). Brower (1958) studied the Batesian mimicry phenomenon between Limenitis archippus and Danaus plexippus and found that neither D. plexippus nor L. archippus was attacked or even approached in any experiment, indicating that the resemblance in colour pattern is linked to its unpalatability.
Among the numerous cases of Batesian mimicry in butterflies, a particularly interesting example is the mimicry between different subspecies of the Tailed Redbreast Papilio bootes and various Byasa species. Throughout its distribution range, P. bootes exhibits high variability in hindwing markings that can be divided into eight subspecies, namely ssp. bootes in Meghalaya, N.E. India; ssp. mixta in Nagaland, N.E. India; ssp. mindoni in Kachin State, N. Myanmar and the Dulongjiang‐Irrawaddy Valley in N.W. Yunnan, China; ssp. parcesquamata in the Nujiang‐Salween River valley of N.W. Yunnan, China; ssp. rubicundus in the Lancang‐Mekong, Yuanjiang‐Red River valleys of C. Yunnan, China to N. Vietnam; ssp. nigricauda in the eastern margin of the upper Yangtze River watershed; ssp. dealbatus endemic to the Qinling Mountains; and ssp. xamnuensis endemic to N. Laos (Racheli and Bozano 2024). Several Byasa species can be found within the range of certain subspecies of P. bootes, which usually show limited phenotypes resembling one of a few ‘mainstream’ Byasa species. The mimicry between these two species has not been scientifically explored, apart from brief mentions in taxonomic literature (Nakae 2021).
To tackle this intriguing mimicry case in nature, the present study combined computer‐aided and human‐eyesight comparison to analyse the similarities between each subspecies of P. bootes and its sympatric Byasa species in China, where the diversity of both groups is the greatest (Racheli and Cotton 2010; Racheli and Bozano 2024). The purpose of such a design is to minimise the human‐mediated bias in traditional mimicry research (Bhuiyan et al. 2022), as well as to compensate for the missing part of animal‐visual recognition in research purely using computer models (Schnell et al. 2023). The findings of this study have the potential to facilitate our understanding of the mimicry between P. bootes and Byasa and provide new insights for future research on Batesian mimicry in butterflies.
Materials and Methods
2
Focal Taxon
2.1
This study focused on the taxon‐rich part of the distribution range of Papilio bootes and Byasa spp. in western China and analysed the five subspecies of P. bootes and 13 species of Byasa. The taxon names and their distribution ranges mainly followed Hu et al. (2023) and Racheli and Bozano (2024) (Table 1 and Figure 2).
Taxon Sampling
2.2
Specimens were collected from the distribution ranges of P. bootes and its sympatric Byasa species in China using insect nets. Captured individuals were killed by pinching the thorax and preserved in paper triangles, labelled with detailed collecting information, dried and stored at room temperature.
All specimens were spread in the laboratory and photographed using a Canon EOS 700D camera in a light box with a white background to standardise the exposure and white balance of each photograph, in order to minimise the differences induced by photographing in subsequent analyses. For each specimen, the dorsal and ventral sides were photographed using the same methods.
The hindwing white spots are highly variable across or even within taxa; therefore, the number of hindwing white spots was counted and plotted to show the percentage of each type and used in future analysis (Figure 1).
Percentages of the number of hindwing white spots in five subspecies of Papilio bootes (A) and 13 species of Byasa (B) in this study, with the upper right corner illustrating the counting criterion (C).
Computer‐Aided Morphological Comparison
2.3
This study employed the unsupervised deep learning algorithm SwAV (Caron et al. 2020) to extract morphological features from specimen photographs (Alam et al. 2024). Specifically, SwAV maps each butterfly image into a 2048‐dimension feature vector, capturing a range of features including wing shape, colour and hindwing markings (white discal and subapical spots, red submarginal spots and red tail spot), then analyses these feature vectors to enable a precise assessment of similarity between the focal taxa.
To obtain an efficient feature extractor, we first trained the SwAV model on a dataset comprising 19 butterfly species and a total of 251 images. The SwAV model was initialised with weights pretrained on ImageNet (Deng et al. 2009), a foundational visual database containing over 14 million hand‐annotated images across 20,000 everyday object categories. The pre‐training allows models to recognise basic visual patterns before specialising in domain‐specific tasks like butterfly morphology. The collected data set of 251 images was split into training, validation and test sets in an 8:1:1 ratio. After training, the feature extractor achieved a performance of 90.67% robustness on the test set.
Assume the data set X = {X 1, X 2, …, X _ n _}, where n represented the number of samples. The feature vectors obtained after processing through the feature extractor can be denoted as F = f 1, f 2, …, f _ n _. These extracted features were grouped according to their respective categories, and the average feature for each category is calculated. The mean feature vectors for different categories can be represented as f¯=f1¯,f2¯,…,fk¯, where k denotes the number of butterfly species.
Cosine similarity was then employed to calculate the feature similarity between images of different butterfly species. S _ ij _ represents the similarity between different species.
Where, f¯ represents the average features of different butterfly species images from the sample X and denotes the feature similarity between species i and j. After calculating the similarity between different species, we created a heatmap to visualise the similarity among butterfly species. We mapped a set of Sankey diagrams based on the similarity values between P. bootes subspecies and Byasa species. The flows between taxa were represented by Q _ ij _.
To visualise the distribution of the features, t‐SNE (Stochastic Neighbour Embedding) (Van der Maaten and Hinton 2008) is used for dimensional downscaling and mapped onto a two‐dimensional plane. The relationships between high‐dimensional sample points can be expressed as:
and the position relationship of low‐dimensional sample points is expressed as:
where, y represents the coordinates of different species in the low‐dimensional space.
Use Kullback–Leibler divergence (KL) (Kullback and Leibler 1951; Csiszar 1975) to measure the difference between the two probability distributions of P _ j|i _ and q _ j|i _:
The gradient descent algorithm is used to optimise y, minimising C to achieve the goal of mapping high‐dimensional features to a low‐dimensional space. Finally, a multi‐dimension feature vector is downscaled to a three‐dimension vector and visualised on a 3D coordinate space. The data were computed using Python scripts and then visualised using Origin 2022b (OriginLab Corporation, Northampton, MA, USA) into a heatmap and 3D charts. Additional annotations to the Sankey diagram were added by Adobe Illustrator CS6 (Adobe Systems Inc., San Jose, CA, USA; licenced serial number 9229‐8586‐7036‐7176).
Human Eyesight Comparison
2.4
To complement the results of computer‐aided comparison, the present study implemented human eyesight comparison since human trichromatic vision is the closest among mammals to avian vision, although humans cannot perceive the ultraviolet portion of the spectrum like birds. An anonymous questionnaire survey with a Likert scale, a universal quantitative survey method to assess the feeling/attitude of participants, was utilised to collect the responses from all participants (Likert 1932). The basic information part of the survey questionnaire contains the participants' gender, age, education background and familiarity with butterfly taxonomy, in an attempt to detect bias in quality control. Control questions were designed to feature pairs of butterflies that are totally different from both P. bootes and Byasa spp. (e.g., Graphium and Troides species with extremely different wing shapes and colours), while the testing questions involved pairing different subspecies of P. bootes with different species of Byasa by rating the eyesight similarity using a 10‐point scale, with larger numbers indicating greater perceived similarity.
The survey questionnaires were distributed online via the platform Wenjuanxing (https://www.wjx.cn/), between March 20th and May 6th, 2024, using the Chinese social media WeChat to promote participation. After the survey, a total of 1006 questionnaires were collected. The results were exported in an Excel spreadsheet, and validation was performed to manually flag responses with inconsistencies in the control questions (i.e., different responses among three questions of the same designed answer), as well as the responses with contradictions in two or more sets of highly similar questions. After validation, 506 questionnaires were deemed valid and passed to subsequent analyses. Mean similarity scores of all testing questions were calculated and visualised into another set of Sankey diagrams.
Since historical nonsympatric mimicry is proved with evolutionary significance (Linares 1997; Pfennig and Mullen 2010), we generated two sets of Sankey diagrams from both the computer‐aided and human‐eyesight morphological comparisons. One set of the Sankey diagrams containing nonsympatric taxa was used to test possible historical mimicry, while the other set containing only sympatric taxa was used to show the current status.
Results
3
Computer‐Aided Morphological Comparison
3.1
This study analysed 260 specimens (Table 2), comprising five subspecies of Papilio bootes and thirteen Byasa species, revealing distinct geographical mimicry patterns (Figure 2). In the Dulongjiang‐Irrawaddy Valley in Northwest Yunnan, P. bootes mindoni exhibits strong morphological convergence with sympatric B. latreillei and B. nevilli, while showing minimal resemblance to all‐black species like B. plutonius. The Nujiang‐Salween Valley population (P. bootes parcesquamata) closely mirrors B. nevilli and B. genestieri, yet displays negligible similarity to local spotless species like B. dasarada.
Heatmap of the similarity between Papilio bootes (Y‐axis) and 13 sympatric Byasa species (X‐axis) with hierarchical clustering.
Moving southward through the Lancang‐Mekong and Yuanjiang‐Red River Valleys, P. bootes rubicundus demonstrates pronounced alignment with B. plutonius and B. crassipes , contrasting sharply with its dissimilarity to white‐spotted Byasa species. Along the eastern Yangtze fringe, P. bootes nigricauda shows greater morphological diversity than other subspecies, with strongest affinities for spotless models like B. daemonius and B. confusus . The Qinling Mountains endemic (P. bootes dealbatus) presents relatively low mimicry specialisation, though maintains measurable connections to B. polyeuctes.
These regional partnerships are visually synthesised in the Sankey diagram (Figure 3), which maps morphological affinity flows between sympatric taxa. P. bootes mindoni channels robust similarity towards B. latreillei and B. polla, while P. bootes parcesquamata shows dominant linkages to B. nevilli and B. genestieri in its restricted range. For P. bootes rubicundus, substantive flows connect to multiple Byasa species including B. polyeuctes and B. hedistus, whereas P. bootes nigricauda exhibits focused convergence with spotless B. daemonius and B. plutonius. Notably, P. bootes dealbatus displays selective affinity for B. polyeuctes despite overall weak mimicry associations. When taking nonsympatric taxa into the analysis, the Sankey diagram shows a more evenly distributed channel connections between the darker or all‐black subspecies of P. bootes (rubicundus, two types of nigricauda and dealbatus) and Byasa species, while the P. bootes with large hindwing white spots are more connected to the most similar Byasa species mentioned above (Figure S1).
Sankey diagram of the computer‐aided similarity between five subspecies of Papilio bootes and 13 Byasa species (currently sympatric only). The width of connecting bands represents the degree of similarities, with broader bands indicating higher similarity. Butterflies are colour‐coded, with each colour corresponding to a specific taxon group.
Cross‐regionally, 3D scatter plots (Figure 4) confirm tighter morphological clustering in four subspecies compared with the variable P. bootes nigricauda. Byasa polyeuctes emerges as a generalist mimic, maintaining consistent intermediate similarity with all P. bootes subspecies across their ranges—unlike specialists such as B. crassipes which show strong geographical limitation. Phylogenetic analysis further contextualises these relationships, dividing Byasa into two primary clades: white‐spotted species (e.g., B. nevilli, B. polyeuctes) and predominantly spotless species (e.g., B. dasarada, B. plutonius), with mimicry partnerships consistently aligning with these evolutionary groupings within each geographical region.
3‐D t‐SNE scatter plots showing the similarity between five P. bootes subspecies and their sympatric Byasa species. Pentagrams denote Papilio bootes and triangles represent Byasa in each plot.
Human Eyesight Comparison
3.2
Questionnaire responses from 506 participants possessing limited taxonomic familiarity, yielded reliable perceptual data on mimicry similarity. The Sankey diagram (Figure 5) analysis revealed distinct geographical patterns in human perception. In the Dulongjiang‐Irrawaddy Valley in Northwest Yunnan, P. bootes mindoni was perceived as most similar to B. latreillei , B. polla and B. polyeuctes, with secondary resemblance to B. dasarada and B. nevilli, while showing minimal perceptual alignment with B. hedistus.
Sankey diagram based on the survey questionnaires on the similarity between five subspecies of Papilio bootes and 13 Byasa species (currently sympatric only); the band widths indicate morphological similarities. Butterfly taxa are colour‐coded accordingly.
Within the Nujiang‐Salween Valley of Northwest Yunnan, P. bootes parcesquamata exhibited strongest visual affinity to B. genestieri, followed by B. nevilli, B. polyeuctes and B. hedistus, contrasting with its weakest perceived similarities to B. dasarada and B. plutonius. Further south in the Lancang‐Mekong and Red River Valleys in Central Yunnan, P. bootes rubicundus demonstrated highest perceptual correspondence with B. polyeuctes, followed by B. dasarada, B. rhadinus, B. nevilli, B. hedistus and B. genestieri, though it showed minimal visual alignment with B. crassipes and B. plutonius.
The Qinling Mountains endemic P. bootes dealbatus displayed strongest perceived resemblance to B. plutonius with secondary affinity to B. impediens, while showing negligible visual similarity to B. polyeuctes. Notably within the morphologically variable Upper Yangtze population (P. bootes nigricauda), human perception varied considerably by colour morph: white‐spotted individuals showed strong alignment with B. polyeuctes (or with B. nevilli and B. hedistus in one specimen) but minimal resemblance to spotless species like B. daemonius, B. impediens and B. confusus ; in contrast, completely dark nonspotted forms demonstrated highest similarity to B. plutonius with weakest correspondence to white‐spotted B. nevilli and B. genestieri.
When taking nonsympatric taxa into the analysis, the Sankey diagram also shows a more evenly distributed channel connections between the darker or all‐black subspecies of P. bootes (rubicundus and two types of nigricauda) and Byasa species, while the P. bootes with large hindwing white spots and the Qinling Mountain endemic dealbatus are more connected to the most similar Byasa species mentioned above (Figure S2).
Discussion
4
The present study quantitatively demonstrated that Papilio bootes has a mimetic strategy of ‘targeting’ its sympatric Byasa species, especially in terms of hindwing white spots. It became clear that in West Yunnan, both subspecies of P. bootes, namely mindoni and parcesquamata, primarily mimic B. latreillei , B. polla and B. genestieri, the only three species with up to four hindwing white spots. Similarly, in the Qinling Mountains, P. bootes dealbatus specifically mimics Byasa without any hindwing white spots, B. impediens, B. plutonius and black B. polyeuctes (Figures 3, 5, S1 and S2). Between the two extremes, the other two subspecies of P. bootes, rubicundus and nigricauda, showed a more ‘flexible’ way of mimicking, which ranged from the four‐spotted B. genestieri in the western part to the spotless Byasa species in the northeastern part (Figures 3, 5, S1 and S2).
B. polyeuctes is interesting among several mimicry models of ssp. rubicundus and ssp. nigricauda. Primarily, B. polyeuctes has two white spots on the hindwing, but the number and size of these spots are highly variable. Wu and Hsu (2007) and Racheli and Cotton (2010) showed that in South and West Yunnan, the hindwing white spots of B. polyeuctes are larger than those in other parts of the Chinese mainland, while in the northern part of Yunnan, as well as the entire Sichuan and Shaanxi, the hindwing white spots of B. polyeuctes are reduced in both numbers and size to a complete black hindwing type. The variability in the number of hindwing discal white spots (0–2) in B. polyeuctes is evidently reflected by the morphological diversity found in ssp. rubicundus and ssp. nigricauda from the south to the north in their distribution range (Figures 3, 5, S1 and S2), forming a morphological gradient. It is worth mentioning that there are certain similarities between ssp. mindoni and ssp. parcesquamata and B. polyeuctes recognised by both computer‐aided and human eyesight comparisons, which can be explained by the larger hindwing white spots of sympatric B. polyeuctes.
Phylogenetic research of Papilionidae showed that P. bootes diverged quite recently in time (1.09–3.61 Ma, 95% HPD) (Condamine et al. 2023) compared to that of genus Byasa (12.26–23.21 Ma, 95% HPD), despite a few taxa diverging very recently (e.g., B. dasarada, B. hedistus, and B. confusus ) (S.‐J. Hu. B. J. Lafon, Z.‐B. Xu, M. Tang, A. M. Cotton, Y.‐Q. Jia, X. Zhang, S.‐X. Ge, K. Duan, F. L. Condamine unpublished data; Figure S3). Hence, it is logical to assume that the mimetic traits of P. bootes were accumulated through natural selection, that the morphological traits representing unpalatable images were gained over time to enhance the fitness of each population (or subspecies) (Mallet and Joron 1999; Mauro 2002; Caro et al. 2016; Ruxton et al. 2019). The variable B. polyeuctes diverged 11.49 Ma (95% HPD: 7.57–15.59 Ma) in the Hengduan Mountains of southwestern China, where two spotless species (B. daemonius and B. crassipes ) and three four‐spotted species ( B. latreillei , B. polla and B. genestieri) originated before it since 14.19 Ma (95% HPD: 9.47–19.16 Ma) (S.‐J. Hu. B. J. Lafon, Z.‐B. Xu, M. Tang, A. M. Cotton, Y.‐Q. Jia, X. Zhang, S.‐X. Ge, K. Duan, F. L. Condamine unpublished data). Therefore, it is highly likely that the larger hindwing white spots of B. polyeuctes are an ancestral character to increase its fitness among those four‐spotted species, and the spot‐reducing character is a subsequent adaptive trait after expanding its range into the areas dominated by other spotless species like B. impediens and B. plutonius. In this case, the possible Müllerian mimicry within Byasa might have shaped the spot variability of B. polyeuctes (Figures 2, 4), similar to the mimicry among different Heliconius species (Pérochon et al. 2025). In the transition area between the four‐spotted and the spotless Byasa species, the variability of B. polyeuctes plays a bridge to mingle the P. bootes and the various sympatric Byasa species with different morphological characters.
Although both computer‐aided and human eyesight comparison can effectively assist theoretical research on butterfly mimicry, the readers must bear in mind that predators' visions in the real world are different. For instance, birds with UV vision are better capable of distinguishing yellow and white areas on the wings of Heliconius species compared to those without it. This perceptual advantage helps maintain effective mimicry signals, enhancing their mimicry effectiveness (Dell'Aglio et al. 2018). Future studies could incorporate UV spectrum to obtain a more comprehensive understanding of butterfly mimicry. Moreover, field simulations using dummy insects with novo material could also benefit this research field by obtaining first‐hand predating/attacking data (Roslin et al. 2017; Pan et al. 2021; Nimalrathna et al. 2023).
Overall, this study corroborates the mimicry of P. bootes using two complementary analytical approaches: image similarity analysis and questionnaire‐based perception surveys. The image similarity analysis quantitatively assessed the degree of resemblance between P. bootes and Byasa species, while the survey evaluated the ability of human observers to distinguish between them. These results suggest that mimicry in P. bootes operates not only at the morphological level but also influences recognition at the level of visual perception (Mallet and Joron 1999; Kunte 2009). The evolution of mimetic traits in P. bootes is shaped not only by morphological convergence but also by complex ecological factors. Its similarity to Byasa species likely results from long‐term selective pressures rather than close phylogenetic relatedness (Gilbert 2005; Wu and Hsu 2007). This finding aligns with classical Batesian mimicry theory and further emphasises the critical role of environmental factors in driving mimicry evolution (Seymoure 2016).
Author Contributions
Yuan‐Rui‐Xue Xie: formal analysis (lead), investigation (lead), methodology (equal), visualization (equal), writing – original draft (lead), writing – review and editing (equal). Zhi‐Xing Ding: formal analysis (equal), methodology (equal). Adam M. Cotton: resources (equal), writing – review and editing (equal). Zhen‐Bang Xu: investigation (equal), methodology (equal). Yue Pan: investigation (equal), methodology (equal). Yi‐Ting Lin: investigation (equal), methodology (equal). Shao‐Ji Hu: conceptualization (lead), funding acquisition (lead), methodology (equal), resources (equal), supervision (equal), writing – review and editing (lead).
Conflicts of Interest
The authors declare no conflicts of interest.
Supporting information
Figure S1: Sankey diagram of the computer‐aided similarity between five subspecies of Papilio bootes and 13 Byasa species (including non‐sympatric). The width of connecting bands represent the degree of similarities, with broader bands indicating higher similarity. Butterflies are colour‐coded, with each colour corresponding to a specific taxon group.
Figure S2: Sankey diagram based on the survey questionnaires on the similarity between five subspecies of Papilio bootes and 13 Byasa species (including nonsympatric), the band widths indicate morphological similarities. Butterfly taxa are colour‐coded accordingly.
Figure S3: Unpublished Bayesian dated tree and biogeographic history of Byasa. Node values represent median divergence times with coloured bars representing the 95% HPD. Squares on each node represent the estimated ancestral areas, while circles at the end of each branch represent current species distribution areas. Along branches, triangles indicate dispersal from ancestral areas to descendant distribution areas, daggers indicate extirpation from ancestral areas, and the colours of all these symbols mirror those on the biogeographic map in the top‐left corner. Explosion symbols represent vicariance events.
Data S1: ece372369‐sup‐0004‐SupplementaryTables.zip.
The reference list from the paper itself. Each links out to its DOI / PubMed record.
- 1Alam, N. U. , E. H. Bahadur , A. K. M. Masum , F. M. Noori , and Z. Uddin . 2024. “Sw AV‐Driven Diagnostics: New Perspectives on Grading Diabetic Retinopathy From Retinal Photography.” Frontiers in Robotics and AI 11: 1445565. 10.3389/frobt.2024.1445565.39346742 PMC 11427755 · doi ↗ · pubmed ↗
- 2Anderson, B. , and M. L. de Jager . 2020. “Natural Selection in Mimicry.” Biological Reviews 95, no. 2: 291–304. 10.1111/brv.12564.31663254 · doi ↗ · pubmed ↗
- 3Basu, D. N. , V. Bhaumik , and K. Kunte . 2023. “The Tempo and Mode of Character Evolution in the Assembly of Mimetic Communities.” PNAS 120: e 2203724120. 10.1073/pnas.2203724120.36577073 PMC 9910590 · doi ↗ · pubmed ↗
- 4Bhuiyan, T. , R. M. Carney , and S. Chellappan . 2022. “Artificial Intelligence Versus Natural Selection: Using Computer Vision Techniques to Classify Bees and Bee Mimics.” i Science 25, no. 9: 104924. 10.1016/j.isci.2022.104924.36060073 PMC 9437854 · doi ↗ · pubmed ↗
- 5Bonner, J. T. 1988. The Evolution of Complexity: By Means of Natural Selection, 272. Princeton University Press.
- 6Brower, J. V. Z. 1958. “Experimental Studies of Mimicry in Some North American Butterflies: Part II. Battus philenor and Papilio troilus, P. polyxenes and P. glaucus .” Evolution 12, no. 2: 123–136. 10.1111/j.1558-5646.1958.tb 02939.x. · doi ↗
- 7Caro, T. , T. N. Sherratt , and M. Stevens . 2016. “The Ecology of Multiple Colour Defences.” Evolutionary Ecology 30: 797–809. 10.1007/s 10682-016-9854-3. · doi ↗
- 8Caron, M. , I. Misra , J. Mairal , P. Goyal , P. Bojanowski , and A. Joulin . 2020. “Unsupervised Learning of Visual Features by Contrasting Cluster Assignments.” Paper presented at the 34th International Conference on Neural Information Processing System.Vancouver, BC, Canada. 9912–9924.