Trajectories of Frequent Short-Term Emergency Department Visits Among Older Adults
Rick Mah, Jane McCusker, Eric Belzile, David A Dorr, Deniz Cetin-Sahin, Julia Chabot

TL;DR
The study identifies different patterns of emergency department visits among older adults over 90 days and explores their characteristics to improve care delivery.
Contribution
The novel contribution is identifying distinct short-term ED use trajectories among older adults and linking them to patient characteristics.
Findings
Three distinct ED visit trajectories were identified: Stable, Increasing, and Hyperacute.
The Hyperacute trajectory was associated with shorter ED stays and fewer chronic conditions.
Trajectory-based approaches may improve understanding and optimization of ED care for older adults.
Abstract
Objectives Frequent emergency department (ED) use is typically defined over a one-year period, but short-term patterns of use among older adults remain poorly understood. We sought to identify distinct trajectories of ED use over a 90-day period and describe their associated patient and visit characteristics, with the goal of informing ED care for this population. Methods We conducted a retrospective population study in Quebec, Canada, using provincial administrative databases. Patients aged ≥65 years with an index ED visit between July 2014 to December 2015 and three or more ED visits in the preceding 90 days were included. Group-based trajectory modeling was used to identify patient groups with distinct trajectories of ED visits; the patient and visit characteristics for each trajectory were compared. Results The 10,741 included patients were divided into two cohorts: those with…
Genes, proteins, chemicals, diseases, species, mutations and cell lines named across the full text — each resolved to its canonical identifier and authoritative record.
Click any figure to enlarge with its caption.
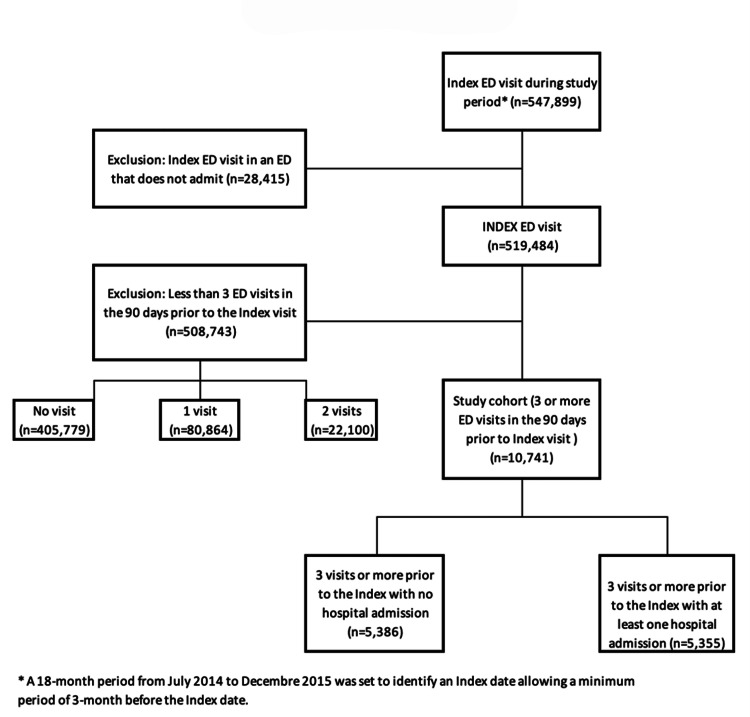 Figure 1
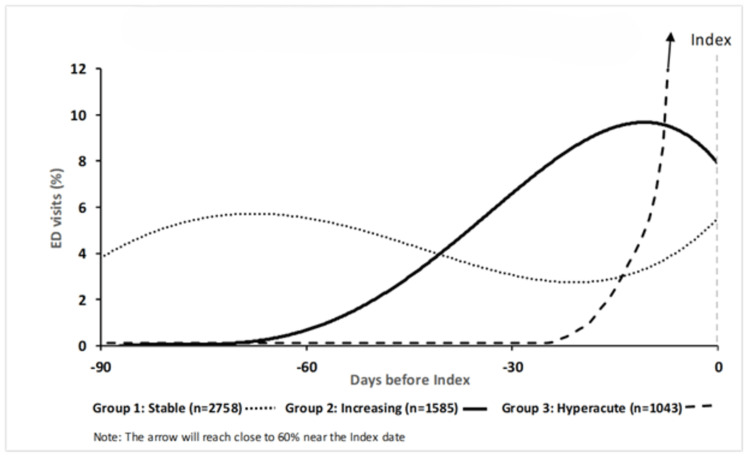 Figure 2
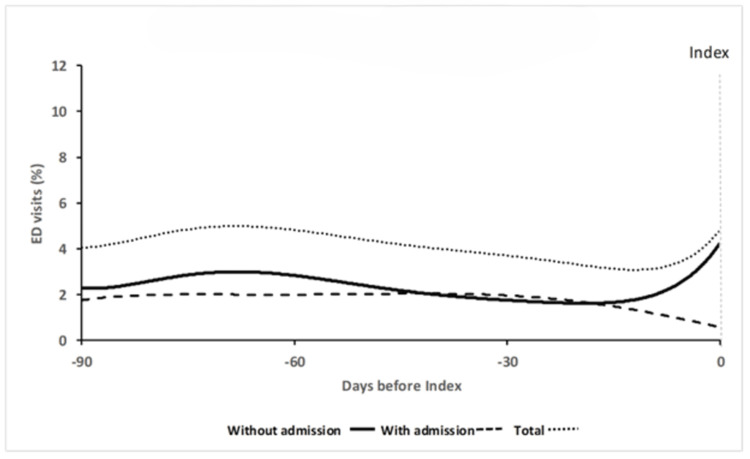 Figure 3
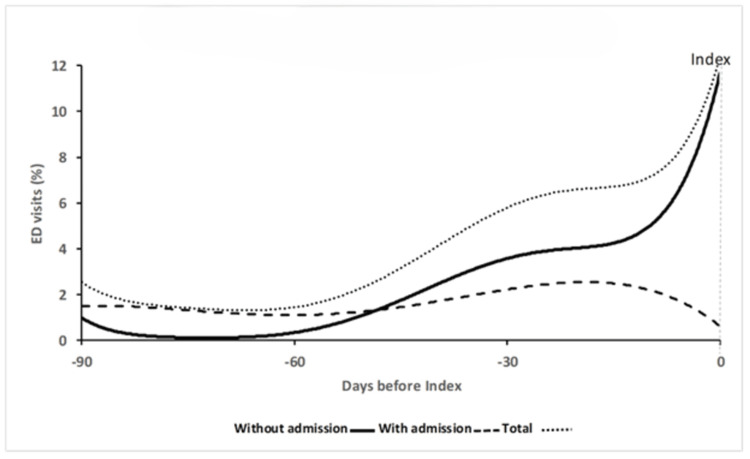 Figure 4
| Variables | Total | No Admission | Admission |
| (n=10,741) | (n=5,386) | (n=5,355) | |
| Patient characteristics | |||
| Age, % | |||
| 65-74 | 41% | 46% | 35% |
| 75-84 | 38% | 37% | 39% |
| 85+ | 21% | 16% | 26% |
| Mean (SD) | 77.5 (7.8) | 76.3 (7.5) | 78.7 (8.0) |
| Female, % | 50% | 50% | 50% |
| Visit characteristics | |||
| Arrival mode, % | |||
| Ambulance | 43% | 28% | 58% |
| Walk-in | 56% | 71% | 40% |
| Other | 1% | 1% | 2% |
| Triage code, % | |||
| 1 | 2% | 1% | 3% |
| 2 | 10% | 7% | 13% |
| 3 | 34% | 28% | 41% |
| 4 | 33% | 35% | 31% |
| 5 | 21% | 30% | 11% |
| Chief complaint coded as "return visit"1, % | 12% | 16% | 9% |
| Placement after triage, % | |||
| Stretcher | 37% | 25% | 48% |
| Ambulatory | 63% | 75% | 52% |
| Length of stay (hours), median (Q1-Q3) | 7.5 (3-21) | 5.1 (2-12) | 11.6 (5-26) |
| Chronic disease, n (%) | |||
| No | 77% | 87% | 67% |
| Yes | 23% | 13% | 33% |
| Hospital characteristics | |||
| ED classification2, % | |||
| Primary | 24% | 29% | 18% |
| Secondary | 45% | 42% | 49% |
| Tertiary | 31% | 29% | 33% |
| Geographic location3, % | |||
| Metropolitan | 56% | 51% | 61% |
| Urban/suburban | 26% | 27% | 25% |
| Rural | 18% | 23% | 14% |
| Variables | No Admission (n=5,386) | Admission (n=5,355) | |||||||
| Multivariable model: nominal logistic regression | Multivariable model: logistic regression | ||||||||
| Stable (n=2,758), % | Increasing (n=1,585), % | Hyperacute (n=1,043), % | Increasing vs Stable, OR [95% CI] | Hyperacute vs Stable, OR [95% CI] | Hyperacute vs Increasing, OR [95% CI] | Stable (n=3,618), % | Increasing (n=1,737), % | Increasing vs Stable, OR [95% CI] | |
| Patient/visit characteristics | |||||||||
| Age at index (years) | |||||||||
| 65-74 | 44.1 | 46.4 | 52.3 | 0.98 [0.90; 1.07] | 1.09 [0.99; 1.21] | 1.11 [0.99; 1.23] | 33.1 | 38.4 | 1.16 [1.08; 1.24] |
| 75-84 | 38.5 | 37.6 | 34.6 | 1.02 [0.94; 1.12] | 0.94 [0.85; 1.04] | 0.92 [0.82; 1.03] | 40,0 | 36.6 | 0.92 [0.85; 0.99] |
| 85+ | 17.4 | 16.0 | 13.1 | 1.00 | 1.00 | 1.00 | 26.9 | 25.00 | 1.00 |
| Sex | |||||||||
| Female | 53.1 | 48.9 | 45.7 | 1,00 | 1.00 | 1.00 | 50.1 | 50.4 | 1.00 |
| Male | 46.9 | 51.1 | 54.3 | 1.17 [1.11; 1.24] | 1.23 [1.15; 1.31] | 1.05 [0.98; 1.13] | 49.9 | 49.6 | 0.98 [0.93; 1.04] |
| Arrival mode* | |||||||||
| Ambulance | 29.0 | 24.7 | 12.5 | 1.00 | 1.00 | 1.00 | 58.4 | 52.9 | 1.00 |
| Walk-in | 71.0 | 75.3 | 87.5 | 1.22 [1.13; 1.31] | 1.79 [1.61; 1.99] | 1.47 [1.31; 1.65] | 41.6 | 47.1 | 1.13 [1.07; 1.20] |
| Triage code* | |||||||||
| 1-3 | 37.6 | 34.5 | 22.1 | 1.00 | 1.00 | 1.00 | 59.5 | 56.1 | 1.00 |
| 4-5 | 62.4 | 65.5 | 77.9 | 1.03 [0.97; 1.11] | 1.35 [1.24; 1.47] | 1.31 [1.19; 1.43] | 40.5 | 43.9 | 1.05 [0.99; 1.11] |
| Chief complaint coded as "return"* | |||||||||
| No | 89.8 | 85.5 | 79.1 | 1.00 | 1.00 | 1.00 | 93.2 | 89.6 | 1.00 |
| Yes | 10.2 | 14.5 | 20.9 | 1.42 [1.31; 1.55] | 1.41 [1.28; 1.54] | 0.99 [0.90; 1.09] | 6.8 | 10.4 | 1.40 [1.27; 1.54] |
| Placement after triage* | |||||||||
| Stretcher | 24.5 | 21.8 | 11.1 | 1.00 | 1.00 | 1.00 | 48.6 | 43.6 | 1.00 |
| Non-stretcher (ambulatory) | 75.5 | 78.2 | 88.9 | 0.98 [0.90; 1.07] | 1.24 [1.11; 1.40] | 1.27 [1.12; 1.43] | 51.4 | 56.4 | 1.10 [1.03; 1.16] |
| Length of stay in ED* | |||||||||
| Low | 17.7 | 20.6 | 35.2 | 1.15 [1.05; 1.27] | 1.99 [1.79; 2.22] | 1.73 [1.54; 1.95] | 22.5 | 26.00 | 1.16 [1.07; 1.25] |
| Medium | 53.0 | 53.7 | 48.7 | 1.06 [0.99; 1.14] | 1.08 [0.98; 1.19] | 1.02 [0.92; 1.13] | 47.7 | 48.00 | 1.08 [1.01; 1.16] |
| High | 29.3 | 25.7 | 16.1 | 1.00 | 1.00 | 1.00 | 29.8 | 26.00 | 1.00 |
| Chronic disease | |||||||||
| No | 85.0 | 86.6 | 94.0 | 1.00 | 1.00 | 1.00 | 64.8 | 71.5 | 1.00 |
| Yes | 15.0 | 13.4 | 6.0 | 0.89 [0.82; 0.97] | 0.41 [0.36; 0.47] | 0.46 [0.40; 0.53] | 35.2 | 28.5 | 0.76 [0.72; 0.81] |
| Hospital characteristics | |||||||||
| ED classification* | |||||||||
| Primary | 28.2 | 26.8 | 40.7 | 0.93 [0.82; 1.05] | 1.59 [1.39; 1.84] | 1.72 [1.48; 2.00] | 18.1 | 18.4 | 1.20 [1.07; 1.35] |
| Secondary | 43.1 | 43.8 | 38.5 | 0.98 [0.91; 1.07] | 0.94 [0.85; 1.05] | 0.96 [0.86; 1.08] | 48.5 | 49.6 | 1.09 [1.01; 1.17] |
| Tertiary | 28.7 | 29.4 | 20.8 | 1.00 | 1.00 | 1.00 | 33.4 | 32.0 | 1.00 |
| Geographic location* | |||||||||
| Metropolitan | 52.2 | 52.9 | 39.8 | 1.00 | 1.00 | 1.00 | 61.8 | 60.6 | 1.00 |
| Urban/suburban | 26.0 | 26.6 | 30.5 | 0.95 [0.87; 1.03] | 1.16 [1.05; 1.28] | 1.22 [1.09; 1.36] | 23.7 | 25.6 | 1.02 [0.95; 1.10] |
| Rural | 21.8 | 20.5 | 29.7 | 0.90 [0.80; 1.02] | 0.79 [0.69; 0.90] | 0.88 [0.76; 1.01] | 14.5 | 13.8 | 0.88 [0.79; 0.99] |
| Hospital change | |||||||||
| No | 71.2 | 74.0 | 82.7 | 1.00 | 1.00 | 1.00 | 67.0 | 63.2 | 1.00 |
| Yes | 28.8 | 26.0 | 17.4 | 0.84 [0.78; 0.90] | 0.57 [0.52; 0.62] | 0.68 [0.61; 0.74] | 33.0 | 36.8 | 1.16 [1.09; 1.23] |
| Stable | Increasing | Hyperacute | Increasing than Stable | Hyperacute than Stable | Hyperacute than Increasing | |
| Variables | %** | %** | %** | OR [95%] | OR [95%] | OR [95%] |
| No Admission (n=5,386) | (n=2,758) | (n=1,585) | (n=1,043) | Nominal logistic regression | ||
| Diagnoses more frequent in Increasing/Hyperacute trajectories | Multivariable model | |||||
| Cellulitis (L039) | 8.9% | 13.8% | 36.1% | - | 3.81 [3.14; 4.62] | 2.67 [2.18; 3.26] |
| Bursitis, unspecified (M7199) | 0.4% | 1.1% | 1.9% | 2.18 [1.01; 4.69] | 2.60 [1.19; 5.67] | - |
| Follow-up exam unspecified treatment (Z099) | 2.6% | 4.4% | 4.5% | 1.54 [1.10; 2.16] | - | - |
| Other specified medical care (Z5188) | 8.3% | 7.1% | 12.6% | - | - | 1.62 [1.23; 2.14] |
| Diagnoses less frequent in Increasing/Hyperacute trajectories | ||||||
| Anemia (D649) | 2.5% | 1.4% | 0.3% | 0.52 [0.32; 0.85] | 0.11 [0.03; 0.35] | 0.21 [0.06; 0.71] |
| Fluid overload (E877) | 1.7% | 0.9% | 0.2% | 0.52 [0.28; 0.95] | 0.13 [0.03; 0.55] | 0.25 [0.06; 1.12] |
| Atrial fibrillation (I480) | 2.6% | 2.3% | 0.7% | - | 0.30 [0.13; 0.66] | 0.33 [0.15; 0.76] |
| Bronchitis, acute (J209) | 4.2% | 3.0% | 1.4% | - | 0.38 [0.22; 0.67] | 0.51 [0.28; 0.92] |
| COPD with respiratory infection (J440) | 3.2% | 1.5% | 0.6% | 0.45 [0.28; 0.72] | 0.26 [0.11; 0.61] | 0.57 [0.22; 1.45] |
| COPD exacerbation (J441) | 4.4% | 4.0% | 1.3% | - | 0.47 [0.26; 0.85] | 0.43 [0.23; 0.80] |
| Constipation (K590) | 4.6% | 5.1% | 2.2% | - | 0.64 [0.40; 1.02] | 0.54 [0.34; 0.88] |
| Back pain (M545) | 7.2% | 6.3% | 3.1% | - | 0.47 [0.32; 0.70] | 0.55 [0.36; 0.83] |
| Myalgia (M7919) | 1.9% | 2.4% | 0.4% | - | 0.21 [0.07; 0.59] | 0.17 [0.06; 0.48] |
| UTI - Urinary tract infection (N390) | 10.5% | 9.3% | 4.9% | - | 0.49 [0.36; 0.67] | 0.56 [0.40; 0.78] |
| Palpitations (R002) | 2.3% | 1.3% | 0.5% | 0.63 [0.38; 1.04] | 0.29 [0.11; 0.74] | 0.46 [0.17; 1.24] |
| Cough (R05) | 3.0% | 1.8% | 1.0% | 0.66 [0.43; 1.02] | 0.44 [0.22; 0.87] | - |
| SOB - Dyspnea (R060) | 7.5% | 6.9% | 1.8% | - | 0.37 [0.23; 0.61] | 0.36 [0.22; 0.59] |
| CP - Chest pain (R074) | 12.3% | 9.3% | 4.4% | - | 0.43 [0.31; 0.59] | 0.56 [0.40; 0.79] |
| Abdominal pain / Colic (R104) | 14.1% | 11.2% | 6.3% | - | 0.54 [0.41; 0.72] | - |
| Weakness / Fatigue (R53) | 8.8% | 7.2% | 4.2% | - | 0.62 [0.44; 0.87] | - |
| Syncope / Vasovagal (R55) | 3.7% | 2.3% | 1.1% | 0.64 [0.43; 0.94] | 0.34 [0.18; 0.65] | 0.54 [0.27; 1.08] |
| Open wound lower limb (T131) | 0.8% | 1.7% | 0.7% | - | 0.38 [0.16; 0.93] | 0.23 [0.10; 0.55] |
| Admission (n=5,355) | (n=3,618) | (n=1,737) | - | Logistic regression | ||
| Diagnoses for ED visits resulting in an admission | Multivariable model | |||||
| Diagnoses more frequent in Increasing trajectory | ||||||
| Diverticular disease of intestine (K578) | 0.5% | 1.0% | - | 2.03 [1.03; 3.98] | - | - |
| Diagnoses less frequent in Increasing trajectory | ||||||
| Clostridium difficile (A047) | 2.1% | 1.2% | - | 0.53 [0.32; 0.86] | - | - |
| Anemia (D649) | 2.7% | 1.8% | - | 0.64 [0.43; 0.97] | - | - |
| COPD with respiratory infection (J440) | 4.4% | 2.5% | - | 0.65 [0.46; 0.92] | - | - |
| COPD exacerbation (J441) | 7.1% | 4.1% | - | 0.59 [0.45; 0.78] | - | - |
| Urinary tract infection (N390) | 3.0% | 1.9% | - | 0.59 [0.39; 0.87] | - | - |
| Fever (R509) | 2.7% | 1.9% | - | 0.65 [0.44; 0.97] | - | - |
| Diagnoses for ED visits without admission | Multivariable model | |||||
| Diagnoses more frequent in Increasing trajectory | ||||||
| Cellulitis (L039) | 3.4% | 6.0% | - | 1.80 [1.38; 2.36] | - | - |
| Diagnoses less frequent in Increasing trajectory | ||||||
| Acute upper respiratory infection (J069) | 1.5% | 0.7% | - | 0.46 [0.25; 0.87] | - | - |
| COPD with respiratory infection (J440) | 2.4% | 1.4% | - | 0.65 [0.41; 1.02] | - | - |
| Concussion (S060) | 1.1% | 0.5% | - | 0.45 [0.22; 0.94] | - | - |
Peer Reviews
No public reviews on file for this paper yet. If you reviewed it on a platform where reviews are public (OpenReview, ICLR, NeurIPS, ICML), you can paste yours below so the community can read it here.
Videos
No videos yet. Explain this paper in a talk, walkthrough, or lecture? Add one.
Taxonomy
TopicsEmergency and Acute Care Studies · Geriatric Care and Nursing Homes · Chronic Disease Management Strategies
Introduction
Older adults are important users of the emergency department (ED). In Canada, 17.3% of ED visits in 2003 were by patients 65 years and older, and this has increased to 24.3% in 2021, representing nearly 3.4 million ED visits [1]. These patients are more likely to require admission or die [2] or, if discharged, have a significant risk of ED re-visit, hospital admission, and mortality [3-6]. Older adults are more likely to become frequent users than the general adult population [7]. Studies suggest that up to 6.6% of older patients fall into this category, making up 18% to 38% of ED visits [8-10]. These frequent users are more likely to be admitted, have longer in-patient length of stay, and have increased hospital mortality [11,12].
The most commonly accepted definition of frequent use is four or more visits per year [13]. Few studies have looked at frequent visits over a shorter time interval, even though, for clinicians, this may be concerning as it may represent a missed diagnosis or unmet need. Ronksley et al. studied high-intensity ED use over a seven-day period in the general adult population, but we found no studies on older adults examining high-frequency ED use over such a short time interval [14]. Another identified gap in the literature is how visits by frequent users are distributed over time [13] and whether the pattern of use could define subgroups of frequent users.
The study objectives were to identify trajectories of use among older adults with frequent ED visits over a 90-day period and describe associated patient, ED visit, and hospital characteristics.
These study results were previously presented as a poster at the 18th International Congress of the European Geriatric Medicine Society in September 2022 and the 24th International Conference on Emergency Medicine on May 27, 2025.
Materials and methods
Design and setting
The research was a retrospective population study using administrative databases from the Quebec Health Insurance Agency and Ministry of Health and Social Services covering all ED visits made by patients insured under the provincial health plan.
Ethics approval for the study was obtained from the Research Ethics Board of the Centre intégré universitaire de santé et de services sociaux de l’Ouest-de-l’Île-de-Montréal, and data access permissions were granted by the Access to Information Commission of Quebec.
Selection of participants and measurements
Subjects included all Quebec patients aged ≥65 years covered under the public health insurance who had an index ED visit between July 2014 and December 2015. The provincial database captures visits to all ED facilities, including those providing only ambulatory care and stabilization prior to transfer; however, visits to these latter facilities were excluded from the analysis. For each patient, an index visit date was assigned or selected randomly using STATA statistical software (uniform distribution) if a patient had more than one visit during the study period. The 90 days before the index visit were used to study and define the time trajectories of ED visits.
Data on each patient’s ED visit were linked to their demographic information using an encrypted identifier. Patient-level variables included age and sex. Visit-level variables included the date of the visit, mode of arrival to the ED (ambulance, ambulatory), triage score (Canadian Triage and Acuity Scale [CTAS] 1-5), presenting complaint (v1.1 Canadian ED Information System), ED placement after triage (stretcher, ambulatory care), discharge diagnosis (ICD-10 10th version), disposition (admit, discharge), and length of stay. Hospital-level variables included ED type (primary, secondary, tertiary) and geographic location (metropolitan, urban/suburban, rural) [15]. The presence of chronic disease (yes/no) for each patient was derived from the Charlson comorbidity index using all ED discharge diagnoses in the three months prior to the index visit [16].
There were little missing data (<0.01%) except for the ICD-10 codes (5.9% of visits did not have a discharge diagnosis).
Data analysis
The outcome used for the trajectory analysis was defined as an ED visit resulting in a hospital admission or an ED visit with discharge. To define a trajectory, only patients with three or more ED visits prior to the index visit were included. To facilitate analyses, patients were separated into those with at least one ED visit leading to hospital admission (Admission cohort) and those without any hospital admissions (No Admission cohort). (Information on the duration of each hospitalization was not available for the Admission cohort.)
Group-based trajectory modeling (GBTM) was used for the No Admission cohort to identify clusters of patients with similar trajectories of ED visits [17-19]. GBTM does not presume discrete sub-populations but rather that the overall distribution of visits can be explained by distinct time trajectories. For the Admission cohort, group-based multi-trajectory modeling (GBMTM), a multivariate extension of GBTM, was applied to examine two-time dependent variables (ED visit with admission and ED visit without admission) simultaneously. The number of trajectories for each cohort was selected using the Bayesian Information Criterion, and model adequacy was evaluated using Nagin’s criteria: average posterior probability of assignment ≥70% and odds of correct classification ≥5 [17,18,20]; full modeling details are provided in the Appendix. A sensitivity analysis was performed to evaluate potential bias from the random selection of the index visit.
For each cohort, the association between the patient and hospital characteristics of ED visits (including the index visit) and trajectories was studied using regression analysis. For the time-dependent variables, all visits were coded and included as covariates. Correlation from multiple ED visits per patient was accounted for by including a patient random intercept within a generalized linear mixed model [21]. For the No Admission cohort, a multinomial distribution was used to handle the three-level trajectory outcome, and a binomial distribution was used for the binary trajectory outcome of the Admission cohort. Odds ratios (ORs) and 95% confidence intervals (CIs) were calculated, with “clinically significant” ORs defined as ≥1.5 or ≤0.67, given the large sample size [22].
For each cohort, we studied the association between discharge diagnosis and the trajectories. We defined one binary variable for each diagnosis (ICD-10) in the preceding 90 days including the index visit (yes/no). Given the large number of diagnoses (>100), we initially applied partial least squares (PLS) regression to the trajectory outcome [23]. Variable importance in projection (VIP), which quantifies the contribution of each variable to the latent PLS components weighted by the extent to which each component accounts for variation in the outcome [23], was used to rank variables. Diagnoses with VIP scores greater than 1.2 were retained for subsequent analysis, followed by nominal logistic regression for the No Admission cohort (three-level trajectories) and binary logistic regression for the Admission cohort [24]. A multivariable model was fitted for each sample, and diagnoses with an OR greater than 1.5 or less than 0.67 were reported.
Analyses were carried out with SAS version 9.4 (SAS Institute Inc., Cary, NC) and STATA version 15.0 (StataCorp, College Station, TX).
Results
Subject characteristics
Of the 519,484 patients aged ≥65 years with an eligible index visit, 2.1% (n=10,741) had three or more visits in the 90 days before the index visit. Including their index visit, these patients accounted for 7.5% (51,029) of all ED visits (684,839) (Figure 1). Table 1 describes the patient characteristics of the Admission and No Admission cohorts. The average number of visits in the 90 days before the index visit was similar for the Admission and No Admission cohorts (3.7 versus 3.8) and for the individual trajectory clusters. For the Admission cohort, there was no difference in the proportion of ED visits with no admission and with admission between the two trajectories.
Derivation of study sampleED, emergency department
Trajectory model
For the No Admission cohort (n=5,386), results of the GBTM revealed an adequate three- and four-cluster solution. While the four-cluster solution had a better Bayesian information criterion (BIC), for simplicity, the three-cluster solution was retained to conduct the data exploration analyses. For the Admission cohort (n=5,355), the two-cluster solution was retained despite having a slightly lower BIC compared to the three-cluster solution as it was more robust in the sensitivity analysis; see Appendix for analysis and details of model performance. To facilitate the comparison of clusters, the general shape of the trajectory of ED use was described as: Stable, Increasing, and Hyperacute.
The three-trajectory model for the No Admission cohort is presented in Figure 2. The 95% CIs were narrow (not shown). Stable (25.7% total sample) demonstrated a constant probability of an ED visit throughout the 90 days, whereas Increasing (14.8%) began with a very low probability of a visit that increased approximately 60 days prior to the index visit. Hyperacute (9.7%) maintained a very low likelihood of a visit until approximately 20 days prior to the index visit before rapidly increasing to nearly a 60% probability of an ED visit.
No Admission group trajectories (n=5,386)
For the Admission cohort, each trajectory cluster was represented by two curves (probability of an ED visit with and without admission) with a cumulative curve to represent the probability of any ED visit (Figures 3, 4). The 95% CIs were narrow (not shown). For the overall probability of an ED visit, Stable (33.7% total sample) had near constant probability of a visit, whereas Increasing (16.2%) had a lower initial probability which then began to increase at 60 days. When the visit types (i.e., with or without admission) were considered separately, both *Stable *and Increasing had a near constant likelihood of an ED visit leading to admission. For ED visits without admission, Stable demonstrated a constant probability, whereas the initial likelihood of an ED visit without admission was very low in Increasing but then began to increase 60 days prior to the index visit.
Stable (n=3,618, 67.6%)
Increasing (n=1,737, 32.4%)
Trajectory group patient and visit characteristics
In the No Admission cohort, there was no difference in the age and sex distribution among the three clusters (Table 2). Hyperacute was less likely to have chronic illness and more likely to have a shorter length of stay, more primary level ED use, and visit the same ED compared to Stable and Increasing. For both the No Admission and Admission cohorts, *Stable *and Increasing did not show significant differences in patient, visit, and hospital characteristics.
Table 2: Relationship between patient, visit, and hospital characteristics in the 90 days prior to the index visit (including the index visit) and trajectory groupsMultivariable model with OR>1.5 or OR<0.67 are in bold*For the time-dependent variables, the patient average proportion was computedLength of stay in hours: No Admission sample (low: <2; medium: 2-8; high: 9+); Admission sample (low: <5; medium: 5-23; high: 24+)
Trajectory group discharge diagnosis characteristics
In the No Admission cohort, 36% of patients in Hyperacute had at least one ED visit for cellulitis, two and three times more frequent than Stable and Increasing, respectively. Compared to Hyperacute, the other two trajectories were more likely to present with atrial fibrillation, chronic obstructive pulmonary disease (COPD) exacerbation, constipation, back pain, urinary tract infection, shortness of breath, and chest pain. Between Stable and Increasing, Stable was more likely to have visits for anemia, fluid overload, COPD, and syncope, whereas Increasing was more likely to have follow-up exams as the discharge diagnosis.
In the Admission cohort, visits leading to an admission were studied separately from the no admission visits. Admission diagnoses of COPD, anemia, urinary tract infection, and fever were more likely with Stable than with Increasing. For visits that did not result in hospital admission, cellulitis was more likely with Increasing than Stable.
A "missing" category was created to handle the missing discharge diagnoses. When the diagnoses were analyzed in the regression model, the "missing" category did not show any significant association with any outcome.
Table 3 presents the selected diagnoses for the trajectory groups in the No Admission and Admission cohorts.
*Table 3: Selected diagnoses for trajectory groups in the No Admission and Admission sub-samples (diagnoses are sorted alphabetically according to the ICD-10)*Diagnoses for this table were selected based on PLS regression, statistical significance, and diagnosis frequency. Complete analysis is available in the Appendix.Percentage of patients with at least one visit with the diagnosis.Relevant odds ratios (OR) were defined as OR>1.5 or OR<0.67 from multivariable model regression. Significant OR (at 0.05) are in boldCOPD, chronic obstructive pulmonary disease; PLS, partial least squares
Discussion
Interpretation
A small group of older adults in the total sample (2.1%) used the ED frequently (7.5% of total visits) over a 90-day period. Nearly half of this group were seen and did not require admission for all of their visits (No Admission cohort). Two trajectories were identified in both the Admission and No Admission cohorts. The *Stable *trajectory demonstrated a near constant probability of an ED visit over the 90-day period, whereas the Increasing trajectory began with a very low probability of an ED visit, which then increased towards the index visit. In the No Admission cohort, a third trajectory (Hyperacute) was unlikely to visit until 20 days before the index visit and then increased rapidly to nearly a 60% probability of an ED visit. Hyperacute had fewer chronic conditions, shorter length of stay, and more primary level ED use. Cellulitis was a frequent and significant diagnosis in this group, whereas the discharge diagnoses observed in *Stable *and Increasing were more commonly those for which further investigation (e.g., bloodwork, imaging) or treatment (e.g., analgesia, bronchodilator) would typically be indicated in the ED. This inference reflects the expected clinical management of such conditions rather than observed interventions within this dataset. The patient and visit characteristics of Increasing and *Stable *were similar.
Previous studies
To our knowledge, this is the first study to describe frequent ED attenders among older adults based on their temporal pattern of use. Previous research in this population has classified subgroups based on health care utilization and/or patient characteristics [25-27]. These studies identified a subgroup with low comorbidity or who presented to the ED with minor complaints [25, 26] for which we found a comparable group (No Admission cohort) and further classified them as Stable,* Increasing*, and Hyperacute. Dufour identified a subgroup of frequent users with pulmonary and cardiac conditions [26]; in our study, COPD was a frequent diagnosis in both Stable and Increasing groups.
Clinical implications
Our study identified a group of patients such as the* Hyperacute *group who could use an alternative care setting to reduce the number of ED visits. Likewise, COPD was a frequent diagnosis and better outpatient management could help to reduce overall ED use.
The reliance on the ED for follow-up care and the use of multiple EDs suggest that the care of this population is fragmented. Return visits for reassessment, imaging, and consultation accounted for 11.3% (5782 visits) of all ED visits in our sample. All trajectories had patients with at least one expected return visit (6.8-20.9%). We did not find literature on the use of the ED for ongoing care and evaluation. Much of the literature has looked at access to primary care as a driver of avoidable ED use [28-30]; however, in our study, expected return visits suggest a lack of access to higher levels of care (e.g., imaging, consultation). In the Admission cohort, 34 % of patients used more than one ED. This cross-facility use constrains the ability of a single institution to identify frequent users and may, in part, be driven by ambulance distribution protocols.
Research implications
Further study to determine whether these trajectories are associated with different levels of adverse outcome may assist ED physicians in identifying patients for admission or earlier community follow-up. We were unable to differentiate trajectory membership based on the variables available to us, and future work could look at chronic disease, disease severity, frailty, and place of residence.
As our dataset contained all insured ED visits in the province, we were able to create a complete portrait of ED use of our study population. Our findings may not be generalizable to other practice settings; however, we demonstrated the utility of GBTM for exploring patterns of use, with potential application in other health systems. While the data were 10 years old, the challenges are likely to be similar and potentially magnified given the increase of ED visits of older adults over time.
The data did not include length of stay for hospital admissions, which would decrease the number of patients available to re-present to the ED in the Admission cohort; however, we believe the shape of trajectories would not change. Transfers could also have impacted the trajectories as these visits would have another visit closely associated in time. The transfer rate was low (4.4% of all visits), and we noted that it had a negligible impact on the model. The dataset was limited to the presenting complaint and discharge diagnosis and did not include past medical history. As a result, the presence of chronic illness may have been underestimated, as conditions not captured in ED discharge diagnoses would not have been identified. A limitation when using administrative data is the potential for misclassification of the diagnostic codes (ICD-10) either from incorrect data entry or from individual institutional coding practices. We elected to retain the original coding rather than aggregating codes in order to avoid introducing bias. There was no information on disease severity or on place of residence (i.e., community dwelling or institution).
Conclusions
We described distinct trajectories of ED use over time among older adults with three or more visits within a 90-day period. The identified patterns - Stable, Increasing, and Hyperacute - suggest clinically distinct patient subgroups with unique challenges in accessing care, underscoring the potential for trajectory-specific interventions. Although based on data from 2014-2015, the findings remain relevant given the ongoing demographic shift toward an older population and the sustained pressures on ED capacity. By focusing on frequent use over a shorter interval (90 days vs. 365 days), we identified a more clinically relevant subgroup for emergency physicians, offering insights to better identify high-risk patients and to tailor interventions to improve patient care and resource utilization.
The reference list from the paper itself. Each links out to its DOI / PubMed record.
- 1NACRS Emergency Department Visits: Volumes and Median Lengths of Stay, 2003-2004 to 2021-2022 — Supplementary Statistics Ottawa, ON 3 2025 2022 https://www.cihi.ca/en/nacrs-emergency-department-visits-and-lengths-of-stay
- 2Efficacy of emergency department-based interventions designed to reduce repeat visits and other adverse outcomes for older patients after discharge: a systematic review Geriatr Gerontol Int Karam G Radden Z Berall LE Cheng C Gruneir A 110711171520152617155410.1111/ggi.12538 PMC 5008161 · doi ↗ · pubmed ↗
- 3Unplanned early return to the emergency department by older patients: the Safe Elderly Emergency Department Discharge (SEED) project Age Ageing Lowthian J Straney LD Brand CA 2552614520162676425410.1093/ageing/afv 198 · doi ↗ · pubmed ↗
- 4Predictors of admission after emergency department discharge in older adults J Am Geriatr Soc Gabayan GZ Sarkisian CA Liang LJ Sun BC 39456320152553707310.1111/jgs.13185 PMC 5117639 · doi ↗ · pubmed ↗
- 5Prediction of 90-day mortality in older patients after discharge from an emergency department: a retrospective follow-up study BMC Emerg Med Hofman SE Lucke JA Heim N 261620162741224310.1186/s 12873-016-0090-5PMC 4944462 · doi ↗ · pubmed ↗
- 6Early death after discharge from emergency departments: analysis of national US insurance claims data BMJ Obermeyer Z Cohn B Wilson M Jena AB Cutler DM 0356201710.1136/bmj.j 239PMC 616803428148486 · doi ↗ · pubmed ↗
- 7Frequent users of Massachusetts emergency departments: a statewide analysis Ann Emerg Med Fuda KK Immekus R 9164820061678191510.1016/j.annemergmed.2006.03.001 · doi ↗ · pubmed ↗
- 8High prevalence of frequent attendance in the over 65s Eur J Emerg Med Mc Mahon CG Power Foley M Robinson D O'Donnell K Poulton M Kenny RA Bennett K 53572520182713992810.1097/MEJ.0000000000000406 · doi ↗ · pubmed ↗