Nutritional status and associated factors among adolescents in Senegal: a nationwide cross-sectional study
Mariame Sy, Adama Diouf, Abdou Badiane, Maty Diagne Camara, Abdoulaye Diagne, Nicole Idohou-Dossou

TL;DR
This study examines the nutritional status of Senegalese adolescents and finds high rates of underweight in rural areas and overweight in urban areas, highlighting the need for targeted interventions.
Contribution
The study provides the first nationwide data on nutritional status and associated factors among Senegalese adolescents.
Findings
21.7% of adolescents were underweight, with higher rates in rural areas and among boys aged 10–14 years.
Female gender and urban residence were associated with increased risk of overweight and obesity.
Skipping meals and snacking were linked to higher risks of underweight and abdominal obesity.
Abstract
Adolescents are a vulnerable group as they undergo rapid physical changes that can impact their nutritional status. Despite the implementation of some interventions addressing adolescent nutrition in Senegal, there remains a lack of comprehensive data on their nutritional status. This study aimed to assess nutritional status and associated factors among Senegalese adolescents aged 10–19 years. This cross-sectional study was part of the national food consumption survey, which was conducted among children aged 24–59 months, adolescents aged 10–19 years and adults aged 20 years and older. The study was conducted in Senegal at the national level, in rural and urban areas, from July to November 2021. 1433 adolescents, boys and girls aged 10–19 years were randomly selected from 1800 households in 150 census districts. Nutritional status was assessed using body mass index for age z-score…
Genes, proteins, chemicals, diseases, species, mutations and cell lines named across the full text — each resolved to its canonical identifier and authoritative record.
Click any figure to enlarge with its caption.
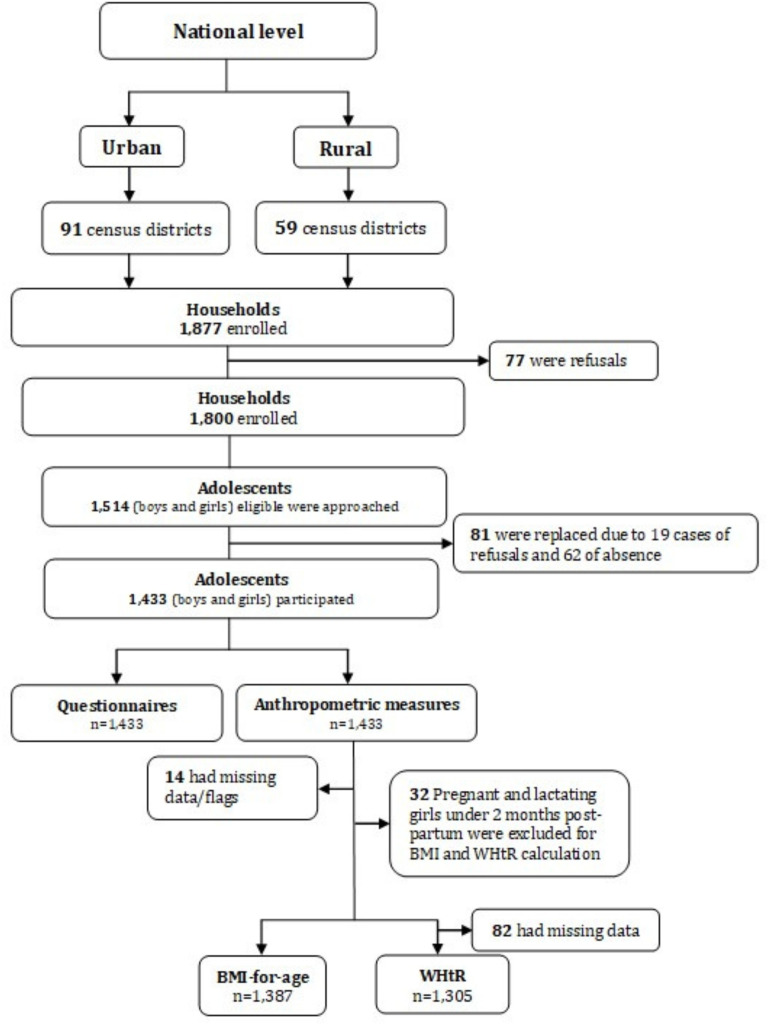 Figure 1
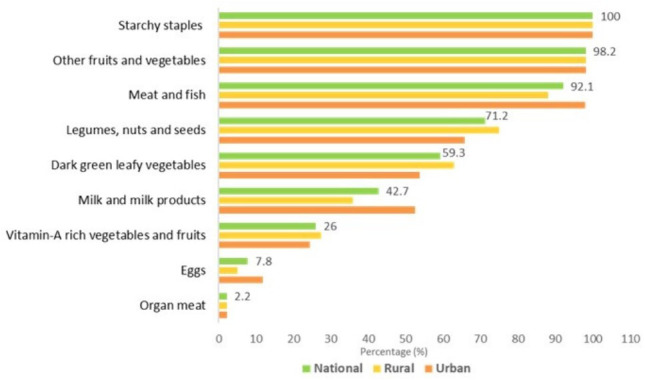 Figure 2
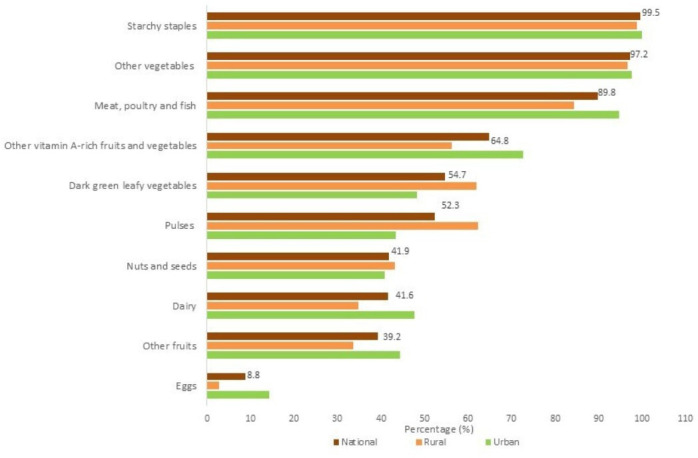 Figure 3
| National | Rural | Urban | P value | |
|---|---|---|---|---|
| Age (years), M±SD | 14.25±2.81 | 13.96±2.43 | 14.6±3.16 | 0.040 |
| Age group (years), % (n) | 0.002 | |||
| 10–14 | 52.7 (737) | 57.1 (332) | 47.0 (405) | |
| 15–19 | 47.3 (696) | 42.9 (267) | 53.0 (429) | |
| Gender, % (n) | 0.087 | |||
| Boys | 46.6 (625) | 49.1 (287) | 43.4 (338) | |
| Girls | 53.4 (808) | 50.9 (312) | 56.6 (496) | |
| Stage of adolescence (years), % (n) | ||||
| Early 10–13 | 43.4 (604) | 48.6 (284) | 36.7 (320) | 0.000 |
| Intermediate 14–17 | 38.7 (559) | 34.9 (208) | 43.5 (351) | 0.008 |
| Late 18–19 | 17.9 (270) | 16.5 (107) | 19.8 (163) | 0.178 |
| Education, n (%) | ||||
| Yes | 79.6 (1167) | 71.1 (418) | 90.5 (749) | 0.000 |
| Level of education, % (n) | ||||
| Primary | 45.5 (519) | 48.6 (192) | 42.3 (327) | 0.150 |
| Medium | 25.0 (321) | 14.8 (66) | 35.3 (255) | 0.000 |
| Secondary | 10.2 (134) | 5.3 (25) | 15.2 (109) | 0.000 |
| Daara/non-formal education | 10.4 (96) | 18.3 (75) | 2.5 (21) | 0.000 |
| Arabic school | 7.3 (77) | 11.5 (54) | 3.0 (23) | 0.002 |
| Others | 1.6 (20) | 1.5 (6) | 1.7 (14) | 0.806 |
| Socioeconomic status, % (n) | ||||
| Lowest | 18.0 (281) | 27.1 (196) | 6.4 (85) | 0.000 |
| Second | 17.3 (270) | 20.0 (130) | 13.9 (140) | 0.009 |
| Intermediate | 19.6 (287) | 21.3 (123) | 17.6 (164) | 0.132 |
| Fourth | 20.5 (290) | 16.1 (86) | 26.1 (204) | 0.001 |
| Highest | 24.6 (305) | 15.6 (64) | 36.0 (241) | 0.000 |
| National | Rural | Urban | P value | |
|---|---|---|---|---|
| % (n) | % (n) | % (n) | ||
| Number of meals eaten/day | 11.7 (164) | 11.5 (61) | 12.0 (103) | 0.827 |
| Less than three meals | ||||
| Meals taken at home on weekdays | ||||
| Breakfast | 95.6 (1324) | 98.1 (570) | 92.4 (754) | 0.000 |
| Lunch | 98.2 (1374) | 99.9 (589) | 96.0 (785) | 0.000 |
| Dinner | 97.7 (1368) | 97.8 (572) | 97.7 (796) | 0.900 |
| Meals taken at home on weekends | ||||
| Breakfast | 98.9 (1371) | 99.2 (576) | 98.5 (795) | 0.238 |
| Lunch | 99.6 (1393) | 99.7 (588) | 99.4 (805) | 0.356 |
| Dinner | 99.1 (1377) | 99.7 (578) | 98.5 (799) | 0.028 |
| Taking meals out of home | ||||
| Yes | 26.7 (392) | 20.4 (120) | 34.8 (272) | 0.000 |
| Place where meals were taken out of home | ||||
| Stallholder/street vendor | 12.7 (179) | 11.2 (64) | 14.6 (115) | 0.241 |
| School/service canteen | 4.8 (75) | 2.3 (10) | 7.9 (65) | 0.000 |
| Small local eatery | 2.7 (51) | 1.6 (9) | 4.1 (42) | 0.008 |
| Fast food | 1.6 (34) | 0.0 (0) | 3.7 (34) | 0.000 |
| Modern restaurant | 1.1 (25) | 0.1 (1) | 2.3 (24) | 0.000 |
| Others | 8.1 (110) | 7.8 (50) | 8.5 (60) | 0.680 |
| Snacking | ||||
| Yes | 60.3 (894) | 55.5 (345) | 66.4 (549) | 0.011 |
| Frequency of snacking | ||||
| At least once a day | 54.2 (511) | 49.6 (185) | 59.0 (326) | 0.087 |
| 4 to 6 times/week | 25.6 (213) | 26.8 (84) | 24.2 (129) | 0.562 |
| 1 to 3 times/week | 17.3 (151) | 20.8 (68) | 13.7 (83) | 0.080 |
| 1 to 3 times/month | 2.5 (18) | 2.8 (8) | 2.2 (10) | 0.715 |
| Once a month | 0.4 (1) | 0.0 (0) | 0.8 (1) | – |
| Alcohol drinking | ||||
| Yes | 0.6 (16) | 0.2 (3) | 1.1 (13) | 0.033 |
| Smoking | ||||
| Yes | 0.6 (7) | 1.0 (6) | 0.1 (1) | 0.070 |
| Consumption of dietary supplements | ||||
| During the survey | 3.7 (72) | 2.6 (19) | 5.2 (53) | 0.023 |
| Last month before the survey | 74.8 (55) | 68.3 (13) | 78.9 (42) | 0.341 |
| All | Adolescent girls | Other adolescents | |
|---|---|---|---|
| Dietary Diversity Score, M±SD | 5.23±1.28 | 5.89±1.46 | 4.99±1.13 |
| Adequate DD (≥5 food groups), % (n) | 72.1 (1026) | 83.9 (388) | 68.0 (688) |
| Inadequate DD (<5 food groups), % (n) | 27.9 (407) | 16.1 (67) | 32.0 (340) |
| BMI z-score, % (n) | ||||||
|---|---|---|---|---|---|---|
| N | Underweight | Overweight | Obesity | Abdominal obesity | ||
| n=287 | n=79 | n=30 | N | n=64 | ||
| National | 1387 | 21.7 (287) | 5.9 (79) | 1.8 (30) | 1305 | 5.0 (64) |
| Area of residence | ||||||
| Rural | 572 | 26.6 (155) | 4.3 (19) | 0.7 (5) | 541 | 3.7 (16) |
| Urban | 815 | 15.5 (132) | 7.8 (60) | 3.1 (25) | 764 | 6.8 (48) |
| P value | – | < 0.001 | < 0.05 | 0.004 | – | 0.047 |
| Gender | ||||||
| Boys | 620 | 26.6 (160) | 2.1 (17) | 1.1 (8) | 619 | 1.8 (14) |
| Girls | 767 | 17.1 (127) | 9.4 (62) | 2.5 (22) | 686 | 8.5 (50) |
| P value | – | < 0.001 | < 0.001 | 0.091 | – | 0.000 |
| Age (years) | ||||||
| 10–14 | 732 | 24.7 (180) | 5.7 (39) | 2.0 (16) | 658 | 4.0 (24) |
| 15–19 | 655 | 18.1 (107) | 6.1 (40) | 1.5 (14) | 647 | 6.2 (40) |
| P value | – | < 0.05 | 0.804 | 0.473 | – | 0.229 |
| Stage of adolescence (years) | ||||||
| 10–13 | 599 | 25.8 (157) | 6.0 (35) | 2.1 (12) | 526 | 4.0 (20) |
| 14–17 | 547 | 20.2 (97) | 5.3 (28) | 1.8 (14) | 541 | 5.4 (28) |
| 18–19 | 241 | 14.1 (33) | 7.0 (16) | 1.0 (4) | 238 | 6.0 (16) |
| P value | – | < 0.01 | 0.797 | 0.414 | – | 0.465 |
| Education | ||||||
| Yes | 1136 | 21.2 (229) | 6.2 (69) | 2.0 (27) | 1068 | 5.6 (58) |
| No | 251 | 23.6 (58) | 4.4 (10) | 1.1 (3) | 237 | 2.7 (6) |
| P value | – | 0.547 | 0.281 | 0.328 | – | 0.057 |
| Wealth quintile | ||||||
| Lowest | 228 | 23.2 (65) | 4.3 (11) | 1.2 (4) | 257 | 2.9 (10) |
| Second | 292 | 26.0 (62) | 4.8 (12) | 0.5 (3) | 250 | 3.1 (8) |
| Intermediate | 279 | 19.8 (53) | 3.7 (16) | 0.6 (2) | 263 | 1.8 (6) |
| Fourth | 283 | 19.5 (52) | 7.8 (19) | 2.4 (6) | 259 | 8.0 (16) |
| Highest | 295 | 20.8 (55) | 7.9 (21) | 3.6 (15) | 276 | 8.2 (24) |
| P value | – | 0.473 | 0.270 | 0.078 | – | 0.010 |
| Number of meals eaten per day | ||||||
| Less than three meals | 159 | 25.1 (31) | 8.2 (12) | 2.6 (7) | 149 | 11.2 (17) |
| Three meals | 1228 | 21.2 (256) | 5.6 (67) | 1.7 (23) | 1256 | 4.2 (46) |
| P value | – | 0.358 | 0.327 | 0.429 | – | 0.022 |
| Snacking | ||||||
| Yes | 867 | 23.8 (189) | 5.6 (46) | 1.7 (16) | 810 | 4.3 (35) |
| No | 520 | 18.4 (98) | 6.3 (33) | 1.9 (14) | 495 | 6.2 (29) |
| P value | – | 0.043 | 0.724 | 0.770 | – | 0.257 |
| Frequency of snacking | ||||||
| At least once a day | 495 | 22.5 (110 | 3.3 (19) | 2.4 (11) | 467 | 3.2 (18) |
| Four to six times/week | 209 | 29.0 (53) | 12.1 (19) | 1.4 (4) | 192 | 9.9 (6) |
| Once to three times/week | 145 | 23.6 (25) | 4.1 (8) | 0.3 (1) | 134 | 0.3 (1) |
| Once to three times/month | 17 | 1.7 (1) | 0.0 (1) | 0.0 (1) | 16 | 0 (0.0) |
| Once a month | 1 | 0.0 (0) | 0.0 (0) | 0.0 (0) | 1 | 0 (0.0) |
| P value | – | < 0.0001 | < 0.0001 | < 0.05 | – | < 0.05 |
| OR | 95% CI | P value | |
|---|---|---|---|
| Underweight | |||
| Area of residence | |||
| Urban | 1 | Ref | |
| Rural | 1.91 | 1.35 to 2.68 | 0.000 |
| Sex | |||
| Girls | 1 | Ref | |
| Boys | 1.74 | 1.25 to 2.41 | 0.001 |
| Age group (years) | |||
| 15–19 | 1 | Ref | |
| 10–14 | 1.44 | 1.00 to 2.07 | 0.049 |
| Taking lunch daily | |||
| Yes | 1 | Ref | |
| No | 2.28 | 1.29 to 4.03 | 0.005 |
| Snacking | |||
| Yes | 1.51 | 1.06 to 2.14 | 0.020 |
| No | 1 | Ref | |
| Illness during the last month | |||
| Yes | 1.76 | 1.24 to 2.48 | 0.001 |
| No | 1 | Ref | |
| Diarrhoea | |||
| Yes | 4.86 | 1.29 to 18.32 | 0.020 |
| No | 1 | Ref | |
| Overweight | |||
| Gender | |||
| Girls | 4.68 | 2.39 to 9.16 | 0.000 |
| Boys | 1 | Ref | |
| Obesity | |||
| Area | |||
| Urban | 4.08 | 1.36 to 12.25 | 0.013 |
| Rural | 1 | Ref | |
| Dietary supplement consumption | |||
| Yes | 3.89 | 1.11 to 13.65 | 0.034 |
| No | 1 | Ref | |
| Abdominal obesity | |||
| Gender | |||
| Girls | 5.28 | 2.57 to 10.85 | 0.000 |
| Boys | 1 | Ref | |
| Taking breakfast daily | |||
| Yes | 1 | Ref | |
| No | 4.55 | 2.10 to 9.85 | 0.000 |
- —http://dx.doi.org/10.13039/501100000193International Development Research Centre
- —Food and Agriculture Organization
Peer Reviews
No public reviews on file for this paper yet. If you reviewed it on a platform where reviews are public (OpenReview, ICLR, NeurIPS, ICML), you can paste yours below so the community can read it here.
Videos
No videos yet. Explain this paper in a talk, walkthrough, or lecture? Add one.
Taxonomy
TopicsChild Nutrition and Water Access · Obesity, Physical Activity, Diet · Nutrition, Health, and Society Studies
Introduction
Background
The WHO defines adolescence as the period between 10 years and 19 years characterised by a high rate of growth and significant psychological changes.1 This transitional period between childhood and adulthood is often called an ‘added window of opportunity’ for life cycle growth and development.2 3 At this stage of life, adolescent nutritional requirements are significantly increased and changes in body compositions are notable, making adolescents particularly vulnerable to malnutrition.4 Many countries are facing the double burden of malnutrition among adolescents, particularly in low and middle-income regions.
Globally, in 2019, underweight affected 10.3% of adolescents5 and has slightly decreased since 2010 in both boys and girls,6 while overweight and obesity have increased worldwide from 14.4% to 20.2% in boys and from 13.8% to 18.4% in girls between 2010 and 2019.6 In Africa, 10.3% of adolescents are underweight.5 Moreover, recent trends highlight increasing prevalence of overweight among boys (6.5%) and girls (4.7%), as well as obesity in boys (2.5%) and girls (3.9%).7
Malnutrition during adolescence can result in decreased mental capacities and school attendance.8 Poor nutritional status, particularly among adolescent girls, can negatively affect reproductive health outcomes and sustain the intergenerational cycle of malnutrition, leading to consequences such as low birth weight. Undernutrition during adolescence not only impairs an individual’s working capacity in adulthood but also undermines the future socioeconomic development of a nation. Both undernutrition and overnutrition during adolescence can severely compromise quality of life and survival, with notable economic repercussions and increased mortality.9 10 The global rise in adolescent obesity could be attributed to unhealthy dietary practices.11 12 Indeed, urbanisation characterised by a nutritional transition has the potential to expose adolescents to unhealthy dietary patterns, such as high consumption of saturated fats, sugars, salt and ultraprocessed foods.13 14
In Senegal, adolescent nutrition has been relatively neglected. Most nutrition programmes or interventions have prioritised children under 5 years of age and women of reproductive age, with little focus on adolescents. Despite the inclusion of girls aged 15–19 years within the women of reproductive age, little attention has been given to the nutritional knowledge and status of adolescents. Interventions targeting adolescents are more focused on reproductive health. Indeed, the country has aligned its priorities and interventions with global challenges, primarily targeting women and children for several decades, while adolescent nutrition has only recently gained attention but remains insufficiently addressed. Therefore, there is no national programme for managing adolescent malnutrition.15 16 Despite the implementation of some nutritional interventions such as iron and folic acid supplementation and deworming at school, and while a few small studies have been conducted, no study has been carried out to assess the prevalence and determinants of malnutrition among adolescents at the national level. Those studies have mostly been conducted in Dakar17 18 and revealed 0.7% obesity among schoolchildren aged 5–17 years and 29.6% underweight.19 Most of the studies include only the 15–19 years age group, as they are usually conducted among women of reproductive age. Moreover, most of the studies did not address dietary patterns and health status among adolescents, making it difficult to explore the whole adolescence target group findings.15 20
To effectively address adolescent malnutrition, there is an urgent need to provide evidence-based data to guide decision-making and to accelerate progress towards global goals.
Objectives
This study aimed to assess the nutritional status and its underlying factors among adolescents in Senegal.
Methods
Study design and setting
This nationwide cross-sectional study was part of the food consumption survey conducted among adolescents 10–19 years, children 24–59 months, and adults 20 years and over from July to November 2021. A probabilistic sampling method was employed using a three-stage stratified design. Census districts (CDs) were selected as the primary sampling units. In the second stage, 12 households with at least one adolescent were randomly selected within each CD using a sampling interval of 10. In the third stage, one adolescent was randomly selected from the eligible adolescents living in selected households. This multistage sampling approach allowed the representation of adolescents across diverse geographical, cultural and socioeconomic contexts in Senegal. A total of 150 CDs were randomly selected from urban (91 CDs) and rural (59 CDs) areas of residence. The number of households to be enrolled was determined considering the proportion of children as the rarest target group. A total of 1800 households, including 1091 in urban areas and 709 in rural areas, were therefore targeted.
Before conducting the survey, all the local authorities were informed and an awareness campaign was carried out in the targeted areas. The potentially eligible households were contacted through the community health workers with the support of local and health authorities. In cases where selected households declined participation, they were systematically replaced, with the replacement units drawn strictly from within the same CD. To ensure full consistency with the original design, the identical sampling interval used in the primary selection process was applied during substitution.
Eligibility criteria
Adolescents, boys and girls, in and out of school and who were apparently healthy were enrolled, except those with mental and physical disabilities for anthropometric measures.
Data sources/measurement
Two structured questionnaires were administered to the household’s head and adolescents or their tutors. The questionnaires were implemented on a Computer Assisted Personal Interviewing (CAPI) application developed under CSPro Software V.7.5 (United States Census Bureau, USA). At household level, socioeconomic data such as household expenditures were collected to define the household’s economic status (wealth quintile) based on five categories (lowest, second, intermediate, fourth and highest). Among the adolescents, the questionnaire focused on health data particularly on the adolescent’s sociodemographic characteristics, illnesses during the last month before the survey, dietary diversity and habits.
Dietary diversity and habits
Data on dietary habits were collected to identify eating behaviours such as mealtimes and frequency of consumption, snacking and dietary supplement intake. Additionally, foods consumed over the 24-hour recall were used to define the Dietary Diversity Score (DDS). According to the Food and Agriculture Organization recommendations, since adolescent girls aged 15–19 years are considered in the 15–49 years age group of women of reproductive age, the 10 food groups were used to calculate their DDS. For the other adolescents consisting of boys aged 10–19 years and girls aged 10–14 years, the 9 food groups were used to assess the DDS for individuals.21 22
The DDS for all adolescents was classified as adequate (minimum DDS) and inadequate based on a cut-off of five food groups.
Anthropometry
Weight, height and waist circumference (WC) were measured among adolescents using standard procedures.23 Body weight was measured with a very light outfit using an electronic scale with a maximum range of 150 kg (Seca 874, Gmbh & Co, Hamburg, Germany). Height was measured standing on a portable stadiometer (Seca 216, Gmbh & Co, Hamburg Germany). A long inextensible tape was used to measure WC. All measurements were performed in duplicate. Adolescents’ nutritional status was defined based on body mass index for age (BMI-for-age) z-score and waist-to-height ratio (WHtR). Prevalence of underweight, overweight and obesity was determined using the WHO growth reference.24 WHtR greater than or equal to 0.5 was used to define abdominal obesity.25 26
Bias
Measurement errors were first minimised during the preparatory phase through comprehensive enumerator training, which included a standardisation session to ensure the accuracy of anthropometric measurements. In addition, a pilot study was conducted to test and refine data collection tools and procedures. During data collection, errors were further minimised through close supervision. Data collected by well-trained enumerators (lead and assistant measurers) were checked in the field by team supervisors to ensure compliance with standard procedures. Moreover, daily feedback was provided, allowing for the correction of identified errors before leaving the CDs. Adolescents who had missing data were also excluded from the statistical analysis.
Study size
The sample size was calculated based on the Deitchler et al methodology using a simulation of nutrient intakes in middle-income countries.27 The sampling approach was based on the target group rather than the household, since the food consumption survey focused on three target groups including adolescents’ group. A minimum random sample of 200 respondents, adjusted for design effect and non-response, was considered sufficient to estimate most nutrients with acceptable precision. Using a design effect of 2 and a 5% non-response rate, a minimum of 420 adolescents per area of residence was required.
A non-response rate of 5% was adopted, as recommended by the National Agency for Statistics and Demography, which reported that non-biological studies conducted in Senegal typically achieve response rates of approximately 95%–98%. Considering the estimated proportion of Senegalese adolescents (0.8), with respective proportions of 0.6 and 0.75 for urban and rural areas, a final sample size of 1199 adolescents was determined. In cases of absence or refusal, adolescents were systematically replaced by others randomly selected from the list of eligible adolescents within the same households.
Quantitative variables
Age was categorised to create new categorical variables: age group and stage of adolescence. Weight and height were used to categorise BMI-for-age z-score and height and waist circumference (WC) to assess the abdominal obesity status using WHtR.
Statistical analysis
Statistical processing and data analysis were performed using Microsoft Excel V.2016 and STATA V.16. Anthropometric data were converted to BMI-for-age z-score using the macro of the STATA igrowup package.24 Data were weighted to ensure representativeness. Frequencies, proportions and means were used to describe the results. Descriptive analysis was used to describe the socioeconomic, sociodemographic, anthropometric, health status and dietary characteristics of adolescents. Comparisons of mean values and prevalence were made by analysis of the Wald test. Bivariate analysis was initially performed to identify the factors associated with the dependent variables (underweight, overweight, obesity and abdominal obesity) in adolescents. Then, logistic regression models were used to examine the potential predictors of nutritional status. A value of p<0.05 was considered statistically significant for all statistical analyses. Model goodness-of-fit was performed using the Hosmer and Lemeshow test.
Patient and public involvement
None.
Results
A total of 77 out of the 1800 households did not give their approval or were unavailable at the time of the survey. Out of 1514 eligible adolescents approached within these households, 1433 participated in the survey. The response rate of the study was 94.6% due to 19 cases of refusal and 62 cases of absence. BMI-for-age z-score and WHtR were calculated in 1387 and 1305 adolescents, respectively (figure 1).
Study profile flow chart. BMI-for-age, body mass index-for-age; WHtR, waist-to-height ratio.
Demographic and socioeconomic-related characteristics
The mean age of the adolescents was 14.2±2.8 years. Moreover, 4 out of 10 adolescents were in the early adolescence stage, 38.7% in the middle stage and 17.9% in the late stage. Adolescents were mainly girls (53.4%). A higher proportion of adolescents were educated (79.6%) and 45.5% had reached over primary-level education. Overall, 18% of the adolescents lived in households belonging to the poorest wealth quintile and 24.6% of them to the richest (table 1). Most adolescents from the poorest and second wealth quintiles resided in rural areas (p<0.01).
Eating habits
Nearly 90% of Senegalese adolescents consumed three main meals daily and this trend was also observed in both rural and urban areas (table 2). Breakfast and lunch were more taken at home on weekdays in rural areas than urban areas (p<0.001). About 27% of adolescents ate outside the home, mainly purchasing food from street vendors and school canteens. Furthermore, 60.3% of adolescents reported snacking, with 55.4% of them at least once a day. This practice was significantly higher in urban areas (66.4%) than in rural areas (55.5%) (p<0.05). Over 74% of the adolescents reported having consumed dietary supplements in the month preceding the survey. Overall, 0.6% of the adolescents reported consuming alcoholic beverages, and less than 1% smoked.
Dietary diversity
Starchy staple foods were widely consumed by adolescents. Most of them aged 10–19 years and girls aged 10–14 years reported having consumed other fruits and vegetables (98.2%), meat and fish (92.1%). The least consumed foods included organ meat (2.2%) and eggs (7.8%). However, rural adolescents consumed significantly more dark green leafy vegetables (p<0.05), legumes, nuts and seeds (p<0.05), whereas those living in urban areas ate more meat, poultry and fish (p<0.01), eggs (p<0.01) and milk, and milk products (p<0.01). For girls aged 15–19 years, the other major food group consumed in addition to starchy staples (99.5%) was the other vegetables group (97.2%) and the least consumed group was eggs (8.8%) (figures23).
Consumption of nine food groups by adolescent boys aged 10–19 years and girls aged 10–14 years.
Consumption of 10 food groups by adolescent girls aged 15–19 years.
The mean DDS of adolescents was 5.23±1.28. The mean DDS in girls aged 15–19 years was 5.89 and 4.99 for the other adolescents (table 3). Around 72% of adolescents met the minimum dietary diversity (MDD). Nearly 16% of adolescent girls aged 15–19 years and 32.0% of other adolescents had not met the MDD.
Nutritional status
Nearly 23% of adolescents were underweight, 5.9% were overweight and obesity and abdominal obesity affected 1.8% and 5% of them, respectively (table 4). Underweight was significantly higher in rural (26.6%) than in urban areas (15.5%) (p<0.001). Boys were more affected than girls (p<0.001), and adolescents aged 10–14 years were more affected than older adolescents (p<0.05). Besides, overnutrition was significantly higher in urban areas compared with rural areas (p<0.05). Overweight and obesity affected 7.8% and 3.1% of adolescents in urban areas, respectively, and 6.8% of urban adolescents suffered from abdominal obesity. Girls were particularly suffering from overweight (9.4%) and abdominal obesity (8.5%) compared with boys (p<0.001). Overweight and obesity affected more adolescents living in the highest quintile (7.9% and 3.6%, respectively). Adolescents living within the highest wealth quintile were also more affected by abdominal obesity than others (p<0.05).
Factors associated with nutritional status
Multivariate logistic regression model factors that were independently associated with greater prevalence of underweight were boys, rural area and health status. The 10–14 years age group (OR=1.44; p<0.05), male gender (OR=1.74; p<0.001), skipping lunch daily (OR=2.28; p<0.01), snacking (OR=1.51; p<0.05), illness during the previous month (OR=1.78; p<0.01) and having diarrhoea (OR=4.86; p<0.05) increased the risk of being underweight. On the other hand, girl gender was a predictor of being overweight (OR=4.68; p<0.001) and suffering from abdominal obesity (OR=5.28; p<0.001). Urban adolescents were 59% more likely to be obese (p<0.05), whereas rural adolescents were more at risk of underweight (OR=1.91; p<0.01). Consuming dietary supplements had greater odds of being obese (OR=3.89; p<0.05). Adolescents who did not take breakfast daily had 4.5 times more risk of suffering from abdominal obesity (p<0.01) (table 5).
Discussion
This study is the first nationwide study to examine sociodemographic, dietary and lifestyle associated factors for both underweight and overweight/obesity among Senegalese adolescents aged 10–19 years. The key findings of the study have demonstrated the existence of the double burden of malnutrition among adolescents in Senegal. The prevalence of underweight found in this study (21.7%) exceeds the latest trends revealed by the Global Nutrition Report7 and Fiorentino et al18 in Senegal. This prevalence was also higher than those found in surveys in Gambia,28 Ethiopia29 and India.30 These differences may primarily reflect the broader age range (10–19 years) and the anthropometric indices used. Indeed, most previous studies focused on adolescents aged 15–19 years. In addition, using WHO-recommended BMI-for-age rather than the BMI commonly used in previous studies may explain some differences, though no consensus has yet been established on anthropometric indicators.9 Our findings also revealed that adolescents living in rural areas were more likely to be affected by underweight than those in urban areas. This may be due to the poor living conditions in rural areas in Senegal and the limited access to health services.
Notably, similar findings were observed in Tanzania31 and India.32 In our study, the higher prevalence found in boys compared with girls was in line with those reported by several authors in African adolescents33 and among Indonesian adolescents.34 In addition, we found that adolescent boys were more exposed to underweight than girls. Mixed results and contrasting findings were reported by Anand and Sharma,32 in a systematic review in sub-Saharan Africa35 and in Denmark.36 The high prevalence of undernutrition among boys may be attributed to the difference in the physiological maturation period of adolescent boys and girls. Indeed, adolescent girls generally reach maturation earlier than boys, resulting in increased dietary requirements and energy expenditure. Another reason may be the distribution of body composition during adolescence, with boys having about twice the fat-free mass of girls.3739
Our study reported a greater association between underweight and illness. Thus, being ill during the past 4 weeks and having diarrhoea were found to be predictive of adolescent underweight. In fact, diseases are immediate causes of malnutrition.
The study also revealed that skipping lunch regularly increased the risk of being underweight. This finding is consistent with the study conducted by Ali et al40 in Ethiopia and may be explained by the tendency of this habit to reduce dietary intake, thereby increasing the risk of underweight among adolescents. Snacking was found to be a common dietary habit. A higher proportion was also reported in Ghanaian high school adolescents (86.1%).41 Snacking may result from a preference for snacks or a dislike of available foods.41 Our study found that snacking predicted undernutrition, likely due to decreased food intake during main meals.41 In addition, adolescence is a period marked by specific dietary habits, especially snacking due to preferences and peer influence. Adolescents, especially in urban areas, often adopt snacking habits influenced by peers and long hours spent outside the home, which may result in skipped meals, particularly breakfast.
Besides, the prevalence of overweight was around 6% in our study. A similar and recent finding was reported in Ghana by Wiafe et al.42 Greater prevalences were found in previous studies carried out in some African countries.43 44 Trends at the global level showed that overweight has increased from 7.5% to 11.7% between 2000 and 20165 and is low. The discrepancy between prevalences in these studies can be explained by the use of BMI in some studies and BMI-for-age in this study. BMI-for-age is known to be a better indicator than BMI in adolescents due to the fact that it takes account of these normal variations, providing a more accurate assessment of nutritional status.45 46 This study also highlighted overweight regarding gender and has shown that girls suffered more from overweight than boys, which agreed with previous reports in Dakar, Senegal.19 Some studies reported higher prevalence in boys rather than girls in north-eastern China.47 Interestingly, in our study, girls were found four times more likely to be overweight than boys, probably because fat mass increases more rapidly in girls36 and the limited opportunities for physical activity.48 On the other hand, our findings in obesity (1.8%) are also consistent with studies conducted in Senegal19 and Nigeria.49 A recent meta-analysis in seven countries of sub-Saharan Africa, that showed 3.2% of obesity, was also in contrast to our finding.50 This present study also highlighted gender disparities and higher prevalence of obesity in girls rather than boys, and the results were similar to previous findings reported in the Global Nutrition Report.7 We also found that adolescents living in urban areas were more likely to be obese than rural adolescents, probably due to the high consumption of fatty foods in urban environments characterised by a nutrition transition. Indeed, urbanisation is increasing the variety of retail food outlets available to consumers, especially adolescents, including bakeries, restaurants, supermarkets, street vendors and traditional open-air markets.51
Our study brings forward the information that consumption of dietary supplements was associated with higher odds of obesity. To our knowledge, there is no study that has clearly demonstrated the relationship between obesity and dietary supplement intake in adolescents. But this may be due to the fact that supplements increase the appetite and dietary intake of adolescents. Another finding in overnutrition in this study is related to abdominal obesity which affects 3.7% of adolescents. Abdominal obesity increases cardiometabolic risk,52 53 and the prevalence found in this study may be the result of food transition in Senegal, the high consumption of fatty foods and the lack of physical activity among adolescents. Greater rates were found in Nigeria (37.2%).54 Differences in prevalence can be explained by the difference in the indicators used. In fact, in some studies, waist-to-hip ratio (WHR) or WC were used whereas WHtR was used to assess abdominal obesity in our study. Even though there is still no consensus on an international WC threshold for abdominal obesity in children and adolescents, some studies clearly showed the superiority of using WHtR as an anthropometric indicator of regional fat distribution which is consistent with our finding.26 55 Furthermore, WHtR appears to be more closely associated with the risk of chronic diseases than WC and WHR, with an increased risk above 0.5.56
In this study, adolescent girls had 5.28 times more risk of suffering from abdominal obesity than boys. This is in line with results reported in South Africa.57 This difference in gender may be explained by the fact that abdominal obesity varies according to gender, is high in boys from age 8 years to 13 years, and high in girls from age 14 years to 17 years.58 59 In addition, another study carried out in Brazil showed that girls were more sedentary than boys, which may contribute to increased adiposity.60 In contrast, Rakić et al found that Serbian boys tend to show greater abdominal obesity than girls.61
Disparities observed in malnutrition among Senegalese adolescents based on the settings and gender can also be due to environmental, economic and sociocultural factors. In fact, rural adolescents lived in households with poor health and economic conditions and were more at risk of underweight compared with those living in urban areas. Besides, parental influence and body image perceptions can influence adolescents’ nutritional status. In their perception, adolescent boys often want to be thin or build up muscle mass, which is considered an expression of masculinity, while girls associate being overweight with beauty and wellness. Boys were shown to be more underweight than adolescent girls who prefer to eat more and practise less physical activity.
Healthy eating habits contribute to growth and better nutritional status, especially during adolescence. Snacking was found to be a more common dietary lifestyle in urban adolescents than in rural adolescents and can be attributed to consumption of meals outside the home, greater availability of foods from street vendors, restaurants and supermarkets, and non-healthy food marketing on television. This study also found that adolescents who did not take breakfast daily were more predictive of suffering from abdominal obesity compared with their peers. The reason might be that adolescents who used to skip this meal tend to engage in compensatory overeating at lunch and dinner.
This study revealed that no association was found between dietary diversity and malnutrition in adolescents. The dietary diversity of adolescents is critical for their nutritional status and reflects the diet quality. A poor diet is a risk factor for malnutrition and major non-communicable diseases.62 The present findings indicate that 72% of them had met the minimum dietary diversity. However, dietary diversity was not significantly associated with malnutrition. This can be attributed to the fact that DDS typically provides the number of food groups consumed, not to the quantity of nutrient content. Further, it can be due to some confounding factors in our regression model. Our findings also highlighted that Senegalese adolescents’ diet mainly comprised starchy foods such as rice and millet. Low consumption of animal-based foods such as eggs, meat and vitamin A-rich fruits and vegetables, found in this study, may be an issue regarding the importance of such food groups in the diets of adolescents. This could be explained by the fact that the consumption of eggs and meat is not frequent in Senegalese households. The low consumption of such foods could affect their growth or lead to malnutrition when adolescents’ dietary intake does not meet their nutritional requirements. In rural areas, the lower consumption of animal-based foods such as meat, poultry, fish, eggs and dairy products might be attributed to limited economic conditions, as well as the higher cost of those foods in Senegal. Globally, the double burden of malnutrition found in our study can be explained by the fact that there is no programme for the management of malnutrition among adolescents in Senegal. Many programmes and policies on malnutrition are mostly addressed to children and women of reproductive age.
Strengths and limitations
This study has a number of strengths. It was conducted using a large sample of Senegalese adolescent boys and girls living in both rural and urban areas. Moreover, including adolescents aged 10–19 years, even those out of school, strengthens our study. The national representativeness of the study allows the generalisability of the findings in adolescents living in Senegal, also in the western African region.
Some limitations were found in this study. Its cross-sectional design establishes correlation but not causality, so the presence or otherwise of a causal relationship could not be established. Further studies are needed to clarify the causes of malnutrition among Senegalese adolescents from both rural and urban areas and according to gender. Despite this limitation, the associations presented in this study provide valuable insights on the predictive capacity of diet and health for adolescent nutritional risk. But it would be interesting to assess physical activity and the amount of food consumed and see the association with malnutrition.
Conclusion
This study provides, for the first time, nutritional status and dietary patterns of Senegalese adolescents aged 10–19 years at the national level. The study found that underweight was prominent in adolescents, particularly in boys. Overweight and obesity require particular attention among girls and in urban areas. Therefore, greater priority must be given to adolescents in nutrition policies with targeted interventions implemented both at the community level health systems and within schools. Such interventions may include malnutrition management, school meal programmes and iron and folic acid supplementation. Additionally, promoting healthy environments and integrating nutrition education into school curricula and community programmes will contribute to improving adolescents’ nutritional status. Therefore, this requires an effective involvement of all stakeholders from different sectors through multisectoral strategic plans. Multisectoral collaboration, involving various sectors of health, education, agriculture and social protection, is essential for addressing the issue of malnutrition among adolescents. Such an approach recognises that the deep-rooted causes of malnutrition are multidimensional and require synergies to sustainably optimise the impact of nutrition policies on the health and well-being of adolescents.
The reference list from the paper itself. Each links out to its DOI / PubMed record.
- 1WHO The global strategy for women’s, children’s, and adolescents’health (2016–30)2016 Availablehttp://www.who.int/life-course/partners/global-strategy/ewec-globalstrategyreport-200915.pdf?ua=110.2471/BLT.16.174714 PMC 485054727147756 · doi ↗ · pubmed ↗
- 2Sawyer SM Afifi RA Bearinger LH et al Adolescence: a foundation for future health Lancet 201237916304010.1016/S 0140-6736(12)60072-522538178 · doi ↗ · pubmed ↗
- 3Prentice AM Ward KA Goldberg GR et al Critical windows for nutritional interventions against stunting Am J Clin Nutr 201397911810.3945/ajcn.112.05233223553163 PMC 3628381 · doi ↗ · pubmed ↗
- 4Das JK Salam RA Thornburg KL et al Nutrition in adolescents: physiology, metabolism, and nutritional needs Ann N Y Acad Sci 20171393213310.1111/nyas.1333028436102 · doi ↗ · pubmed ↗
- 5WHO Prevalence of thinness among children and adolescents bmi-2-standard-deviation-below-the-median-crude available 2018 Availablehttps://www.who.int/data/gho/data/themes/topics/indicator-groups/indicator-group-details/GHO/
- 6Development Initiatives Global nutrition report: the state of global nutrition 2021 Availablehttps://globalnutritionreport.org/reports/2021-global-nutrition-report/
- 7Development Initiatives Global nutrition report: shining a light to spur action on nutrition 2018 Availablehttps://globalnutritionreport.org/reports/global-nutrition-report-2018/
- 8Rogol AD Clark PA Roemmich JN Growth and pubertal development in children and adolescents: effects of diet and physical activity Am J Clin Nutr 200072521 S 8S 10.1093/ajcn/72.2.521S 10919954 · doi ↗ · pubmed ↗