Long-term effect of physical inactivity on osteosarcopenic obesity – a MRI-based investigation from a population-based cohort
Lena Sophie Kiefer, Roberto Lorbeer, Susanne Rospleszcz, Wolfgang Rathmann, Christa Meisinger, Annette Peters, Christopher L. Schlett, Fabian Bamberg, Sven S. Walter, Elke Maurer

TL;DR
This study shows that long-term physical inactivity is linked to osteosarcopenic obesity, a condition involving low bone density, muscle loss, and obesity.
Contribution
This is the first study to investigate the long-term impact of physical inactivity on osteosarcopenic obesity using MRI in a population-based cohort.
Findings
Long-term physical inactivity was associated with isolated osteopenia, sarcopenia, and osteosarcopenic obesity.
Short-term physical inactivity was linked to all OSO subgroups except isolated obesity.
No significant correlation was found between lower back pain and the OSO complex.
Abstract
The hazardous triad of osteopenia, sarcopenia and obesity was recently defined as osteosarcopenic obesity (OSO). The causes for OSO appear to be multifactorial, including age and gender, as well as chronic diseases. The impact of physical inactivity has not been studied so far. The purpose of this study was to assess the association of short-term and long-term physical inactivity over a time period of 14 years on osteosarcopenic obesity in a population-based cohort from southern Germany. Supine whole body MRI (3 T scanner, Magnetom Skyra, Siemens Healthcare) was performed in 400 subjects from the population-based observational cohort study “Kooperative Gesundheitsforschung in der Region Augsburg (KORA)” to determine bone marrow fat fraction (BMFF), skeletal muscle fat fraction (SMFF) and total adipose tissue (TAT). Based on this, phenotyping was conducted into the groups of the OSO…
Genes, proteins, chemicals, diseases, species, mutations and cell lines named across the full text — each resolved to its canonical identifier and authoritative record.
Click any figure to enlarge with its caption.
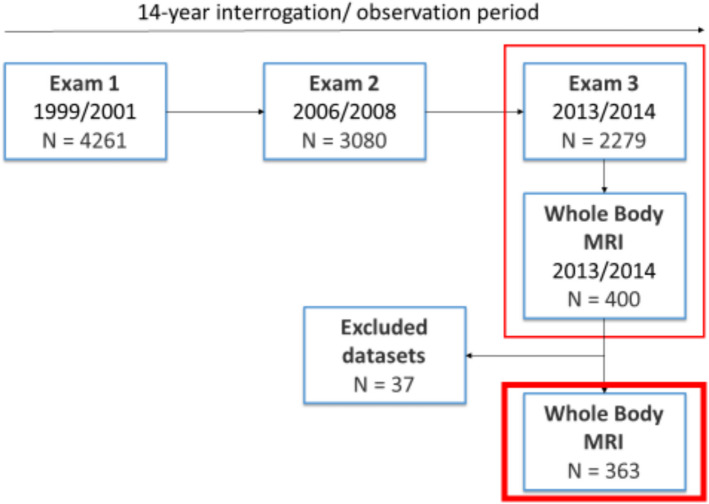 Figure 1
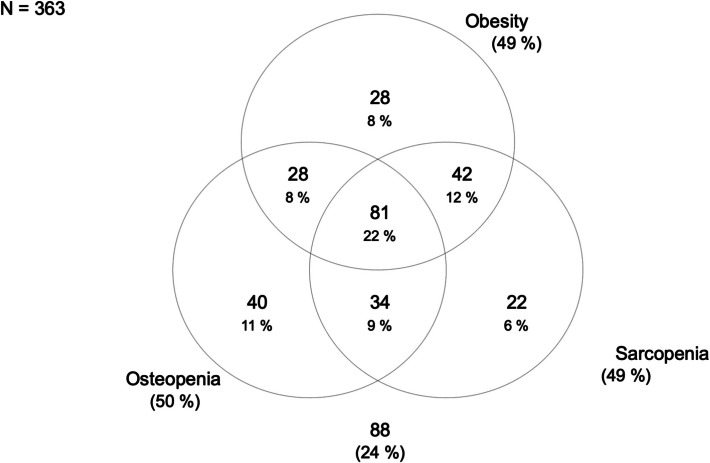 Figure 2
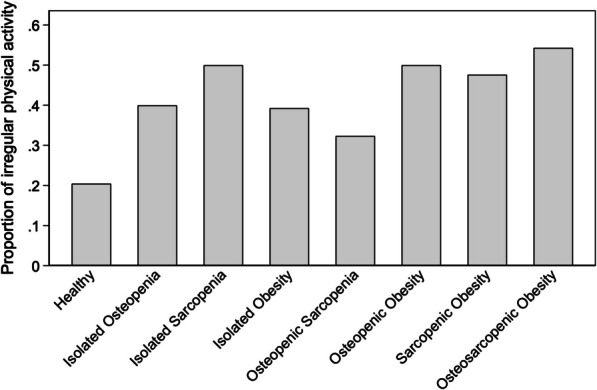 Figure 3
- —Universitätsklinikum Tübingen (8868)
Peer Reviews
No public reviews on file for this paper yet. If you reviewed it on a platform where reviews are public (OpenReview, ICLR, NeurIPS, ICML), you can paste yours below so the community can read it here.
Videos
No videos yet. Explain this paper in a talk, walkthrough, or lecture? Add one.
Taxonomy
TopicsNutrition and Health in Aging · Bone health and osteoporosis research · Body Composition Measurement Techniques
Background context
Osteosarcopenic obesity (OSO), a condition characterized by the coexistence of decreased bone mineral density (osteoporosis/osteopenia), reduced muscle mass, with consecutively decreased strength and functional capacity (sarcopenia) and disproportionate increase in bodyweight (obesity), has increasingly gained attention lately [1–4]. Due to the heterogeneity of diagnostic techniques and the inconsistent definition of the term, it is hardly possible to determine the exact prevalence yet. In the current literature, prevalence rates vary between 4,7% to 14,5% if all three components of the OSO complex apply [1] and 0,7% to 7,2% in case of osteosarcopenia without comorbid obesity [1, 4, 5].
In this study, we used magnetic resonance imaging (MRI) due to its ability to acquire high-resolution images that enable detailed visualization of various soft tissue components, including muscle, fat, and water, based on their distinct molecular properties. Compared to commonly used methods such as dual-energy X-ray absorptiometry (DEXA) or bioelectrical impedance analysis (BIA), MRI offers simultaneous and compartment-specific quantification of skeletal muscle, visceral and subcutaneous adipose tissue, as well as ectopic lipid deposits. Additionally, MRI can assess bone characteristics, including fat infiltration in the bone marrow, which is relevant for capturing the osteopenic component of the osteosarcopenic obesity (OSO) phenotype [6, 7].
Although there was evidence already a decade ago that osteoporosis, sarcopenia, and obesity are closely related to each other, the triad as such remains poorly investigated [8]. OSO begins with either one or more of the three components and is usually progressive in nature. It is assumed that changes at a cellular level (e.g. decrease in osteoblasts) may lead to systemic changes (e.g. altered osteokines), which in turn present themselves as physical changes (e.g. reduced bone mass) and finally manifest clinically as osteoporosis, sarcopenia and/or obesity [9].
The causes therefore appear to be multifactorial. Risk factors common to the three components of OSO are age and sex [2, 10]. Evidence was obtained that with increasing age, the white abdominal fat also increases [11]. Likewise, the fat content of skeletal muscles and bones rises [12]. Further common risk factors are chronic stress, inflammation and inflammatory and/or endocrine diseases, as well as physical inactivity [5, 10, 13, 14]. Inadequate physical activity lacks a regular stimulus that helps maintain bone quality and mass [15]. On the other hand, a regular physical activity has a positive effect on muscle mass and strength [16, 17] by recruiting muscle satellite cells [18]. Additive endurance training promotes the release of growth factors, which in turn drives differentiation and proliferation [19], whilst strength training leads to an increase in the size (hypertrophy) and number (hyperplasia) of myofibrils [20].
Therefore, the aim of this study was to investigate associations of recent and long-term physical inactivity and the presence osteosarcopenic obesity (OSO) obtained in supine position by MRI.
Material and methods
Study design and population sample
Participants were derived from the “Cooperative Health Research in the Region of Augsburg” (KORA) S4-study (N = 4261) with a baseline examination in 1999 to 2001 (exam 1), a follow-up examination in 2006 to 2008 (exam 2) and a second follow-up in 2013 and 2014 (exam 3). Hereof, 400 participants received a whole-body MRI during exam 3 [21].
Participants were considered eligible for inclusion if they were willing to undergo a whole-body MRI and were classified into one of the following groups based on health assessment: prediabetes, diabetes, or control. Individuals were excluded from the study if they were older than 72 years, had a history (self-reported or confirmed) of stroke, myocardial infarction, or revascularization, or had contraindications for MRI such as a cardiac pacemaker, implantable defibrillator, cerebral aneurysm clip, neural stimulator, ear implants, ocular foreign bodies, or any other implanted device. Additional exclusion criteria included pregnancy or breastfeeding, claustrophobia, known allergies to gadolinium-based contrast agents, or a serum creatinine level of ≥ 1.3 mg/dL [22].
Approval was given by the institutional review board of the Ludwig Maximilian’s University Munich (Germany). Written consent was obtained from every participating subject.
MR imaging protocol
During exam 3 in total 400 whole-body MR examinations were performed on a 3 Tesla scanner (Magnetom Skyra, Siemens Healthcare, Erlangen, Germany). A detailed description of the technical procedure as well as imaging protocols can be found elsewhere [22].
Briefly summarized, the musculoskeletal protocol embedded a dual-echo Dixon sequence (matrix: matrix: 256 × 256, field of view (FOV): 488 × 716 mm, echo time (TE) 1.26 ms and 2.49 ms, repetition time (TR): 4.06 ms, partition segments: 1.7 mm, flip angle: 9°) and a T2w single shot fast spin echo (SS-FSE) sequence (matrix: matrix: 320 × 200, field of view (FOV): 296 × 380 mm, echo time (TE) 91 ms, repetition time (TR): 1000 ms, partition segments: 5 mm, flip angle: 131°) [23].
A 2-point T1-weighted VIBE sequences (repetition time (TR): 4.06 ms; time to echo (TEs): 1.26 ms and 2.49 ms; flip angle 4°; slice thickness 1.7 mm) was used to determine bone marrow fat fraction (BMFF) in lumbar vertebrae L1 and L2 [24]. T2*-corrected, multi-echo 3D-gradient-echo Dixon-based sequence (repetition time (TR): 8.90 ms; TEs: 1.23 ms, 2.46 ms, 3.69 ms 4.92 ms, 6.15 ms and 7.38 ms; flip angle 4°, slice thickness 4 mm) was performed to measure skeletal muscle fat fraction (SMFF) in lumbar vertebrae L3 [25]. Based on a VIBE-Dixon sequence (TR: 4.06 ms; TEs: 1.26, 2.49 ms; flip angle 9°; slice thickness: 1.7 mm) VAT and SAT were quantified on a calculated fat-selective tomogram. VAT and SAT together form total adipose tissue (TAT) [22].
Body composition analysis was performed by determining MR imaging biomarkers of bone marrow fat fraction (BMFF), skeletal muscle fat fraction (SMFF) and visceral (VAT) and subcutaneous adipose tissue (SAT). Osteopenia and osteoporosis, characterized by reduced bone mineral density (BMD), have been described as "bone obesity," with recent data suggesting that increased bone marrow fat fraction (BMFF) inversely correlates with BMD, thus making BMFF a potential imaging biomarker for the osteopenic phenotype [7]. Phenotypic assignment to the OSO complex was performed based on these components.
Outcome definition of osteosarcopenic obesity subgroups
The sex-specific median was calculated for the biomarkers of bone marrow fat fraction (BMFF), skeletal muscle fat fraction (SMFF) and total adipose tissue (TAT). A value greater than the median BMFF, SMFF or TAT has been classified as an osteopenic, sarcopenic or obese phenotype, whereas a value less-than-equal was classified as a healthy phenotype (Table 1).Table 1. Phenotypic subgroups of osteosarcopenic obesityHealthyIsolated OsteopeniaIsolated SarcopeniaIsolated ObesityOsteopenic SarcopeniaOsteopenic ObesitySarcopenic ObesityOsteosarcopenic ObesityBMFF (Sex-specific median) ≤ > ≤ ≤ > > ≤ > SMFF (Sex-specific median) ≤ ≤ > ≤ > ≤ > > TAT (Sex-specific median) ≤ ≤ ≤ > ≤ > > >
Risk factor measurements of physical inactivity
In our cohort, physical inactivity was measured via a standardized questionnaire at exam 1 (1999–2001), exam 2 (2006–2008) and exam 3 (2013–2014) using a single-choice question with a four graded answer as previously described [23].
Exercise inactivity per week
- No physical activity
- irregularly for ≤ 1 h
- regularly for ≥ 1 h
- regularly for ≥ 2 h
Referring to a previous study [23], this was used to calculate a dichotomous variable with.
- physical activity irregularly ≤ 1 h per week
- physical activity regularly ≥ 1 h per week.
Furthermore, two different longitudinal variables were generated: The first longitudinal variable was calculated of physical activity performed regularly ≥ 1 h over the time course of 14 years with.
- three-times (exam 1, exam 2 and exam 3)
- two-times (at two exams out of three)
- one-time (at one exam out of three)
- never (in any of the three exams).
The second longitudinal variable was gathered by summing up physical inactivity categories of all three exams with one point for physical activity regularly for ≥ 2 h, two points for physical activity regularly ≥ 1 h, 3 points for physical activity irregularly for ≤ 1 h and 4 points for no physical activity. This results in in values from 3 to 12; with a value of 3 indicating physical activity regularly performed for ≥ 2 h per week during all three examinations and a value of 12 representing no physical activity at any of the three exams [23].
Furthermore, information on work inactivity, as well as levels of inactivity related to walking and cycling, were collected through a four-level question for each category.
Work inactivity
- no relevant physical labor
- light physical labor
- moderate physical labor
- heavy physical labor
Walk inactivity (in minutes (min) per day)
- 15 min
- 15 to 30 min
- 30 to 60 min
-
60 min
Cycling inactivity (in minutes per day)
- 15 min
- 15 to 30 min
- 30 to 60 min
-
60 min
Lower back pain
Lower back pain was investigated via a single-choice question with a five graded answer:
- no back pain
- little back pain
- moderate back pain
- strong back pain
- very strong back pain
We chose a descriptive method to assess lower back pain using a single-choice question with five graded response options (ranging from "no" to "very strong" back pain) in order to capture not only pain intensity but also subjective differences in pain perception. This graded self-assessment allows for a practical and real-life relevant classification of the symptoms, particularly in chronic conditions such as osteosarcopenic obesity.
Covariates
The division into healthy, prediabetic, and diabetic was determined on the basis of the oral glucose tolerance test (OGTT) and fasting glucose levels*: Impaired Fasting Glucose (IFG): FPG 5.6–6.9 mmol/L and Impaired Glucose Tolerance (IGT): OGTT 7.8–11.0 mmol/L. Subjects were categorized as having prediabetes if they met the criteria for IFG and/or IGT. However, if either the IFG or IGT criteria for diabetes mellitus were fulfilled (i.e., Diabetes Mellitus: FPG* ≥ 7.0 mmol/L and/or OGTT ≥ 11.1 mmol/L and Healthy Controls: FPG < 5.6 mmol/L and OGTT < 7.8 mmol/L), the subject was classified as having diabetes mellitus. This approach ensured a clear and consistent classification based on standard diagnostic thresholds.
BMI was calculated as the subjects’ weight in kilograms (kg)/height in meters squared (m^2^). A blood pressure ≥ 140/90 mmHg was defined as hypertension. Smoking status was recorded as a single choice question with three options: current smoker, former smoker, or never smoker. A detailed overview has been published elsewhere [26].
Statistical analysis
Descriptive characteristics of participants during last examination are provided as means with standard deviations for continuous measurements and as absolute numbers and proportions for categorical measurements. Venn and bar diagrams were used to illustrated distribution of OSO subgroups. The correlations of OSO subgroups with proportion of irregular physical activity and back pain were evaluated by chi-square test, respectively.
Associations between physical inactivity and OSO were assessed by multinomial logistic regression models adjusted for age, sex, smoking, hypertension, and diabetes mellitus. Relative risk ratios (RRR) together with 95% confidence intervals (95% CI) were calculated. Physical active and healthy subjects were considered as reference group.
A p-value of < 0.05 was considered statistically significant. Statistical analyses were performed using Stata 16.1 (Stata Corporation, College Station, TX, U.S.A.).
Results
Out of the 400 participants included in this study, 37 were excluded due to poor image quality (Fig. 1). The mean age of the included subjects was 56.0 ± 9.1 years with 57.6% being male. Detailed demographics and characteristics of the participants are provided in Table 2.Fig. 1. Participants’ flow chartTable 2Participants’ characteristicsExam 3All N = 363Age (years)56.0 (± 9.1)Men209 (57.6%)Smoking status never smoker133 (36.6%) ex-smoker156 (43%) current smoker74 (20.4%)BMI (kg/m^2^)27.9 (± 4.6)Hypertension118 (32.5%)Known Diabetes mellitus50 (13.8%)Total Adipose Tissue (l)12.5 (± 5.3)Bone Marrow Fat Fraction (%)54.3 (± 10.2)Skeletal Muscle Fat Fraction (%)12.3 (± 5.2)
Our analysis revealed that participants with increased adiposity, regardless of the specific phenotype, showed elevated fasting glucose and HbA1c levels, indicating reduced glycemic control compared to individuals without features of the osteosarcopenic adiposity (OSA) complex. Conversely, those in the "normal" group—without OSA characteristics—had the most favorable glucose profiles. Notably, the OSA subgroup demonstrated the highest rate of impaired glucose tolerance (63%), supporting a strong link between disturbances in glucose metabolism and distinct OSA phenotypes [7].
An overview of the distribution of participants based on their physical activity is presented in Table 3, showcasing the percentage breakdown.Table 3. Distribution of participants based on their physical activity at exam 3All N = 363Physical activity (Exam 3) ≥ 1 h, regularly218 (60.1%) ≤ 1 h, irregularly145 (39.9%)Work activity (Exam 3) heavy/moderate104 (28.7%) light/not relevant259 (71.4%)Walk activity (Exam 3) > 0.5 h daily270 (74.4%) < = 0.5 h93 (25.6%)Cycling activity (Exam 3) > 0.5 h daily110 (30.3%) < = 0.5 h253 (69.7%)Physical activity14 years ago (Exam 1) N = 362 ≥ 1 h, regularly182 (50.3%) ≤ 1 h, irregularly180 (49.7%)7 years ago (Exam 2) N = 343 ≥ 1 h, regularly199 (58.0%) ≤ 1 h, irregularly144 (42.0%)(≥ 1 h, regularly over 14 years) (Exam 1 – Exam 3) N = 343 three/two times188 (54.8%) one times/never155 (45.2%)
In total, 88 (24.2%) were classified with a healthy phenotype by MRI. An isolated osteopenic phenotype was found in 40 (11,0%) subjects, an isolated sarcopenic phenotype in 22 (6,1%) and an isolated obese phenotype in 28 (7,7%). 81 (22,3%) participants were allocated to an osteosarcopenic obese phenotype by MRI (Fig. 2).Fig. 2. Subject allocation to the phenotypic subgroups of osteosarcopenic obesity
Physical inactivity
The proportion of irregular physical activity varies significantly between the subgroups of the OSO complex. While the share was lowest in the group of subjects with a healthy phenotype, the percentage was highest in the group with complete pattern of OSO phenotype. Notably, the subgroups with an sarcopenic phenotype showed a higher proportion of irregular physical activity compared to other subtypes (Fig. 3).Fig. 3. Proportions of irregular physical activity depending on the subgroups of the OSO complex (p = 0.001)
Physical activity less than one hour per week at exam 3 was significantly associated with all pathological subgroups of the OSO complex, except isolated obesity, in which the association was scarcely not significant. Instead, work activity only impacted on isolated osteopenia and sarcopenia, as well as on sarcopenic obesity and osteosarcopenic obesity. Neither walking, nor cycling activity were associated with any phenotypic subgroup of the OSO complex (Table 4).Table 4. Association between current physical activity (exam 3) and osteosarcopenic obesityIsolated OsteopeniaRRR (95%CI)pIsolated SarcopeniaRRR (95%CI)pIsolated ObesityRRR (95%CI)pOsteopenic SarcopeniaRRR (95%CI)pOsteopenic ObesityRRR (95%CI)pSarcopenic ObesityRRR (95%CI)pOsteosarcopenic Obesity****RRR (95%CI)pPhysical activity ≥ 1 h, regularlyRefRefRefRefRefRefRef ≤ 1 h, irregularly3.59 (1.48; 8.70)0.0056.32 (2.13; 18.77)0.0012.42 (0.92; 6.37)0.0743.33 (1.2; 9.24)0.0214.09 (1.51; 11.1)0.0064.61 (1.89; 11.21)0.0016.87 (2.94; 16.04)** < 0.001Work activity* heavy/moderateRefRefRefRefRefRefRef light/not relevant0.36 (0.15; 0.87)0.0240.31 (0.1; 0.96)0.0430.9 (0.31; 2.63)0.8510.56 (0.18; 1.74)0.3140.55 (0.19; 1.6)0.2720.27 (0.11; 0.67)0.0040.23 (0.1; 0.55)**0.001*Walk activity** > 0.5 h dailyRefRefRefRefRefRefRef < = 0.5 h0.94 (0.4; 2.2)0.8850.96 (0.31; 2.95)0.9491.01 (0.41; 2.51)0.9780.55 (0.18; 1.65)0.2890.33 (0.1; 1.09)0.0680.58 (0.23; 1.46)0.250.63 (0.27; 1.48)0.286Cycling activity > 0.5 h dailyRefRefRefRefRefRefRef < = 0.5 h1.69 (0.69; 4.16)0.2511.58 (0.52; 4.77)0.421.38 (0.5; 3.8)0.5341.36 (0.52; 3.57)0.5281.12 (0.42; 2.97)0.8211.90 (0.77; 4.69)0.1662.06 (0.91; 4.65)0.083Relative risk ratios (RRR) are from multinomial logistic regression models (with the healthy group as reference) adjusted for age, sex, smoking, hypertension, and diabetes mellitus
Long-term physical inactivity was substantially associated with isolated osteopenia and sarcopenia but not with isolated obesity. Osteopenic obesity and osteosarcopenic obesity were impacted by physical inactivity over a time period of 14 years (Table 5).Table 5. Association between longitudinally measured physical activity (exam 1, exam 2 and exam 3) and osteosarcopenic obesityPhysical activityIsolated OsteopeniaRRR (95%CI)pIsolated SarcopeniaRRR (95%CI)pIsolated ObesityRRR (95%CI)pOsteopenic SarcopeniaRRR (95%CI)pOsteopenic ObesityRRR (95%CI)pSarcopenic ObesityRRR (95%CI)pOsteosarcopenic ObesityRRR (95%CI)p14 years ago (n = 362)≥ 1 h, regularlyRefRefRefRefRefRefRef ≤ 1 h, irregularly2.05 (0.91; 4.62)0.0822.88 (1.01; 8.16)0.0470.98 (0.39; 2.42)0.9571.37 (0.53; 3.55)0.5165.80 (2.02; 16.71)0.0011.54 (0.68; 3.47)0.3042.1 (0.98; 4.51)0.0577 years ago (n = 343) ≥ 1 h, regularlyRefRefRefRefRefRefRef ≤ 1 h, irregularly2.35 (1.02; 5.45)0.0462.69 (0.93; 7.81)0.0681.13 (0.44; 2.88)0.7971.48 (0.56; 3.92)0.4343.17 (1.22; 8.25)0.0181.11 (0.46; 2.67)0.8222.12 (0.96; 4.68)0.062**(≥ 1 h, regularly over 14 years)** (n = 343)* three/two timesRefRefRefRefRefRefRef one times/never2.8 (1.19; 6.6)0.0183.91 (1.32; 11.57)0.0141.55 (0.61; 3.97)0.361.57 (0.57; 4.3)0.3847.29 (2.54; 20.9)** < 0.001**1.67 (0.69; 4.04)0.2563.6 (1.6; 8.11)**0.002*summed over 14 years(n = 343)1.34 (1.14; 1.58)** < 0.0011.46 (1.2; 1.79) < 0.0011.15 (0.96; 1.37)0.1331.22 (1.02; 1.46)0.0281.51 (1.25; 1.83) < 0.0011.25 (1.07; 1.48)0.0061.38 (1.18; 1.61) < 0.001**Relative risk ratios (RRR) are from multinomial logistic regression models (with the healthy group as reference) adjusted for age, sex, smoking, hypertension, and diabetes mellitus
Correlation between osteosarcopenic obesity and back pain (exam 3)
During the second follow-up, lower back pain was reported by 54.5% of all subjects. Among the participants, approximately one-third reported experiencing mild back pain, while 16.3% reported average back pain. 3,9% reported strong and 1,1% very strong back pain. Interestingly, there was no correlation between any phenotypic subgroup of the OSO complex and lower back pain (Table 6).Table 6. Correlation between osteosarcopenic obesity and back pain (exam 3). Data is given in n (%)AllN** = 363HealthyN = 88Isolated OsteopeniaN = 40Isolated SarcopeniaN = 22Isolated ObesityN = 28Osteopenic SarcopeniaN = 34Osteopenic ObesityN = 28Sarcopenic ObesityN = 42Osteosarcopenic ObesityN = 81****Back pain, n (%)** Not at all165 (45.5%)42 (47.7%)22 (55%)10 (45.5%)12 (42.9%)14 (41.2%)11 (39.3%)16 (38.1%)38 (46.9%) Little121 (33.3%)29 (33%)12 (30%)8 (36.4%)9 (32.1%)13 (38.2%)13 (46.4%)15 (35.7%)22 (27.2%) Average59 (16.3%)15 (17.1%)5 (12.5%)4 (18.2%)6 (21.4%)7 (20.6%)1 (3.6%)10 (23.8%)11 (13.6%) Strong14 (3.9%)2 (2.3%)1 (2.5%)0 (0%)0 (0%)0 (0%)3 (10.7%)1 (2.4%)7 (8.6%) Very strong4 (1.1%)0 (0%)0 (0%)0 (0%)1 (3.6%)0 (0%)0 (0%)0 (0%)3 (3.7%)chi2-test, p = 0.258
Discussion
The hazardous composite of osteopenia, sarcopenia and obesity was recently described as the OSO complex [1, 2, 14]. Although there was evidence of the close linkage of the three components a decade ago, little research has been done on the OSO complex as such [8]. Physical inactivity is among the risk factors considered [27].
Therefore, we aim to determine correlations between long-term physical inactivity and osteosarcopenic obesity (OSO) obtained in supine position by MRI.
Our results demonstrate, that physical inactivity was observed to be most widespread among patients with full expression of the OSO complex and less in healthy individuals. Predominantly, the proportion of inactive subjects was highest in the sarcopenic phenotype subgroup and in groups which included the sarcopenic phenotype. Physical inactivity during the second follow-up examination affected all manifestations of the OSO complex substantially. Activity related to work, was associated with an isolated osteopenic and sarcopenic phenotype, but not with ab isolated obese phenotype. In contrast, walking and cycling activity was not associated with any subgroup of the OSO complex. Long-term physical inactivity impacted significantly on the isolated osteopenic and sarcopenic phenotypes, osteopenic obese and osteosarcopenic obese phenotypes. There was no correlation between the OSO complex by MRI and lower back pain.
Physical inactivity
Osteopenia/osteoporosis is characterized by the decrease in bone mass and a deterioration of the microarchitecture [28]. Besides increasing age, female sex is often considered to be a risk factor for osteoporosis [29]. Kirk et al. outline a close link between bone and muscle, proofing that age, sex and physical inactivity also have a negative impact on osteosarcopenia [10]. In line, we were able to show that short- and long-term physical inactivity is negatively associated with an osteopenic phenotype. But also over a period of 14 years, the detrimental association with osteosarcopenia could be demonstrated. Conversely, a physical load sets impulses in terms of stretching, traction or compression, which are recognized as stimuli by osteocytes. Repetitive exposure to these stimuli eventually leads to the activation of a cascade that promotes bone formation [30]. Thus, is not surprising, that physical activity has a protective effect on bone health.
Aging skeletal muscle is noticeable by a decrease in muscle mass and therefore muscle strength, known as sarcopenia [31]. This might be due to an age-related apoptosis of myocytes, damage of the macroscopic muscular structure by oxidative stress, an activation of pro-inflammatory cytokines and an oversupply of myostatin, which in turn negatively affects muscle growth through protein inhibition [32, 33]. In addition to primary aging, secondary aging, triggered by environmental factors and diseases, negatively impacts muscle degeneration. Thus, physical inactivity is considered to be a major determinant [31, 34]. Still, literature is controversial regarding the influence of physical inactivity on sarcopenia. On the one hand side, a sedentary lifestyle might promote sarcopenia by secondary aging [33]. We found physical inactivity at exam 3 and long-term inactivity associated with sarcopenic phenotype. This is in line with other studies [35, 36]. Conversely, regular physical activity may prevent sarcopenia [37], thus should be promoted more intensively in society [38]. On the other hand, Wu et al*.* stated, that after adjustment for sex and age, the impact of physical inactivity on sarcopenia was not significant, despite positive correlation [39].
Interestingly, factors responsible for secondary muscle aging might also affect other body compartments, causing obesity among others, and present as sarcopenic obesity [31]. A close inter-correlation between body fat content and sarcopenia was also shown by Tyrovolas et al*.* [37], with an increase in prevalence with age [40]. Our data demonstrate a strong association of the sarcopenic obese phenotype and physical inactivity at exam 3, however, the long-term impact seemed to be rather low. This is in line with other studies, proofing an association of less physical activity with sarcopenic obesity [37].
The causes of obesity are multifactorial. Thus, in addition to a genetic predisposition, physical inactivity combined with an increased/unbalanced food intake plays a decisive role [35]. The isolated obese phenotype was not associated with physical inactivity in our cohort. A decrease in prevalence was shown with age. However, the decrease was more likely due to an onset of sarcopenia and thus the shift to the sarcopenic obese phenotype than to physical weight loss [40]. Furthermore, an increase in adipose tissue is assumed to be another promotor of sarcopenia [41]. This allows to show the close linking of sarcopenia with obesity.
There is proof that physical activity prevents functional disability and increases functional capacity in osteosarcopenic obese women. The decisive factor, however, is that the physical activity is carried out in leisure time, but preferably under constant guidance, as in a gym [27]. Our results are in part contrary to these, as in addition to a benefit of regular leisure time physical activity of more than 1 h per week over a longer period of time, we were also able to show a positive effect from physically demanding professional work. Endurance-enhancing exercise, such as cycling or walking, were not associated with sarcopenic phenotypes. Some studies have shown that, however, through strength training muscle mass increases [35, 42]. But also vice versa, osteopenia, sarcopenia and obesity lead to an increase in frailty and decrease in physical function, which in turn increases morbidity and mortality [43]. Therefore, we consider it essential to examine further risk factors of OSO and sensitize the public for early detection.
To our knowledge, this is the first study analyzing the association of the OSO complex and back pain. In our cohort, there was no correlation between any subgroup of the OSO complex and lower back pain. Contrary to our results, one study found that osteopenic sarcopenia was associated with low back pain, while patients with osteoporosis alone failed to show a correlation [44]. Similarly, it was shown that lower back pain was associated with reduced muscle mass [45]. Still, further research is needed.
In terms of limitation, we only performed one single whole-body MRI per subject as part of exam 3. Thus, there are no former MR images to compare to. Second, neither functional measurement of skeletal muscle performance, nor clinically criteria were used to diagnose sarcopenia. Instead only supine MR imaging biomarkers for body composition phenotyping have been assessed.
Despite these limitations, the findings of our study remain robust and valuable. Whole-body MRI provides high-resolution, objective, and reproducible measurements of tissue composition, allowing for precise differentiation between muscle, adipose tissue, and bone marrow fat. These imaging biomarkers are increasingly recognized as reliable surrogates for musculoskeletal health and are particularly advantageous in large-scale, non-invasive population studies. Furthermore, our ability to demonstrate significant associations between long-term physical inactivity and distinct OSO phenotypes underlines the relevance and strength of the imaging data. Also, a differentiation of physical activity into recreational and competitive sports was not performed. Neither was made a discrimination between endurance, strength and precision sports.
Furthermore, other comorbidities and medication use were not the focus of the present analysis, as it specifically aimed to investigate osteosarcopenic adiposity (OSA) in relation to physical inactivity and lower back pain. However, their potential relevance is acknowledged, and related aspects—particularly cardiovascular risk factors—have been addressed in a previous publication by our group.
Conclusion
Physical inactivity was strongly correlated with isolated osteopenia, sarcopenia and osteosarcopenic obesity but not with isolated obesity. Although slightly over fifty percent of participants reported back pain on exam 3, the manifestation of the OSO complex had no effect on this.