Intra-host variation and transmission dynamics of SARS-CoV-2 Omicron outbreaks in Shandong, China
Xuemin Wei, Qi Gao, Yuhao Wang, Xinyi Gao, Zengqiang Kou, Xiujun Li, Yifei Xu

TL;DR
This study examines how genetic variation within individual SARS-CoV-2 hosts influences transmission and evolution, focusing on Omicron outbreaks in Shandong, China.
Contribution
The study reveals that intra-host single nucleotide variants (iSNVs) may act as reservoirs for future mutations and highlights limitations in using iSNVs alone to trace transmission.
Findings
Most SARS-CoV-2 samples did not share intra-host single nucleotide variants (iSNVs), even within transmission clusters.
Shared iSNVs were often found in samples from different transmission clusters, suggesting they are insufficient for tracing transmission routes.
iSNVs in BA.1.1 samples matched mutations characteristic of BA.2 and BA.2.3, indicating potential evolutionary pathways.
Abstract
Investigating the intra-host diversity of severe acute respiratory syndrome coronavirus 2 (SARS-CoV-2) is essential for understanding its transmission and the emergence of new variants. However, there is limited insight into SARS-CoV-2 intra-host diversity and the extent to which shared intra-host single nucleotide variants (iSNVs) occur among samples without epidemiological links. To characterize intra-host diversity, we analyzed sequencing data from 803 samples across four Omicron transmission clusters. The potential co-mutation patterns formed by shared iSNVs contributed to regions in the genome with elevated iSNV density. Most samples did not share iSNVs. Even among the sample pairs that did share at least one iSNV, 24.4% originated from different transmission clusters. For shared iSNV sites that can become fixed as single nucleotide polymorphisms (SNPs), iSNVs cluster within the…
Genes, proteins, chemicals, diseases, species, mutations and cell lines named across the full text — each resolved to its canonical identifier and authoritative record.
Click any figure to enlarge with its caption.
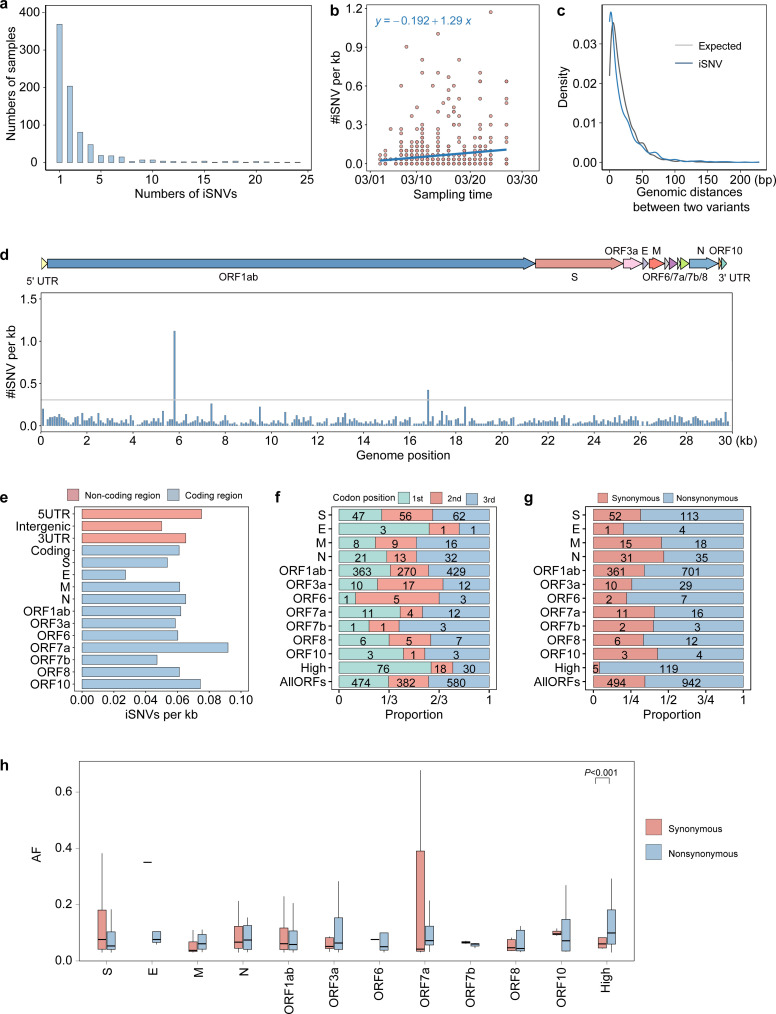 Fig 1
Fig 1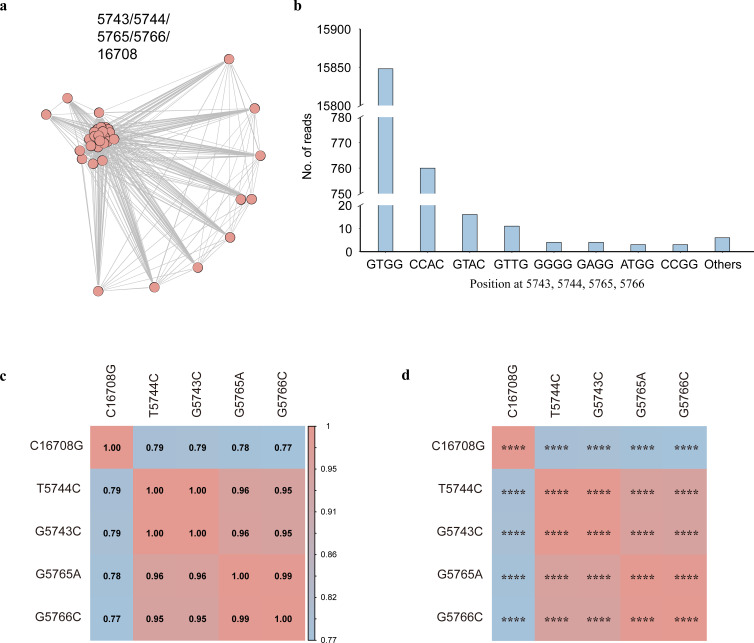 Fig 2
Fig 2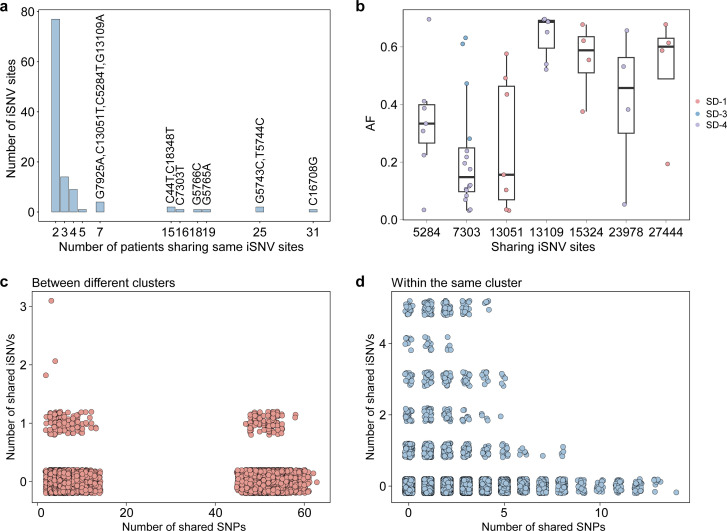 Fig 3
Fig 3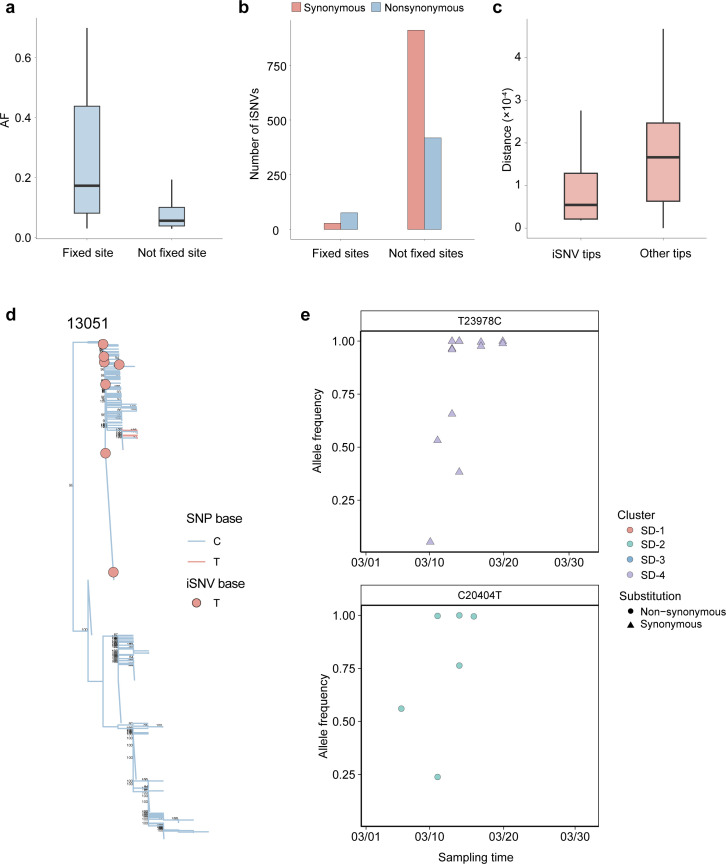 Fig 4
Fig 4Peer Reviews
No public reviews on file for this paper yet. If you reviewed it on a platform where reviews are public (OpenReview, ICLR, NeurIPS, ICML), you can paste yours below so the community can read it here.
Videos
No videos yet. Explain this paper in a talk, walkthrough, or lecture? Add one.
Taxonomy
TopicsSARS-CoV-2 and COVID-19 Research · Plant Virus Research Studies · Animal Virus Infections Studies
INTRODUCTION
Since its emergence in November 2019, severe acute respiratory syndrome coronavirus 2 (SARS-CoV-2) has continuously evolved through mutations and recombination events, leading to the emergence of multiple variants of concern such as Alpha, Delta, and Omicron (1–3). These variants are characterized by distinct mutations that enhance transmissibility, immune evasion, or pathogenicity, resulting in successive waves of COVID-19 infections worldwide (1, 4). The continuous emergence and global spread of such variants highlight the critical need to understand the mechanisms driving viral evolution and transmission.
The evolution of the virus occurs not only through globally circulating variants but also through mutations within individual hosts, leading to the emergence of intra-host single nucleotide variants (iSNVs) (4). Compared to single nucleotide polymorphisms (SNPs), iSNVs encompass a broader spectrum of genetic mutations, offering deeper insights into viral diversity and evolutionary dynamics. For example, the D614G of SARS-CoV-2, which improved viral replication and transmission, was initially detected as an iSNV in samples before becoming recognized as an SNP (5–9). While intra-host diversity of SARS-CoV-2 has been observed, research on this aspect remains limited (10).
Analyzing transmission patterns during outbreaks is crucial for understanding pathogen spread and designing targeted public health measures. Combining phylogenetic analysis with epidemiological investigations allows for the identification of the origins and transmission clusters of pathogens (11–13). However, consensus sequences, which reflect only the dominant viral lineage within a host, offer limited resolution for transmission analysis. In contrast, the analysis of intra-host diversity may provide a more precise approach to studying viral transmission (14, 15). Despite its potential significance, the characteristics of SARS-CoV-2 intra-host diversity and the extent to which shared iSNVs occur among samples without epidemiological links remain insufficiently explored (16, 17).
Here, we analyzed sequencing data from 803 samples across four transmission clusters that occurred during the Omicron epidemic in Shandong Province in March 2022. We aimed to characterize the features of intra-host diversity, investigate the likelihood of shared iSNVs arising among samples without epidemiological links, and explore the transition of iSNVs into SNPs. Our findings enhance our understanding of SARS-CoV-2 variation in individual hosts and highlight key considerations for inferring transmission using shared iSNVs.
MATERIALS AND METHODS
Data collection
The sequencing data of 803 SARS-CoV-2 Omicron samples, collected from public health laboratories in Shandong as part of routine surveillance, were obtained from our previous report (18). These samples were obtained from four transmission clusters, SD-1–SD-4, during the Omicron epidemic in Shandong between 1 March and 27 March 2022. These four local transmission clusters were identified by a previous study based on genome phylogeny and public health investigation results. These four clusters belonged to three genetic sublineages of the Omicron variant: BA.1.1 (SD-1), BA.2 (SD-2), and BA.2.3 (SD-3 and SD-4).
Genome sequencing
All samples were collected by personnel certified through unified biosafety training and operational protocols. Viral RNA extraction, cDNA synthesis, and sequencing were performed as previously described (18). Viral RNA was extracted using the QIAamp Viral RNA Mini Kit (Qiagen, Hilden, Germany). The extracted RNA was reverse transcribed and amplified using the ULSEN 2019-nCoV Whole-Genome Capture Kit (MicroFuture Technology, Beijing, China). The resulting cDNA was purified using AMPure XP beads (Beckman Coulter, USA) at a 1:1 ratio and quantified with the Qubit 1X dsDNA HS Assay Kit (Thermo Fisher Scientific, USA), following the manufacturer’s instructions. Libraries were prepared from 0.2 ng/µL cDNA using the Nextera XT Library Prep Kit with Nextera XT Indexes (Illumina, San Diego, CA, USA). Sequencing was performed on Illumina NextSeq 2000 or MiSeq platforms.
Calling of iSNVs
Sequencing reads were mapped to the reference genome (Wuhan-Hu-1, NCBI NC_045512.2) using BWA-MEM version 0.7.17 (19). Only properly paired reads were retained for the downstream analysis. PCR-duplicated reads were removed using Picard MarkDuplicates (version 2.10.10) (http://broadinstitute.github.io/picard). Base composition of each position was summarized from the mapping profile using pysamstats (version 1.1.2, https://github.com/alimanfoo/pysamstats). To enable accurate iSNV detection while minimizing false positives from sequencing or alignment errors, the following filtering criteria were applied, consistent with established practices: (i) bases with a Phred-scaled base quality score <20 were excluded to improve the specificity of low-frequency variant calling (20, 21). (ii) Sites required a minimum depth ≥100× to ensure sufficient power for detecting variants (22). (iii) The variants required ≥10 supporting reads to distinguish them from sequencing noise (22). (iv) iSNVs with strand bias greater than 10-fold were removed to avoid strand-specific artifacts (20). (v) Only variants with allele frequencies (AFs) between 3% and <70% were retained, ensuring that low-frequency variants (AF ≥ 3%) exceed typical sequencing error rates (17, 22–24). (vi) Genomic regions containing ≥5 iSNVs within a 50 bp window were excluded to minimize false positives from local misalignment (25). To avoid recurring sequencing errors, iSNVs with consistently low AF identified in multiple samples were excluded (Fig. S1) (23). SNPs were defined as variants meeting the following criteria: (i) depth of coverage ≥ 10; (ii) AF ≥ 70%. Using these rigorous, literature-supported criteria, iSNVs and SNPs were identified from our sample set. To rule out cross-sample contamination, we specifically compared the genomic positions of identified iSNVs with SNP sites from our samples. Contamination typically results in spurious iSNVs overlapping SNP positions due to cross-sample mixing. In our data set, only 8.37% (123 iSNVs) overlapped with SNP positions—a much lower proportion than previously reported (26)—indicating that contamination did not appreciably affect our iSNV calls. The iSNV density in a given region was calculated by dividing the total number of identified iSNVs by the number of samples and then further dividing by the length of the region.
The consensus sequences were derived from prior research (18). These sequences were generated with a minimum of 10-fold mapping coverage and supported by at least 70% of reads at each position. Consensus sequences with more than 90% genome coverage were used for downstream analysis. The genetic clade for each SARS-CoV-2 sequence was determined using Nextclade version 1.11.0 (https://clades.nextstrain.org).
Evaluating iSNV genomic distance distributions
iSNV positions were simulated in R using the runif function, which utilizes a uniform distribution based on the number of iSNVs. Both actual and simulated iSNVs were ranked, and genomic distances between neighboring mutant pairs were calculated. It was found that the distances between simulated iSNVs followed a Poisson distribution. To evaluate the distribution of distances between adjacent iSNVs, the Kolmogorov-Smirnov test was used to compare the observed distribution with the expected distribution under a Poisson model.
Identification of co-infection cases
Co-infection cases must satisfy three criteria: (i) a sample must contain featured mutations from more than one sublineage; (ii) the AF of mutations within the same sublineage should be similar; (iii) the total AF across all detected sublineages should be close to 100% (27). In March 2023, 11 BA sublineages (BA.1, BA.1.1, BA.1.14, BA.1.15, BA.1.1.1, BA.1.1.2, BA.2, BA.2.2, BA.2.3, BA.2.9, and BA.2.10) were circulating in Shandong Province. Their featured mutations were collected (https://outbreak.info/situation-reports), and the AF of polymorphic sites was analyzed for each sample.
Analysis of potential co-mutation patterns
A network of the shared iSNVs was constructed using Cytoscape version 3.9.1 (28). An edge-weighted, spring-embedded model was used to determine the layout. In the network, each node represented a sample, and two nodes were connected through an edge if samples shared ≥1 iSNVs. Samples that shared more iSNVs were closer in network distance. There were 229 nodes and 994 edges.
Potential co-mutation patterns were further evaluated using the Pearson correlation coefficient (PCC) and the significance level (P-value) obtained from linear regression analysis. The coefficients of linear correlation between two shared iSNVs were evaluated by PCC, with a value between −1.0 and 1.0. There was a strong correlation between the two iSNVs when the absolute value of PCC was between 0.7 and 1. The relationship between one or more independent and dependent variables was modeled by linear regression.
Phylogenetic association of iSNVs and SNPs
If an iSNV was detected at a specific genomic site in a sample, and a corresponding SNP (with the same base pair substitution, not just the same genomic location) was found at the same site in other samples, these sites were designated potential fixed sites. To prevent misclassification of lineage-defining mutations (relative to the Wuhan-Hu-1) as SNPs in subsequent analyses, all genomic positions corresponding to the featured mutations defining the Omicron sublineages observed in our study (BA.1.1, BA.2, and BA.2.3) were systematically excluded. These featured mutations were predominantly curated from Outbreak.info (https://outbreak.info/situation-reports). The consensus sequences obtained from GISAID (https://gisaid.org/) and those from the Omicron outbreak in Shandong, China, were aligned using MAFFT version 7.310 (29). A maximum likelihood phylogenetic tree was constructed based on SARS-CoV-2 coding region sequences using IQ-TREE version 2.0.3 with the best-fit substitution model determined by the software (30). Branch support was assessed with ultrafast bootstrapping. The final tree was rooted using the reference sequence, after which the reference sequence, all GISAID isolates, and sequences not included in this study were pruned. When an iSNV corresponded to an SNP (defined by the base pair involved, not just the site), ancestral state reconstruction was performed on the consensus trees using ClonalFrameML to identify all branches on which that substitution had occurred (31). The patristic distance from each tip in the tree to the midpoint of the closest one of these branches was calculated. A one-tailed Mann-Whitney U test was then used to assess the association between the presence of iSNV in a sample and this distance. Multiple testing was controlled for each using the Benjamini-Hochberg adjustment. These analyses were done both on an individual site level and across all sites of interest.
RESULTS
Distribution of iSNVs among samples
We retrieved sequencing data for 803 SARS-CoV-2 Omicron samples from the Shandong epidemic between 3 March and 27 March 2022. The number of iSNVs in each sample was not affected by sequencing depth or Ct values (R-square [R^2^] = 0.14 for sequencing depth; R^2^ = 0.10 for Ct values of ORF1ab gene; R^2^ = 0.08 for Ct values of N gene; Fig. S1a through c), suggesting that the identified iSNVs were unbiased to sequencing data. We identified 1,470 iSNVs at 1,133 sites. The median number of iSNVs per sample was one (Fig. 1a). About 54.05% of samples (434 of 803) harbored at least one iSNV in comparison with the reference genome. We found a steady increase in the density of iSNVs over time during the epidemic, increasing from 0.03 to 0.23 iSNVs/kb within 24 days (Fig. 1b).
Distribution of iSNVs in SARS-CoV-2 Omicron variant. (a) The number of identified iSNVs per sample. (b) Distribution of the number of iSNVs/kb against the date of sample collection. (c) Distribution of genomic distance between two variants in observed and expected iSNVs. The blue line represents the observed iSNVs, while the gray line shows the expected distribution modeled by a Poisson process. (d) Distribution of the number of iSNVs/kb in the genome, counted using a window of 100 bp. The gray line represents five times the mean iSNV density in the genome. (e) Distribution of the number of iSNVs/kb in coding and non-coding regions. (f) Distribution of iSNVs at codon positions. High represents high-density regions. The number of iSNVs in each category is marked on the corresponding bar. (g) Proportion of nonsynonymous and synonymous iSNVs for each gene, high-density regions, and the combined ORFs (AllORFs). (h) Box plots of AF for non-synonymous and synonymous iSNVs.
Distribution of iSNVs across the genome
We investigated the distribution of iSNVs across the SARS-CoV-2 genome and found an overall iSNV density of 0.06 iSNVs/kb (Fig. 1d). The iSNV density of the 5′ UTR, 3′ UTR, and intergenic region was 0.08, 0.07, and 0.05 iSNVs/kb, respectively (Fig. 1d). We identified 1,436 (97.69%) iSNVs in the coding regions, which cover 97.85% of the genome. Most iSNVs (1,062, 73.96%) were present in the ORF 1ab, followed by the S gene (165 iSNVs, 11.49%) and N gene (66 iSNVs, 4.60%). After normalization by gene length, the ORF7a gene showed the highest iSNV density at 0.09 iSNVs/kb (Fig. 1e).
To determine if selection pressure influenced the distribution of iSNVs across the genome, we calculated the genomic distances between allele pairs. The fitted density curve showed a significant difference from randomly generated mutations (Kolmogorov-Smirnov test, P < 0.001; Fig. 1c), indicating a non-stochastic distribution of iSNVs. We also analyzed iSNV distribution across codon positions for all genes. The third codon position of ORF1ab had the highest iSNVs, followed by the first, with the second having the lowest (Fisher’s exact test, P < 0.05; Fig. 1f). The N gene showed more iSNVs at the third codon position than at the second (Fisher’s exact test, P < 0.05) and exhibited a lower nonsynonymous/synonymous ratio compared to other regions of the viral genome (1.13 vs 1.91, Fisher’s exact test, P = 0.03; Fig. 1g). This suggested that the N gene may be subject to stronger negative selection than other genomic regions.
Interestingly, we identified two distinct regions (referred to as high-density regions) in the ORF1ab gene at positions 5,700–5,800 and 16,700–16,800. The iSNV density in these two regions (1.12 and 0.42 iSNVs/kb) was 19 and 7 times higher than the overall iSNV density in the whole genome. In these high-density regions, the number of iSNVs at the first codon position was higher than at the second and third codon positions (Fisher’s exact test, P < 0.05; Fig. 1d). Moreover, the non-synonymous/synonymous iSNV ratio in these regions (23.8) was significantly higher than that of other regions of the viral genome (1.7, Fisher’s exact test, P < 0.001). While we did not observe a significant difference in AF between non-synonymous and synonymous iSNVs (Mann-Whitney U-tests, P = 0.367), the median AF of non-synonymous iSNVs (0.10) was higher than that of synonymous iSNVs (0.06, Fig. 1h). These results suggested that the iSNVs in high-density regions might be under stronger selection pressure.
Potential co-mutation patterns in high-density regions
We analyzed the number of iSNV sites and the proportion of shared iSNVs within high-density regions. The number of iSNV sites in high-density regions (0.06 iSNV sites/kb) was similar to that in other regions of the viral genome (0.05 iSNV sites/kb). Notably, the proportion of shared iSNVs (96.8%) among all iSNVs in high-density regions was significantly higher compared to other regions of the viral genome (22.9%; Fisher’s exact test, P < 0.001). The majority of these shared iSNVs within the high-density regions formed potential co-mutation patterns, as revealed by the shared iSNV network (Fig. 2a; Fig. S3), with shared nonsynonymous iSNVs—G5743C, T5744C, G5765A, G5766C, and C16708G—forming a significant cluster.
*A potential co-mutation pattern consisted of the five non-synonymous shared iSNV sites (G5743C, T5744C, G5765A, G5766C, and C16708G). (a) Network analysis of the five non-synonymous shared iSNV sites. Nodes denoted samples, and two nodes were connected through an edge if samples shared ≥1 iSNVs. The shared iSNVs that caused the cluster were shown on the top of the network. (b) Reads distribution of 5,743, 5,744, 5,765, and 5,766 positions. (c) The correlation heatmap of the five non-synonymous shared iSNV sites. (d) Regression analysis of the five non-synonymous shared iSNV sites showed that the cluster denoted the statistical significance: ***P < 2.5 × 10−87.
We then characterized co-occurring mutations at four genomic positions (5,743, 5,744, 5,765, and 5,766) across 752 high-coverage SARS-CoV-2 samples (≥100× at all target sites). After excluding reads with no mutations at these sites (the GTGG haplotype), the most common pattern observed was CCAC, corresponding to simultaneous mutations G5743C, T5744C, G5765A, and G5766C. This indicated that these shared iSNVs appeared together in the same virus strain (Fig. 2b). The reads exhibiting the CCAC pattern at four sites originated from 18 samples, all of which also carried the C16708G. To further evaluate the potential co-mutation pattern, we performed linear regression analysis and calculated Pearson correlation coefficients for iSNVs at these five positions. The results showed a strong correlation (r > 0.7) with high statistical significance (P < 2.5e-87; Fig. 2c and d). These findings indicated that these iSNVs contributed to a potential co-mutation pattern.
Shared iSNVs across samples
We investigated patterns of shared intra-host diversity between individuals. Most (1,041, 70.82%) iSNVs appeared in only a single sample. Among all iSNVs, 429 (29.18%) were present in at least two samples (Fig. 3a). The 197 iSNVs that occurred in more than five samples were not located at common sequencing error sites or homoplasious sites (32, 33). The shared iSNVs observed at seven positions had high AF across multiple samples, with only G13109A being a nonsynonymous iSNV (Fig. 3b). The G13109A was located in the ORF1ab gene and caused the amino acid aspartic acid (D) to be replaced by asparagine (N; D4282N). Additionally, among these seven mutations, the C7303T was present across different transmission clusters, indicating that shared iSNVs may arise independently in samples without epidemiological links.
Shared iSNVs across samples. (a) Statistics of shared iSNVs. Each bar represents the number of iSNVs occurring in a given number of patients (≥2). iSNVs shared in >5 samples are shown on top of the bars. (b) Distribution of shared iSNVs with high AF in multiple samples. (c) Pairs of samples collected between different clusters. (d) Pairs of samples collected within the same cluster. Each unique pair is shown as a single point. The number of shared iSNVs by each pair is shown on the y-axis, with the number of SNP differences between the pair of genomes on the x-axis.
To further explore the occurrence of shared iSNVs in sample pairs lacking epidemiological connections, we analyzed all unique sample pairs with detected iSNVs (n = 93,961). The majority of iSNVs were unique to samples, resulting in most sample pairs not sharing any iSNVs. Only 1.06% of the pairs (994 pairs) shared at least one iSNV. Of these pairs, 243 involved samples that belonged to different transmission clusters (Fig. 3c and d). Within these 243 pairs, 15 pairs showed SNP differences of just two to three and were collected within a ≤2-day interval. Additionally, 74% of these pairs were sequenced in different batches, lowering the likelihood that shared iSNVs were due to cross-contamination.
Co-infection cases can also confound transmission analysis based on shared iSNVs. An examination of AF at polymorphic sites in each sample confirmed that no co-infections were present in this study. This is likely because each transmission cluster was predominantly driven by a single sublineage strain.
The evolution patterns from iSNVs to SNPs
To avoid misclassifying Omicron-featured mutations (BA.1.1, BA.2, and BA.2.3) as SNPs, we excluded all sites containing featured mutations prior to subsequent analysis. Among 1,253 genomic sites harboring mutations with AF ≥ 0.03, we identified 37 sites where an iSNV in one sample corresponded to an identical base pair substitution reaching SNP status in at least one other distinct sample. We define these sites as potential fixed sites. The fixed sites displayed a higher AF compared to non-fixed sites (Fig. 4a). The proportion of nonsynonymous iSNVs in fixed sites was lower than that of synonymous iSNVs (Fig. 4b). Meanwhile, the nonsynonymous iSNVs in fixed sites were only distributed in ORF1ab, S, and ORF3a genes.
The evolution patterns from iSNVs to SNPs. (a) Distribution of AF for fixed and unfixed iSNVs. (b) Number of nonsynonymous and synonymous for fixed and unfixed iSNVs. (c) Box plot of patristic distances from iSNV tips and other tips to the nearest consensus branch change for 20 shared iSNV sites in the coding region. (d) The phylogeny where a consensus change is in close proximity to iSNVs with the relevant pair of nucleotides involved for the site 13,051. Tree branches are colored by the SNP at that position, and filled circles indicate iSNVs present in samples. For clarity, only support values > 80% are shown. (e) AF of mutation across samples. The mutations have been observed both as low-frequency variants and as fixed mutations.
We further investigated whether iSNVs can be used to resolve phylogenies and transmission clusters. If an iSNV evolves into an SNP through transmission, we would expect a phylogenetic association where samples containing the iSNV cluster with branches showing an SNP at the same sites. Of 113 sites shared across ≥2 samples, only 20 were fixed sites and located within protein-coding regions. For these 20 fixed iSNV sites, we observed that the patristic distance between a given iSNV position in one sample and the nearest sample with the same SNP was significantly lower than that of samples without the iSNV (P < 0.001; Fig. 4c). This suggested that iSNVs cluster within the phylogenetic tree, with branches supporting the same variants as SNPs.
When analyzing each site individually, 11 showed a significant association after applying the Benjamini-Hochberg correction (P < 0.05). For example, in site 13,051, the blue branches represent the SNP change from a C to T, with nearby iSNVs appearing as minor transitions at the ancestral nodes of the changing branches (Fig. 4d). Among 11 significant iSNV sites, we observed a gradual AF increase in C23978T and C20404T within a single transmission cluster (Fig. 4e). These findings suggested that iSNVs may act as a mutation reservoir for SNPs. We found that samples from the BA.1.1 sublineage carried iSNVs (C21618T and C26060T) at the defining positions of the BA.2 and BA.2.3 sublineages.
DISCUSSION
The emergence of the divergent Omicron lineage pandemic is of worldwide concern. Characterizing the intra-host diversity of SARS-CoV-2 is crucial for identifying potential variants and inferring transmission dynamics (5, 34, 35). Our analysis characterized the genetic diversity of iSNVs and provided insights into the likelihood of shared iSNVs independently emerging in epidemiologically unlinked individuals, as well as the transition of iSNVs into SNPs.
Since the emergence of SARS-CoV-2, there have been numerous mutant strains, with a few exhibiting significantly enhanced transmissibility and infectivity (36–38). Studying the mutation patterns in the SARS-CoV-2 genome helps identify specific regions or genes that have undergone positive selection. Our results showed that the distribution of iSNVs was relatively uniform across most regions of the whole genome, while uneven in some regions, consistent with previous studies (25). Among all the genes, the N gene appears to be the most conserved gene during this outbreak, making it a potential target for vaccine development (39, 40). Specifically, we found that two regions, located in nsp3 and nsp13, accumulated more iSNVs and were subject to more selection pressure than other regions in the genome. They have a higher iSNV density compared to other regions primarily due to the presence of shared iSNVs, which form a potential co-mutation pattern, including G5743C, T5744C, G5765A, G5766C, and C16708G. The first four mutations were located in the papain-like protease (PLpro) encoded by nsp3, which cleaves the viral polyprotein for assembly and exhibits deubiquitination activity to evade the host’s innate immune response (41, 42). The C16708G was located on nsp13, which inhibits interferon production in vivo (43, 44). The accumulation of iSNVs on PLpro and nsp13 may affect the pathogenicity and immune escape ability of SARS-CoV-2.
Evaluating within-host viral diversity is crucial for understanding the transmission process. A narrow transmission bottleneck allows only a limited number of variants to successfully transmit between hosts. Our results revealed limited within-host diversity of SARS-CoV-2, suggesting insufficient selective pressure for the virus to adapt to the host environment. This limited diversity, together with our finding that most samples lack shared iSNVs, supports the existence of a narrow transmission bottleneck (10, 23). Such a bottleneck not only influences viral evolution but also restricts the utility of iSNVs for high-resolution transmission inference.
Shared iSNVs observed across genomes separated by time and distinct evolutionary lineages indicate their convergent emergence, complicating their use in transmission inference (17). In contrast to previous studies (35, 45), which faced challenges in establishing epidemiological connections, our samples, derived from four transmission clusters, allow us to better understand the extent of the emergence of convergent iSNVs. Our findings revealed that 24.4% of sample pairs sharing at least one iSNV originated from different transmission clusters. Moreover, even in cases where consensus sequences were highly similar and sampling dates were within 2 days apart, iSNV sharing can still occur between samples with no epidemiological links. Given that convergent evolution can significantly contribute to the emergence of shared iSNVs, caution should be exercised when using these shared iSNVs to infer transmission (46).
While convergent evolution may limit direct transmission inference from shared iSNVs, our findings demonstrate that, in certain cases, these iSNVs can still be transmitted successfully and significantly influence the evolution of phylogenetic consensus sequences (22, 23). Additionally, the frequencies of shared iSNV can be observed to gradually increase over time, becoming fixed in subsequent infections. These observations underscore the critical role of shared iSNVs in elucidating transmission dynamics. The iSNVs serve as a reservoir of mutations for potential epidemic variants (5, 47). Our results indicate that iSNVs detected in samples from earlier sublineages correspond to characteristic mutations observed in later-emerging sublineages, highlighting their important role in the formation of SNPs. This process may drive the evolution of new viral sublineages, especially those with enhanced transmissibility or virulence. Under specific high selective pressures, iSNVs can undergo adaptive evolution, transitioning from iSNVs to SNPs, which facilitates the virus’s ability to adapt and spread (48).
Our study has several limitations. First, although we detected iSNVs in early sublineage samples that are characteristic mutations of later sublineages, we did not observe the progression of these iSNVs becoming fixed SNPs. Therefore, future studies should increase the sample size and sampling duration to further investigate how variants of concern mutations and lineages become fixed as SNPs. Second, the biological functions of the identified potential co-mutations were not validated. Further studies are needed to determine whether these co-occurring iSNVs are adaptive mutations and how they affect viral function.
Conclusions
In summary, our findings revealed that the significant enrichment of shared iSNVs in high-density regions drives the formation of potential co-mutation patterns. Although shared iSNVs are important, they alone are insufficient to reliably reconstruct transmission pathways due to the interference of convergent evolution. The iSNVs serve as mutation reservoirs, with iSNVs from early sublineages potentially developing into characteristic mutations in later sublineages. These insights enhanced our understanding of the mutational processes, evolutionary dynamics, and transmission mechanisms of SARS-CoV-2.
The reference list from the paper itself. Each links out to its DOI / PubMed record.
- 1Carabelli AM, Peacock TP, Thorne LG, Harvey WT, Hughes J, Peacock SJ, Barclay WS, de Silva TI, Towers GJ, Robertson DL, COVID-19 Genomics UK Consortium. 2023. SARS-Co V-2 variant biology: immune escape, transmission and fitness. Nat Rev Microbiol 21:162–177. doi:10.1038/s 41579-022-00841-736653446 PMC 9847462 · doi ↗ · pubmed ↗
- 2Wang L, Møhlenberg M, Wang P, Zhou H. 2023. Immune evasion of neutralizing antibodies by SARS-Co V-2 Omicron. Cytokine Growth Factor Rev 70:13–25. doi:10.1016/j.cytogfr.2023.03.00136948931 PMC 9985919 · doi ↗ · pubmed ↗
- 3Wolf JM, Wolf LM, Bello GL, Maccari JG, Nasi LA. 2023. Molecular evolution of SARS-Co V-2 from December 2019 to August 2022. J Med Virol 95:e 28366. doi:10.1002/jmv.2836636458547 PMC 9877913 · doi ↗ · pubmed ↗
- 4Yamasoba D, Kimura I, Nasser H, Morioka Y, Nao N, Ito J, Uriu K, Tsuda M, Zahradnik J, Shirakawa K, et al.. 2022. Virological characteristics of the SARS-Co V-2 Omicron BA.2 spike. Cell 185:2103–2115. doi:10.1016/j.cell.2022.04.03535568035 PMC 9057982 · doi ↗ · pubmed ↗
- 5Sun F, Wang X, Tan S, Dan Y, Lu Y, Zhang J, Xu J, Tan Z, Xiang X, Zhou Y, He W, Wan X, Zhang W, Chen Y, Tan W, Deng G. 2021. SARS-Co V-2 quasispecies provides an advantage mutation pool for the epidemic variants. Microbiol Spectr 9:e 0026121. doi:10.1128/spectrum.00261-2134346744 PMC 8552775 · doi ↗ · pubmed ↗
- 6Hou YJ, Chiba S, Halfmann P, Ehre C, Kuroda M, Dinnon KH, Leist SR, Schäfer A, Nakajima N, Takahashi K, et al.. 2020. SARS-Co V-2 D 614G variant exhibits efficient replication ex vivo and transmission in vivo. Science 370:1464–1468. doi:10.1126/science.abe 849933184236 PMC 7775736 · doi ↗ · pubmed ↗
- 7Yurkovetskiy L, Wang X, Pascal KE, Tomkins-Tinch C, Nyalile TP, Wang Y, Baum A, Diehl WE, Dauphin A, Carbone C, Veinotte K, Egri SB, Schaffner SF, Lemieux JE, Munro JB, Rafique A, Barve A, Sabeti PC, Kyratsous CA, Dudkina NV, Shen K, Luban J. 2020. Structural and functional analysis of the D 614G SARS-Co V-2 spike protein variant. Cell 183:739–751. doi:10.1016/j.cell.2020.09.03232991842 PMC 7492024 · doi ↗ · pubmed ↗
- 8Su YCF, Zeller MA, Cronin P, Zhang R, Zhuang Y, Ma J, Wong FY, Ng GGK, O’Toole Á, Rambaut A, Low JG, Smith GJD. 2025. Rapid emergence and evolution of SARS-Co V-2 intrahost variants among COVID-19 patients with prolonged infections, Singapore. Emerg Infect Dis 31:1537–1549. doi:10.3201/eid 3108.24141940592354 PMC 12309778 · doi ↗ · pubmed ↗