Impact of Ambient PM₁₀ and SO₂ Levels on Intensive Care Unit Admissions Due to Cardiopulmonary Diseases in a Tertiary Care Hospital
Melike Yüksel Yavuz, Hüseyin Döngelli, Mehmet Yavuz, Adem Şahin, Murat Güneş, Işıl Köse Güldoğan, Nimet Şenoğlu

TL;DR
The study finds that higher PM₁₀ pollution is linked to more ICU admissions for lung and heart issues, but not higher mortality.
Contribution
This study is the first to examine the link between PM₁₀ and ICU admissions with a one-month lag for cardiovascular cases.
Findings
Higher PM₁₀ levels were significantly associated with increased pulmonary ICU admissions.
PM₁₀ showed a delayed effect on cardiovascular ICU admissions when using a one-month lag model.
SO₂ levels were not significantly linked to ICU admissions or mortality.
Abstract
Ambient air pollution, especially particulate matter (PM₁₀) and sulfur dioxide (SO₂), has been implicated in exacerbating cardiopulmonary diseases. While emergency department visits have been widely studied, the impact of pollution on intensive care unit (ICU) admissions and mortality is less understood. This retrospective observational study aimed to evaluate the association between monthly air pollutant levels and ICU admissions for cardiopulmonary conditions, as well as in-hospital mortality. We retrospectively analyzed 6,112 ICU admissions in a tertiary hospital from January 2012 to November 2019. Using defined inclusion criteria, 227 pulmonary and 344 cardiovascular ICU admissions were selected. Monthly PM₁₀ and SO₂ levels were obtained from official air monitoring stations. A one-month lag model was applied for cardiovascular admissions. Multivariate models were used to assess…
Genes, proteins, chemicals, diseases, species, mutations and cell lines named across the full text — each resolved to its canonical identifier and authoritative record.
Click any figure to enlarge with its caption.
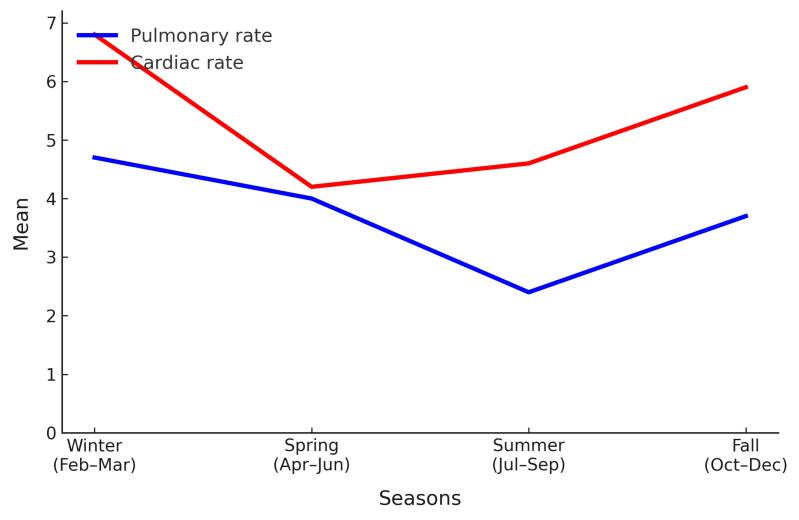 Figure 1
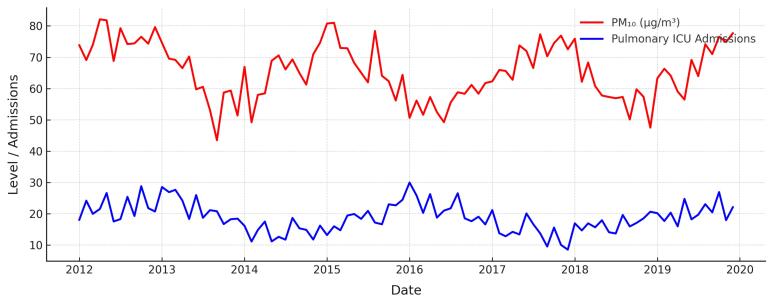 Figure 2
|
| |
| Age median (IQR) | 70 (60‒79) |
| Gender n (%) | |
| Female | 342 (60) |
| Male | 229 (40) |
| Hospitalization duration days median (IQR) | 8 (3‒23) |
| SAPS II score median (IQR) | 59 (47.25‒72) |
| Laboratory findings median (IQR) | |
| Creatinine | 1.4 (1.1‒2.5) |
| Albumin | 2.9 (2.5‒3.4) |
| WBC | 14.9 (11.1‒19.9) |
| CRP | 76.1 (25.3‒165.7) |
| Procalcitonin | 1.41 (0.36‒7.75) |
| Diagnosis | |
| Pneumonia | 186 (32.6) |
| COPD exacerbation | 51 (8.9) |
| Pulmonary embolism | 8 (1.4) |
| Congestive heart failure | 165 (28.9) |
| Acute coronary syndrome | 91 (15.9) |
| Other causes | 70 (12.3) |
| Comorbidities | |
| Cardiovascular disease | 190 (33.3) |
| COPD | 98 (17.2) |
| Diabetes mellitus | 158 (27.7) |
| Chronic kidney disease | 89 (15.5) |
| Cerebrovascular accident | 37 (6.5) |
| Malignancy | 34 (6) |
| Admission origin | |
| Emergency room | 168 (29.4) |
| Wards | 254 (44.5) |
| Other | 149 (26.1) |
| Mortality | |
| Intensive care unit | 235 (41.1) |
| In-hospital | 207 (36.2) |
|
|
|
| |
| Age median (IQR) | 69 (22) | 70 (19) | 0.922 |
| Gender n (%) | 0.596 | ||
| Female | 88 (38.8) | 141 (41) | |
| Male | 139 (61.2) | 203 (59) | |
| Hospitalization duration days median (IQR) | 11 (22) | 7 (17) | 0.009 |
| SAPS II score median (IQR) | 60.2 (14) | 60 (13) | 0.003 |
| Laboratory findings median (IQR) | |||
| Creatinine mg/dL | 1.6 (1.7) | 1.4 (1.2) | 0.885 |
| Albumin g/dL | 2.7 (0.8) | 3.1 (0.9) | < 0.001 |
| WBC 10*3 | 13.9 (9) | 15.5 (9) | 0.075 |
| CRP mg/dL | 96.7 (57.2) | 67 (120) | < 0.001 |
| Procalcitonin IU/dL | 1.17 (6.23) | 1.71 (7.09) | 0.212 |
| Comorbidities n (%) | |||
| Cardiovascular disease | 16 (7) | 174 (50.6) | < 0.001 |
| COPD | 64 (28.2) | 34 (9.9) | < 0.001 |
| Diabetes mellitus | 86 (37.9) | 73 (21.2) | < 0.001 |
| Chronic kidney disease | 120 (52.9) | 169 (49.1) | 0.382 |
| Cerebrovascular accident | 23 (10.1) | 14 (4.1) | 0.004 |
| Malignancy | 28 (12.3) | 6 (1.7) | < 0.001 |
| PM10 µg/m³median (IQR) | 42 (18) | 39 (14) | 0.280 |
| SO2 ppmmedian (IQR) | 9 (4) | 9 (4) | 0.982 |
| Mortality n(%) | 171 (75.3) | 303 (88.1) | < 0.001 |
|
|
| |||||
|
|
|
|
|
|
| |
| Age | 0.008 | -0.014/0.029 | 0.480 | 0.026 | -0.015/0.026 | 0.538 |
| PM10 (µg/m³) | 0.014 | 0.003/0.026 | 0.015 | 0.017 | 0.003/0.032 | 0.020 |
| SO2 (ppm) | 0.008 | -0.036/0.051 | 0.725 | -0.009 | -0.058/0.039 | 0.704 |
| PM10 Lag1 | 0.011 | -0.001/0.022 | 0.065 | |||
| SO2 (ppm)Lag1 | 0.007 | -0.033/0.048 | 0.724 | |||
| Session (Winter) | 0.190 | -0.154/0.535 | 0.279 | 0.189 | -0.145/0.523 | 0.268 |
| Session (Spring) | 0.087 | -0.257/432 | 0.619 | 0.322 | -0.108/0.752 | 0.142 |
| Session (Summer) | -0.300 | -0.659/0.059 | 0.101 | -0.076 | -0.503/0.350 | 0.725 |
| Session (Fall) | Reference | |||||
|
|
| |||||
|
|
|
|
|
|
| |
| Age | -0.001 | -0.020/0.019 | 0.939 | -0.006 | -0.026/0.013 | 0.519 |
| PM10 (µg/m³) | 0.008 | -0.004/0.020 | 0.199 | |||
| SO2 (ppm) | 0.005 | -0.036/0.047 | 0.804 | -0.022 | -0.066/0.023 | 0.337 |
| PM10 (µg/m³) Lag1 | 0.015 | 0.003-0.027 | 0.011 | 0.018 | 0.005/0.031 | 0.006 |
| SO2 (ppm)Lag1 | 0.014 | -0.029/0.057 | 0.517 | |||
| Session (Winter) | 0.184 | -0.159/0.529 | 0.292 | |||
| Session (Spring) | -0.217 | -0.568/0.134 | 0.226 | |||
| Session (Summer) | -0.144 | -0.490/0.203 | 0.416 | |||
| Session (Fall) | Reference | |||||
|
|
| |||||
|
|
|
|
|
|
| |
| Age | 1.009 | 1.002‒1.015 | 0.008 | 1.006 | 0.999‒1.014 | 0.116 |
| Female gender | 1.005 | 0.836‒1.208 | 0.961 | 1.027 | 0.846‒1.246 | 0.789 |
| SAPS score | 1.016 | 1.010‒1.021 | < 0.001 | 1.012 | 1.006‒1.018 | < 0.001 |
| Cardiac versus pulmonary | 1.316 | 1.091‒1.588 | 0.004 | 1.143 | 0.850‒1.538 | 0.375 |
| PM10 | 0.995 | 0.987‒1.002 | 0.157 | 0.995 | 0.986‒1.004 | 0.295 |
| SO2 (ppm) | 0.974 | 0.944‒1.005 | 0.105 | 0.993 | 0.956‒1.030 | 0.694 |
| PM10 (µg/m³) Lag1 | 0.996 | 0.988‒1.003 | 0.269 | |||
| SO2 (ppm)Lag1 | 0.975 | 0.946‒1.005 | 0.096 | |||
| Infection | 0.768 | 0.641‒920 | 0.004 | 0.834 | 0.647‒1.075 | 0.161 |
| CVD | 1.144 | 0.946‒1.384 | 0.167 | 1.024 | 0.814‒1.289 | 0.839 |
| COPD | 0.854 | 0.661‒1.104 | 0.228 | 0.951 | 0.724‒1.249 | 0.719 |
| CKD | 1.506 | 1.255‒1.807 | < 0.001 | 1.309 | 1.031‒1.662 | 0.027 |
| CVA | 0.693 | 0.463‒1.037 | 0.074 | 0.927 | 0.612‒1.403 | 0.720 |
| DM | 1.336 | 1.098‒1.627 | 0.004 | 1.142 | 0.890‒1.465 | 0.298 |
| Malignancy | 1.202 | 0.825‒1.752 | 0.336 | |||
| Procalcitonin | 1.001 | 0.997‒1.003 | 0.981 | |||
| CRP | 1.001 | 0.999‒1.001 | 0.663 | |||
| WBC | 1.006 | 0.996‒1.017 | 0.249 | 1.009 | 0.998‒1.020 | 0.099 |
| Creatinine | 1.085 | 1.035–1.139 | 0.001 | 1.020 | 0.946‒1.100 | 0.600 |
| Albumin | 0.967 | 0.871‒1.072 | 0.522 | |||
Peer Reviews
No public reviews on file for this paper yet. If you reviewed it on a platform where reviews are public (OpenReview, ICLR, NeurIPS, ICML), you can paste yours below so the community can read it here.
Videos
No videos yet. Explain this paper in a talk, walkthrough, or lecture? Add one.
Taxonomy
TopicsAir Quality and Health Impacts · Respiratory Support and Mechanisms · Occupational exposure and asthma
Introduction
Air pollution is among the most significant environmental factors with substantial short- and long-term adverse effects on human health.^1^ Particulate matter with a diameter of 10 micrometers or smaller (PM_10_) and sulfur dioxide (SO_2_) are among the most concerning air pollutants due to their pervasive occurrence and well-documented associations with negative health effects.These substances have been shown to worsen chronic illnesses, provoke acute medical events, and contribute to higher rates of hospital admissions, especially in high-risk groups such as older adults and individuals with underlying health conditions.^2^
Multiple factors, such as pollutant concentration, length of exposure, seasonal fluctuations, and presence of comorbidities, can influence the impact of air pollution on human health.^3^ Although numerous studies have assessed how air pollution affects emergency room visits and overall hospital admissions, limited research has specifically addressed its association with admissions to intensive care units (ICUs), which often represent more critical clinical conditions.^4-6^ Extensive epidemiological research has linked both short- and long-term exposure to PM_10_ and SO_2_ with a heightened risk of developing respiratory conditions such as asthma, chronic obstructive pulmonary disease (COPD), and pneumonia.^7,8^ Likewise, exposure to air pollutants has been associated with adverse cardiovascular events, including heart failure, ischemic heart disease, and arrhythmias.^9^ While several studies have explored the association between air pollution and ICU admissions, as well as in-hospital mortality, the nature of this relationship remains insufficiently understood.^10,11^
Moreover, the biological plausibility of pollutant-related ICU admissions is supported by several mechanistic studies. PM_10_ and SO_2_ have been shown to induce oxidative stress, systemic inflammation, endothelial dysfunction, and autonomic imbalance, all of which can precipitate acute respiratory or cardiovascular decompensation requiring ICU care.^12^ As one of the world’s megacities, Tehran, Iran, experiences significant seasonal variations in pollutant levels, particularly during the colder months, due to atmospheric inversion combined with heavy traffic and urban-industrial emissions. According to statistics from the Iranian Ministry of Health, ischemic heart disease and respiratory illnesses consistently rank among the leading causes of hospitalization and mortality.^13,14^ We hypothesized that monthly exposure to air pollutants, specifically PM_10_ and SO_2_, may influence ICU admissions due to pulmonary or cardiovascular events. This study aimed to investigate this potential association and to identify factors related to in-hospital mortality.
Patients and Methods
Patients and Data Collection
This retrospective observational single-center study was conducted using data from patients who were admitted to the ICU between January 2012 and November 2019. A total of 6,112 ICU admissions were initially reviewed, from which 227 patients with pulmonary conditions and 344 patients with cardiovascular conditions were selected for analysis. Pulmonary ICU admissions were defined based on ICD-10 codes J12–J18 (pneumonia), J44 (COPD), and J80 (ARDS). Diagnoses were confirmed by attending physicians and coded within the hospital information system. The inclusion criteria focused on adult patients (aged 18 years and older) who were diagnosed with either pulmonary or cardiac conditions and who required ICU care during the specified study period. The exclusion criteria included patients with incomplete clinical data, trauma cases, sepsis-related ICU admissions, surgical ICU cases, and individuals under 18 years of age at the time of admission. Patient clinical data, including demographic information (age and sex), comorbidities, prescribed medications, reasons for ICU admission, and routine laboratory test results, were retrieved from the hospital’s electronic health records system. The database used for data collection was maintained by the hospital’s Information management system, which ensured accurate and comprehensive data retrieval.
The pulmonary conditions included in the analysis were primarily pneumonia, COPD, and acute respiratory distress syndrome (ARDS), while the cardiac conditions primarily consisted of congestive heart failure, acute coronary syndrome, and arrhythmias. The severity of illness at the time of ICU admission was assessed using the Simplified Acute Physiology Score II (SAPS II), a validated tool for predicting mortality and morbidity in critically ill patients. Monthly average concentrations of PM_10_ (µg/m³) and SO_2_ (ppm) were obtained from the İzmir Metropolitan Municipality Air Quality Monitoring System, specifically from the station closest to the hospital (within a 20-km radius). Data were derived from two continuous monitoring stations with > 95% data completeness. Missing daily values ( < 2%) were imputed using linear interpolation.
To investigate temporal dynamics, lag structures were defined as lag 0 (same month), lag 1 (previous month), and lag 2 (two months prior). The final analysis focused on lag 1, based on prior literature suggesting delayed inflammatory responses to pollution exposure. This study was reported in accordance with the STROBE (Strengthening the Reporting of Observational Studies in Epidemiology) guidelines for observational research.
Statistical Analysis
All analyses were conducted using the Statistical Package for the Social Sciences (SPSS) version 24.0. Normality was tested using the Kolmogorov-Smirnov and Shapiro-Wilk tests. Parametric continuous variables were compared with Student’s T test, while the Mann-Whitney U test was used for non-parametric continuous variables. Results were presented as mean ± standard deviation (SD) and median (interquartile range). Categorical variables were compared using the Chi-Square and Fisher’s exact tests, with results reported as n (%). This study aimed to investigate the relationship between air pollution levels (PM_10_ and SO_2_) and monthly ICU admission rates using a generalized linear model. Data on air pollution levels and ICU admissions were collected over an eight-year period (2012–2019). Monthly averages of PM_10_ (µg/m³) and SO_2_ (ppm) were used for the independent variables, while the total number of ICU admissions per month was the dependent variable. To examine the delayed effects of air pollution, lagged values of PM_10_ and SO_2_ from the previous month were included in the model. Pulmonary and cardiac ICU hospitalization rates were analyzed as separate dependent variables. In-hospital mortality was assessed using Cox regression and Kaplan-Meier analyses. The relationship between air pollution (PM_10_ and SO_2_) and monthly ICU admissions was assessed using a generalized linear regression model with a log-link function, assuming a Poisson distribution, appropriate for count data. Model diagnostics, including deviance, overdispersion, and residual analysis, were evaluated. Covariates adjusted for included age, sex, and seasonality (warm vs. cold months). Statistical significance was determined using p-values, with a threshold of 0.05. Confidence intervals (CIs) were reported at the 95% level for all effect estimates.
Results
Clinical Characteristics of Study Group
This study involved 571 patients with a median age of 70 years, 60% of whom were female. During the study period, all patients ICU admissions were recorded, of which 227 (40%) were due to pulmonary conditions and 344 (60%) due to cardiac conditions. The median duration of ICU hospitalization was 8 days. The most frequent diagnoses were pneumonia (32.6%), congestive heart failure (28.9%), and acute coronary syndrome (15.9%). Cardiovascular disease (33.3%) and diabetes mellitus (27.7%) were the most common comorbidities. The ICU mortality rate was 41.1%, while in-hospital mortality was 36.2% (Table 1).
Comparison of Pulmonary and Cardiac Admissions
Pulmonary patients (n = 227) had a median age of 69, while cardiac patients (n = 344) had a median age of 70 (P = 0.922), with no significant gender differences (P = 0.596). Pulmonary patients had longer ICU hospitalization (11 days vs. 7 days, P = 0.009) and higher SAPS II scores (60.2 vs. 60, P = 0.003). Significant differences were found in albumin (P < 0.001) and CRP levels (P < 0.001), with pulmonary patients having lower albumin and higher CRP. Pulmonary patients had higher rates of COPD (28.2% vs. 9.9%, P < 0.001) and chronic kidney disease (CKD) (52.9% vs. 49.1%, P = 0.382), while cardiac patients had more cardiovascular disease (50.6% vs. 7%, P < 0.001). Mortality rates were significantly higher in cardiac patients (88.1% vs. 75.3%, P < 0.001). SO_2_ levels were comparable between pulmonary and cardiac patient groups (median 9 ppm, IQR: 4), and the difference was not statistically significant (P = 0.982). This suggests that SO_2_ exposure did not differ between groups and may not have had a differential impact based on disease type. Similarly, PM_10_ levels were slightly higher in the pulmonary group compared to the cardiac group (median 42 µg/m³ vs. 39 µg/m³), but this difference was also not statistically significant (P = 0.280). While mean exposure levels did not vary significantly between groups, the significant associations observed in regression analyses suggest that the health effects of PM_10_ may be more closely related to temporal variability and lag effects rather than average concentrations alone (Table 2). The rate of patients hospitalized in intensive care for pulmonary and cardiac causes over multiple sessions is shown in Figure 1.
**
Factors Associated with Pulmonary ICU Hospitalization Rate in Generalized Linear Models
Univariate analysis revealed that PM_10_ exposure was significantly associated with an increase in pulmonary ICU hospitalization rates (β = 0.014, P = 0.015), while age, SO_2_, and seasonal variations showed no significant effects (P > 0.05). In multivariate analysis, PM_10_ remained a significant factor (β = 0.017, P = 0.020), indicating a positive correlation with pulmonary ICU hospitalization rates. Additionally, a Spearman correlation analysis was performed to further assess the relationship between PM_10_ levels and pulmonary ICU admissions. The analysis revealed a statistically significant moderate positive correlation (r = 0.76, P = 0.004), reinforcing the association identified in the generalized linear regression model. Figure 2 illustrates the temporal association between monthly average PM_10_ levels (µg/m³) and the number of pulmonary ICU admissions over eight years. A parallel upward trend in PM_10_ concentration and pulmonary ICU admissions was observed, particularly during winter months, suggesting a potential seasonal pattern. However, age, SO_2_, and seasonal variations (winter, spring, summer) did not demonstrate significant associations in either the univariate or multivariate models (P > 0.05) (Table 3).
**
Factors Associated with Cardiac ICU Hospitalization Rate in Generalized Linear Models
In the univariate analysis, age, SO_2_, or seasonal variations did not show any significant associations with cardiac ICU hospitalization rates (P > 0.05). However, PM_10_ exposure showed a marginal association (β = 0.008, P = 0.199). In the multivariate analysis, only PM_10_ Lag1 (previous month’s exposure) demonstrated a significant positive relationship with cardiac ICU hospitalization rates (β = 0.018, P = 0.006). Age, SO_2_, and seasonal variations did not show significant associations in either analysis (P > 0.05) (Table 4).
Factors Associated with In-hospital Mortality
In the univariate analysis, age, SAPS score, cardiac diagnosis, infection, CKD, and diabetes mellitus (DM) were significantly associated with survival (P < 0.05). Specifically, older age (HR = 1.009, P = 0.008) and higher SAPS score (HR = 1.016, P< 0.001) were strong predictors of poor survival. Cardiac diagnosis also increased the risk (HR = 1.316, P = 0.004). Interestingly, infection was associated with a reduced risk of in-hospital mortality in our cohort (HR = 0.768, P = 0.004). This seemingly paradoxical result may be due to selection bias or differential ICU admission thresholds, where patients admitted with isolated infections (particularly pneumonia) may have had fewer comorbidities or better physiological reserves compared to those admitted with decompensated cardiac conditions or multi-organ failure. Additionally, infections may have prompted earlier ICU hospitalization and intervention, contributing to improved outcomes relative to other critically ill patients. In the multivariate analysis, only SAPS score (HR = 1.012, P < 0.001) and CKD (HR = 1.309, P = 0.027) remained significant predictors of survival, while the impact of age and cardiac diagnosis became non-significant. The effects of environmental factors like PM_10_ and SO_2_ exposure were not significant in either analysis (Table 5).
Discussion
Our findings demonstrated that long-term exposure to PM_10_ was significantly associated with an increased rate of pulmonary ICU admissions, both in univariate and multivariate models. Although the observed differences in PM_10_ exposure and ICU admission rates were statistically significant, the effect sizes also suggest clinical relevance, particularly in the context of public health policy and resource allocation for respiratory care. Similarly, lagged PM_10_ exposure (from the previous month) showed a significant relationship with cardiac ICU admissions, suggesting a potential delayed effect of air pollution on cardiovascular morbidity. In contrast, no significant associations were observed between SO_2_ levels and ICU admission rates in either diagnostic group. The differential associations observed (PM_10_ with both cardiac and pulmonary ICU admissions, and SO_2_ with no significant outcomes) may reflect the broader systemic effects of particulate matter compared to the more localized respiratory irritation caused by sulfur dioxide. Higher SAPS II scores and the presence of CKD emerged as significant predictors of in-hospital mortality, while air pollution parameters such as PM_10_ and SO_2_ were not independently associated with survival outcomes.
Previous studies have typically examined short-term exposure to air pollution, often focusing on durations measured in days. These studies have similarly reported that indicators such as SO_2_ and PM_10_ are associated with increased rates of hospital admissions and higher rates of hospitalization due to pulmonary or cardiac causes.^15-18^ In our study, we aimed to explore the effects of more prolonged exposure, utilizing monthly average values of air pollutants. We observed that monthly PM_10_ concentrations were significantly associated with increased pulmonary-related admissions, while lagged PM_10_ values (reflecting exposure from the previous month) were significantly associated with cardiac-related hospitalizations. These findings suggest that the adverse health effects of air pollution persist even with extended exposure durations. In contrast to PM_10_, SO_2_ levels were not found to have a significant impact on admission rates in our study. We believe the discrepancy in findings may be due to the fact that previous studies primarily investigated the short-term effects of SO_2_, whereas our study focused on its potential long-term impact on ICU admissions.^9,18^
Consistent with previous studies demonstrating that long-term exposure to air pollutants such as PM_10_ increases cardiovascular mortality, our findings also showed that lagged PM_10_ values were associated with higher rates of cardiovascular admissions.^19^ This suggests that, unlike the more immediate impact of air pollution on the respiratory system, its adverse effects on the cardiovascular system may manifest with a delayed response.
Numerous studies have demonstrated that exposure to smaller particulate pollutants, such as PM_2.5_, can exacerbate both cardiac and pulmonary conditions even over very short periods, and is also associated with increased in-hospital mortality and morbidity, including prolonged duration of mechanical ventilation or hospitalization.^11,16,17,20^ However, due to the design of our study, we were unable to assess the effects of PM_2.5_. Interestingly, in an in-vitro lung cell study investigating genetic alterations caused by chronic exposure to PM_2.5_ and PM_10_, PM_10_ was found to induce more extensive genetic changes.^21^ In line with this, our findings showing that both prolonged and lagged PM_10_ exposure were associated with adverse outcomes may suggest that PM_10_ could potentially exert more harmful effects than PM_2.5_ in the context of chronic exposure. Our findings are also in line with the results of the large-scale cohort study conducted by Gutman et al in 2022, which included over two million adults across a major region in France. In their study, long-term exposure to ambient PM_10_, NO_2_, and O_3_ was significantly associated with both the incidence and in-hospital mortality of ARDS. Specifically, each 10 µg/m³ increase in PM_10_ exposure was associated with a 13% higher incidence of ARDS (HR: 1.13, 95% CI: 1.07–1.19) and a 15% increase in ARDS-related hospital mortality (HR: 1.15, 95% CI: 1.04–1.27). Similarly, in our study, elevated PM_10_ levels were significantly associated with increased pulmonary ICU admission rates (β = 0.017, P = 0.020), and this association was further supported by a moderate-to-strong positive Spearman correlation (r = 0.76, P = 0.004). When considered together, these findings highlight that exposure to particulate matter such as PM_10_ not only contributes to the burden of respiratory disease but may also drive more severe clinical outcomes, including the need for intensive care and increased mortality.^22^
In our study, neither PM_10_ nor SO_2_ showed a significant association with in-hospital mortality. However, it is important to note that the pollution data used represented average values from the month preceding ICU hospital admission, and thus did not reflect real-time in-hospital exposure. While previous studies have reported a relationship between pre-admission air pollution exposure and increased mortality, our study differed in that it utilized monthly average concentrations and focused exclusively on PM_10_ and SO_2_.^11,23^ These methodological differences may explain the discrepancy in findings. Notably, among all evaluated variables, only the presence of CKD emerged as an independent predictor of in-hospital mortality. Given that the kidneys play a central role in maintaining fluid, electrolyte, and acid-base homeostasis, the presence of chronic renal dysfunction may have significantly contributed to poor outcomes in this cohort of patients admitted to the ICU for pulmonary and cardiac causes.^24^
This study has several limitations that should be acknowledged. It was conducted in a single center, which may limit the generalizability of the findings to broader populations or different geographic regions. Exposure assessment was based on fixed-site monitoring stations rather than individual-level exposure, which may not accurately reflect each patient’s true pollutant exposure due to variations in residential proximity, indoor air quality, or personal behaviors. The retrospective design may be prone to information bias and residual confounding due to unmeasured variables. Although the completeness of environmental data was over 95%, linear interpolation was applied for < 2% of missing daily values, which may still introduce minor biases.Air pollution exposure was assessed using monthly average concentrations, which may not accurately reflect short-term exposure peaks that could trigger acute clinical events. Moreover, the analysis was limited to PM_10_ and SO_2_, as PM_2.5_ data were unavailable during the earlier years of the study period, precluding assessment of finer particulate matter known to have significant health effects. In addition, the use of fixed monitoring station data assumes uniform exposure for all individuals, without accounting for personal behaviors, time-activity patterns, or residential proximity to pollution sources, potentially resulting in exposure misclassification. The study also did not include other relevant environmental variables such as temperature, humidity, or concurrent respiratory infections like influenza, which may have acted as confounding factors. Furthermore, indoor air pollution sources and occupational exposures, both of which can influence respiratory and cardiovascular outcomes, were not evaluated. Although comorbidities were recorded, the severity of underlying conditions (e.g. stages of CKD or heart failure) and the use of medications that could modulate clinical outcomes were not incorporated into the analysis. Lastly, while the study focused on ICU admission rates and in-hospital mortality, it did not assess other clinically relevant outcomes such as duration of ICU stay, mechanical ventilation requirement, or post-discharge prognosis.
Conclusion
In conclusion, our findings indicate that monthly average PM_10_ concentrations are significantly associated with increased ICU admission rates, particularly for pulmonary causes. Moreover, lagged PM_10_ exposure was found to have a notable effect on cardiac ICU hospitalization rates, suggesting a delayed impact of air pollution on cardiovascular health. However, neither PM_10_ nor SO_2_ had a significant effect on in-hospital mortality, and SO_2_ levels did not show an association with ICU hospitalization rates.
The reference list from the paper itself. Each links out to its DOI / PubMed record.
- 1Cohen AJ Brauer M Burnett R Anderson HR Frostad J Estep K Estimates and 25-year trends of the global burden of disease attributable to ambient air pollution: an analysis of data from the Global Burden of Diseases Study 2015 Lancet 20173891008219071810.1016/s 0140-6736(17)30505-628408086 PMC 5439030 · doi ↗ · pubmed ↗
- 2World Health Organization (WHO). WHO Global Air Quality Guidelines: Particulate Matter (PM 2.5 and PM 10), Ozone, Nitrogen Dioxide, Sulfur Dioxide and Carbon Monoxide. Geneva: WHO; 2021. 34662007 · pubmed ↗
- 3Wu H Eckhardt CM Baccarelli AA Molecular mechanisms of environmental exposures and human disease Nat Rev Genet 20232453324410.1038/s 41576-022-00569-336717624 PMC 10562207 · doi ↗ · pubmed ↗
- 4Dominski FH Lorenzetti Branco JH Buonanno G Stabile L Gameiro da Silva M Andrade A Effects of air pollution on health: a mapping review of systematic reviews and meta-analyses Environ Res 202120111148710.1016/j.envres.2021.11148734116013 · doi ↗ · pubmed ↗
- 5Bourdrel T Bind MA Béjot Y Morel O Argacha JF Cardiovascular effects of air pollution Arch Cardiovasc Dis 2017110116344210.1016/j.acvd.2017.05.00328735838 PMC 5963518 · doi ↗ · pubmed ↗
- 6Ko UW Kyung SY Adverse effects of air pollution on pulmonary diseases Tuberc Respir Dis (Seoul)2022854313910.4046/trd.2022.011636097730 PMC 9537663 · doi ↗ · pubmed ↗
- 7Shin S Bai L Burnett RT Kwong JC Hystad P van Donkelaar A Air pollution as a risk factor for incident chronic obstructive pulmonary disease and asthma A 15-year population-based cohort study Am J Respir Crit Care Med 2021203911384810.1164/rccm.201909-1744 OC 33147059 · doi ↗ · pubmed ↗
- 8Buyuksirin M Anar C Yüksel Yavuz M Polat G AlıcıİO Akşit Yaşar H The effect of air pollution on the rates of application to emergency service and hospitalization in a chest diseases hospital, in Izmir, Turkey Fresenius Environ Bull 201928756127