Rate and Outcomes of Second Visits to the ED Among Patients Discharged With Non-specific Abdominal Pain in a Tertiary Hospital in Saudi Arabia
Munira Alkhashan, Rakan Alsinaideh, Salman Alkhodairy, Mohammed Alqadhibi, Abdulaziz Alanzan

TL;DR
The study found that 7.4% of patients discharged with non-specific abdominal pain revisited the emergency department within three days with a different diagnosis, often acute cholecystitis.
Contribution
The study identifies risk factors and outcomes for patients misdiagnosed with non-specific abdominal pain in Saudi Arabia, a gap in existing literature.
Findings
7.4% of patients discharged with NSAP revisited the ED within three days with a different diagnosis.
Acute cholecystitis was the most common new diagnosis during second ED visits.
Revisited patients were younger, had higher BMI, and more surgical history compared to non-revisited patients.
Abstract
Background It is well documented in the literature that the most common diagnosis for acute abdomen is nonspecific abdominal pain (NSAP). The context of NSAP in the literature is either (a) ranking it among other causes of acute abdomen or (b) addressing that some patients revisited the ED with a different diagnosis after being initially labeled with NSAP. These two contexts create a gap, as no article has discussed the characteristics of patients mislabeled with NSAP in KSA. In other words, what might be the risk factors making their presentation nonspecific? In this article, we discuss the characteristics of patients labeled with NSAP who revisited the ED within three days and were subsequently diagnosed with a different condition, if found. Methodology The study was a retrospective cohort study. Data were taken from case files at King Abdulaziz Medical City (KAMC), a tertiary…
Genes, proteins, chemicals, diseases, species, mutations and cell lines named across the full text — each resolved to its canonical identifier and authoritative record.
Click any figure to enlarge with its caption.
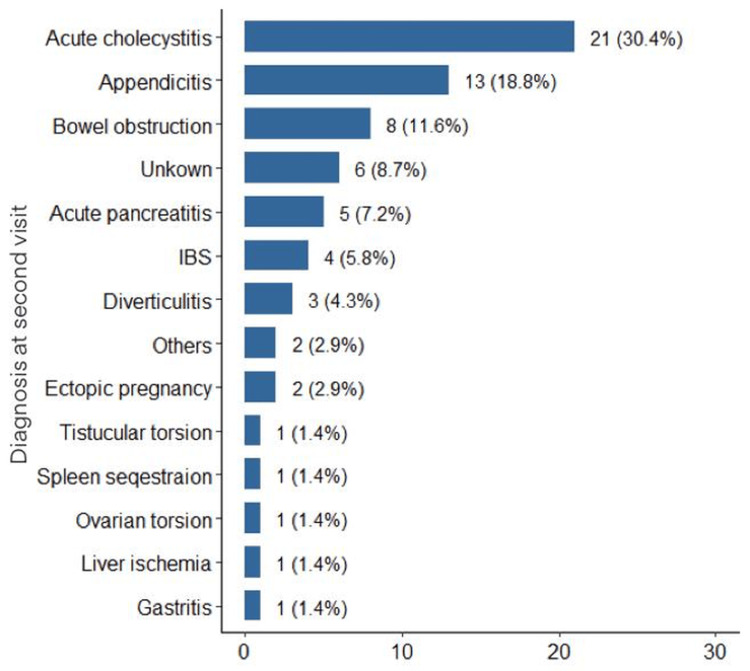 Figure 1
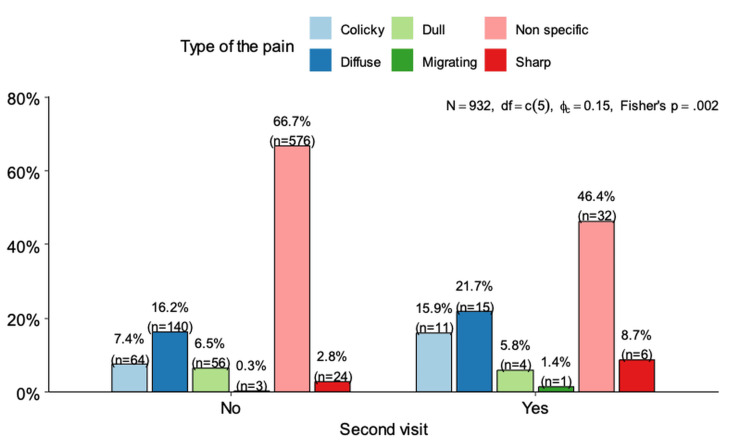 Figure 2
| Parameter | All (N=932) | No Re-visit (N=863) | Re-visit (N=69) | p-value |
| Age | 39.0 (26.0; 56.0) | 40.0 (27.0; 58.0) | 29.0 (21.0; 42.0) | <0.001 |
| Gender | ||||
| Female | 416 (44.6%) | 384 (44.5%) | 32 (46.4%) | |
| Male | 516 (55.4%) | 479 (55.5%) | 37 (53.6%) | |
| BMI | ||||
| < 25 | 581 (62.3%) | 553 (64.1%) | 28 (40.6%) | <0.001 |
| ≥ 25 | 351 (37.7%) | 310 (35.9%) | 41 (59.4%) | |
| Blood type | ||||
| A+ | 41 (4.40%) | 38 (4.40%) | 3 (4.35%) | 0.267 |
| AB- | 2 (0.21%) | 2 (0.23%) | 0 (0.00%) | |
| AB+ | 6 (0.64%) | 5 (0.58%) | 1 (1.45%) | |
| B- | 9 (0.97%) | 8 (0.93%) | 1 (1.45%) | |
| B+ | 37 (3.97%) | 33 (3.82%) | 4 (5.80%) | |
| O- | 16 (1.72%) | 13 (1.51%) | 3 (4.35%) | |
| O+ | 821 (88.1%) | 764 (88.5%) | 57 (82.6%) | |
| Initial heart rate | ||||
| < 60 | 37 (3.97%) | 34 (3.94%) | 3 (4.35%) | 0.142 |
| 60-100 | 387 (41.5%) | 351 (40.7%) | 36 (52.2%) | |
| > 100 | 508 (54.5%) | 478 (55.4%) | 30 (43.5%) | |
| Frequency of ED visits per year | 2.00 (2.00; 4.00) | 2.00 (2.00; 3.00) | 4.00 (3.00; 4.00) | <0.001 |
| Temperature | ||||
| Hyperpyrexia | 3 (0.32%) | 3 (0.35%) | 0 (0.00%) | 0.185 |
| Hypothermia | 3 (0.32%) | 3 (0.35%) | 0 (0.00%) | |
| > 37.5 °C | 205 (22.0%) | 183 (21.2%) | 22 (31.9%) | |
| Normal | 721 (77.4%) | 674 (78.1%) | 47 (68.1%) | |
| Initial WBC count | ||||
| Leukocytosis | 105 (11.3%) | 82 (9.50%) | 23 (33.3%) | <0.001 |
| Normal | 827 (88.7%) | 781 (90.5%) | 46 (66.7%) | |
| Radiation of pain | ||||
| Diffuse | 3 (0.32%) | 1 (0.12%) | 2 (2.94%) | 0.005 |
| Fixed | 76 (8.16%) | 70 (8.11%) | 6 (8.82%) | |
| None | 754 (81.0%) | 707 (81.9%) | 47 (69.1%) | |
| To back | 37 (3.97%) | 31 (3.59%) | 6 (8.82%) | |
| To chest | 28 (3.01%) | 26 (3.01%) | 2 (2.94%) | |
| To shoulder | 33 (3.55%) | 28 (3.25%) | 5 (7.35%) | |
| Type of pain | 0.001 | |||
| Colicky | 75 (8.06%) | 64 (7.42%) | 11 (16.4%) | 0.018 |
| Diffuse | 155 (16.7%) | 140 (16.2%) | 15 (22.4%) | 0.257 |
| Dull | 60 (6.45%) | 56 (6.49%) | 4 (5.97%) | 0.999 |
| Migrating | 4 (0.43%) | 3 (0.35%) | 1 (1.49%) | 0.259 |
| Non-specific | 606 (65.2%) | 576 (66.7%) | 30 (44.8%) | <0.001 |
| Sharp | 30 (3.23%) | 24 (2.78%) | 6 (8.96%) | 0.017 |
| Previous surgical history | ||||
| No | 495 (53.1%) | 471 (54.6%) | 24 (34.8%) | <0.001 |
| Abdominal | 184 (19.7%) | 157 (18.2%) | 27 (39.1%) | |
| Non-abdominal | 253 (27.1%) | 235 (27.2%) | 18 (26.1%) | |
| Diagnostic workup (first visit) | ||||
| CT | 297 (31.9%) | 270 (31.3%) | 27 (39.7%) | 0.001 |
| US | 325 (34.9%) | 293 (34.0%) | 32 (47.1%) | |
| X-ray | 309 (33.2%) | 300 (34.8%) | 9 (13.2%) | |
| Disposition of the patient (second visit) | ||||
| Admission | - | - | 56 (81.2%) | |
| Discharged | - | - | 13 (18.8%) | |
| Comorbidity | No re-visit (N=863) | Re-visit (N=69) | p-value |
| Asthma | 42 (4.87%) | 7 (10.4%) | 0.078 |
| Hypothyroidism | 11 (1.27%) | 9 (13.4%) | <0.001 |
| DM2 (Type 2 DM) | 230 (26.7%) | 22 (32.8%) | 0.34 |
| Hypertension (HTN) | 201 (23.3%) | 19 (28.4%) | 0.429 |
| CKD | 9 (1.04%) | 0 (0.00%) | 1 |
| DM1 (Type 1 DM) | 11 (1.27%) | 6 (8.96%) | 0.001 |
| Heart failure | 6 (0.70%) | 0 (0.00%) | 1 |
| Hyperthyroidism | 14 (1.62%) | 1 (1.49%) | 1 |
| Stroke | 10 (1.16%) | 1 (1.49%) | 0.563 |
| Medically free | 449 (52.0%) | 18 (26.9%) | <0.001 |
| Osteoarthritis | 2 (0.23%) | 0 (0.00%) | 1 |
| SCD | 0 (0.00%) | 1 (1.49%) | 0.072 |
| Symptom | No re-visit (N=863) | Re-visit (N=69) | p-value |
| Anorexia | 57 (6.64%) | 1 (1.45%) | 0.117 |
| Ascites | 1 (0.12%) | 0 (0.00%) | 1 |
| Back pain | 39 (4.55%) | 1 (1.45%) | 0.355 |
| Constipation | 69 (8.04%) | 14 (20.3%) | 0.001 |
| Cough | 1 (0.12%) | 0 (0.00%) | 1 |
| Diaphoresis | 0 (0.00%) | 1 (1.45%) | 0.074 |
| Diarrhea | 41 (4.78%) | 4 (5.80%) | 0.571 |
| Dyspnea | 7 (0.82%) | 0 (0.00%) | 1 |
| Dysuria | 24 (2.80%) | 1 (1.45%) | 1 |
| Fatigue | 96 (11.2%) | 3 (4.35%) | 0.117 |
| Fever | 42 (4.90%) | 1 (1.45%) | 0.364 |
| Fever and anorexia | 11 (1.28%) | 3 (4.35%) | 0.079 |
| Fever and constipation | 0 (0.00%) | 2 (2.90%) | 0.005 |
| Fever and diarrhea | 22 (2.56%) | 1 (1.45%) | 1 |
| Fever and nausea | 6 (0.70%) | 0 (0.00%) | 1 |
| Fever and vomiting | 18 (2.10%) | 0 (0.00%) | 0.389 |
| Fever, nausea, vomiting | 56 (6.53%) | 8 (11.6%) | 0.133 |
| Gas and bloating | 56 (6.53%) | 3 (4.35%) | 0.614 |
| Headache | 84 (9.79%) | 3 (4.35%) | 0.202 |
| Nausea | 12 (1.40%) | 2 (2.90%) | 0.28 |
| Nausea and anorexia | 0 (0.00%) | 9 (13.0%) | <0.001 |
| Nausea and vomiting | 64 (7.46%) | 10 (14.5%) | 0.065 |
| None | 123 (14.3%) | 2 (2.90%) | 0.013 |
| Polyuria and fatigue | 7 (0.82%) | 0 (0.00%) | 1 |
| Vomiting | 20 (2.33%) | 0 (0.00%) | 0.391 |
| Weight loss | 2 (0.23%) | 0 (0.00%) | 1 |
| Symptom | No (N=863) | Yes (N=69) | p-value |
| Anorexia | 68 (7.93%) | 13 (18.8%) | 0.004 |
| Ascites | 1 (0.12%) | 0 (0.00%) | 1 |
| Back pain | 39 (4.55%) | 1 (1.45%) | 0.355 |
| Constipation | 69 (8.04%) | 16 (23.2%) | <0.001 |
| Cough | 1 (0.12%) | 0 (0.00%) | 1 |
| Diaphoresis | 0 (0.00%) | 1 (1.45%) | 0.074 |
| Diarrhea | 63 (7.34%) | 5 (7.25%) | 1 |
| Dyspnea | 7 (0.82%) | 0 (0.00%) | 1 |
| Dysuria | 24 (2.80%) | 1 (1.45%) | 1 |
| Fatigue | 103 (12.0%) | 3 (4.35%) | 0.084 |
| Fever | 155 (18.1%) | 15 (21.7%) | 0.551 |
| Nausea | 138 (16.1%) | 29 (42.0%) | <0.001 |
| Vomiting | 158 (18.4%) | 18 (26.1%) | 0.16 |
| Gas and bloating | 56 (6.53%) | 3 (4.35%) | 0.614 |
| Headache | 84 (9.79%) | 3 (4.35%) | 0.202 |
| None | 123 (14.3%) | 2 (2.90%) | 0.013 |
| Polyuria | 7 (0.82%) | 0 (0.00%) | 1 |
| Weight loss | 2 (0.23%) | 0 (0.00%) | 1 |
| Predictor | Odds Ratio (OR) | 95% CI | p-value |
| Intercept | 0.47 | 0.14-1.65 | 0.241 |
| Age | 0.95 | 0.93-0.97 | <0.001 |
| WBC: Normal vs. Leukocytosis | 0.49 | 0.23-1.02 | 0.056 |
| Nausea: Yes vs. No | 3.05 | 1.49-6.23 | 0.002 |
| Constipation: Yes vs. No | 8.24 | 3.61-18.82 | <0.001 |
| Anorexia: Yes vs. No | 6.4 | 2.65-15.48 | <0.001 |
| Previous surgery: No vs. Abdominal | 0.24 | 0.12-0.51 | <0.001 |
| Previous surgery: Non-abdominal vs. Abdominal | 0.5 | 0.23-1.11 | 0.088 |
| Colicky pain: Yes vs. No | 3.54 | 1.46-8.58 | 0.005 |
| Hypothyroidism: Yes vs. No | 3.24 | 0.97-10.75 | 0.055 |
| Diabetes type 1: Yes vs. No | 6.61 | 1.81-24.13 | 0.004 |
| BMI: Overweight vs. Normal | 3.01 | 1.56-5.78 | 0.001 |
Peer Reviews
No public reviews on file for this paper yet. If you reviewed it on a platform where reviews are public (OpenReview, ICLR, NeurIPS, ICML), you can paste yours below so the community can read it here.
Videos
No videos yet. Explain this paper in a talk, walkthrough, or lecture? Add one.
Taxonomy
TopicsAppendicitis Diagnosis and Management · Cardiac, Anesthesia and Surgical Outcomes · Hernia repair and management
Introduction
Acute abdominal pain is defined as “abdominal pain of nontraumatic origin with a maximum duration of 5 days” [1]. It is a common cause for people to seek medical attention in the ED [2]. Causes of acute abdominal pain vary from emergent conditions requiring immediate intervention to less serious causes [3]. Special diagnostic challenges are encountered in some patients, as they exhibit ambiguous and nonspecific symptoms, as well as unusual manifestations, leading to extensive and time-consuming investigations [4,5]. Consequently, even skilled and experienced doctors may find it difficult to diagnose the cause of acute abdominal pain [6]. Thus, in many cases, the etiology of acute abdominal pain cannot be determined, and patients may be diagnosed with nonspecific abdominal pain (NSAP) and discharged from the ED.
Acute NSAP is defined as “acute abdominal pain less than one week in duration, for which there is no diagnosis despite investigations and which comprises a spectrum of undiagnosed conditions, both somatic and functional,” and remains a diagnosis of exclusion [7]. Despite the availability of advanced diagnostic techniques, a significant proportion of patients (around 25% in ED discharges and 35-41% in admissions) are diagnosed with NSAP [8-10]. This may delay the diagnosis of a specific condition rather than NSAP itself. Therefore, evaluation of abdominal symptoms is difficult and highly challenging [11,12]. Considering the outcomes of delayed diagnosis and the risk of readmission with other conditions, it has been reported that the longer it takes for patients to receive a diagnosis and treatment, the greater the likelihood of negative outcomes such as death, morbidity, and psychological illness [13,14].
The primary objective of this study was to determine the 72-hour revisit rate among adult patients discharged with a diagnosis of NSAP at a tertiary hospital in Saudi Arabia. Secondary objectives were to (1) identify patient characteristics and risk factors associated with revisit and (2) describe the diagnoses made on second visits.
To our knowledge, there is no literature discussing the rate of NSAP in Riyadh, Saudi Arabia, and little literature worldwide addressing ED revisits after a diagnosis of NSAP. This study, therefore, aims to provide a valuable contribution to the Saudi medical literature.
Materials and methods
This study was designed as a retrospective cohort chart review conducted at King Abdulaziz Medical City (KAMC), Riyadh, Saudi Arabia, a tertiary care level-1 trauma center. The study period spanned from January 2015 to December 2023.
Inclusion and exclusion criteria
We included all adult patients aged 18 years and above who presented to the ED and were discharged with a diagnosis of NSAP, coded under the International Classification of Diseases (ICD-10) code R10.4.
Exclusion criteria were patients younger than 18 years, patients with trauma-related abdominal pain, pregnant women, those with incomplete or missing medical records, and patients who received a confirmed diagnosis other than NSAP during the index visit.
Outcome definition
A revisit was defined as a return presentation to the same ED within 72 hours of discharge. A “different diagnosis” was defined as a diagnosis at the second visit that differed from the initial NSAP (ICD-10 R10.4) discharge code. Diagnoses were determined through manual chart review of the electronic medical records and adjudicated by emergency physicians. Revisits to other hospitals were not captured, which may underestimate the true revisit rate.
Data collection
Data were extracted from the hospital’s electronic medical record system (Best-Care) by trained medical data abstractors using a standardized Excel form. To ensure accuracy, a random 10% sample was cross-checked by senior clinicians. Any discrepancies were resolved by consensus. Variables collected included demographic information (age, sex, BMI, blood type), vital signs (temperature, heart rate), laboratory parameters (WBC count), clinical characteristics (pain type, pain radiation, associated symptoms), surgical history, imaging performed during the index visit, comorbidities, and subsequent diagnoses at the revisit.
Handling of missing data
We recorded the percentage of missing values for key variables. Missing data were managed using complete-case analysis without imputation.
Symptom coding
Symptoms were categorized based on clinical documentation in the EMR. Composite symptom categories (e.g., “nausea and anorexia”) were created when both symptoms were recorded concurrently. Recoding rules were predefined and applied consistently across the dataset.
Statistical analysis
All analyses were performed using R software (version 4.3). Categorical variables were summarized as counts and percentages, while continuous variables were expressed as mean ± SD for normally distributed data or as median with IQR for non-normal data. Associations between categorical variables were tested using the chi-square test. Logistic regression analysis was conducted to identify factors associated with ED revisits, with a backward elimination approach used for variable selection. Model performance was assessed using the AUC and calibration plots. Given the limited number of events (n = 69 revisits), the possibility of model overfitting was acknowledged. A two-tailed p-value < 0.05 was considered statistically significant.
Results
The study encompassed a cohort of 932 patients, with 69 (7.4%) re-visiting the ER within three days. Analysis revealed significant differences in age distribution between the two groups, with a median age of 40 years (IQR: 27-58) in the non-revisited group compared to a younger median age of 29 years (IQR: 21-42) in re-visited patients (p < 0.001). Gender distribution did not significantly differ between the groups (p = 0.860). BMI categories indicated significant differences; two-thirds of patients who were not re-visited had a BMI of less than 25 (64.1%), compared to 40.6% of those who were re-visited (p < 0.001). Blood type distributions did not significantly correlate with re-visit (p = 0.267) (Table 1).
The initial heart rate was not significantly different between groups (p = 0.142). The frequency of ED visits per year was significantly higher in re-visited patients (median = 4 visits, IQR: 3-4), compared to a median of 2 visits (IQR: 2-3) in those who were not re-visited (p < 0.001). The prevalence of leukocytosis was higher in re-visited patients compared to those who were not re-visited (33.3% vs. 9.5%, p < 0.001). The distribution of pain types was significantly different between groups (p = 0.001). Temperature was not significantly different between groups.
Surgical history was significantly different between groups, with 39.1% of re-visited patients having a history of abdominal surgery compared to 18.2% of non-revisited patients (p < 0.001). Diagnostic procedures during the first visit, such as CT and US, were more common in re-visited patients (p = 0.001).
The most frequent diagnosis during the second visit was acute cholecystitis, accounting for 30.4% (n = 21) of the total re-visits, followed by appendicitis, which comprised 18.8% (n = 13) of the cases. Bowel obstruction was the third most common condition leading to re-visit, representing 11.6% (n = 8). The diagnosis was unknown in 8.7% of the re-visited cases. The remaining cases included a variety of conditions such as acute pancreatitis, other surgical pathologies, and gastrointestinal issues, each constituting a smaller fraction of the total re-visits (Figure 1).
Diagnosis at second visit.IBS: Irritable Bowel Syndrome.
Figure 2 illustrates the relationship between the type of pain patients reported and their subsequent hospital re-visit. Those who were not re-visited predominantly reported non-specific pain, constituting 66.7% (n = 576). Other pain descriptions in the non-revisited cohort included colicky pain (15.9%, n = 140), dull pain (7.4%, n = 64), diffuse pain (6.5%, n = 56), sharp pain (2.8%, n = 24), and migrating pain (0.3%, n = 3). Among the re-visited patients, non-specific pain was still common at 46.4% (n = 30), but there was a noticeably higher incidence of colicky pain at 15.9% (n = 11), suggesting a stronger association with re-visit. Diffuse pain was reported by 21.7% (n = 15) and dull pain by 5.8% (n = 4) in the re-visited group (Figure 2). The distribution of comorbidities between re-visited and non-revisited patients is summarized in Table 2.
Association between type of pain and re-visit.
The prevalence of asthma and hypothyroidism was higher in the re-visited group, with asthma present in 10.4% compared to 4.87% in the non-revisited group (p = 0.078), suggesting a trend towards significance. Hypothyroidism was significantly more common among re-visited patients, affecting 13.4% compared to only 1.27% of those not re-visited (p < 0.001). Diabetes mellitus type 2 (DM2) was observed in 26.7% of the non-revisited group and 32.8% of the re-visited group (p = 0.340). Hypertension (HTN) was present in 23.3% of the non-revisited group and 28.4% of the re-visited group (p = 0.429). Chronic kidney disease (CKD), heart failure, hyperthyroidism, stroke, and osteoarthritis were present in a small percentage of both groups, with no significant differences observed. The absence of comorbidities was significantly more common in the non-revisited group, at 52% compared to only 26.9% in the re-visited group (p < 0.001) (Table 3).
Significant differences were observed in constipation and in the combined symptoms of nausea and anorexia. Specifically, constipation was significantly more prevalent in the re-visited group, with 20.3% of patients experiencing this symptom compared to 8.04% in the non-revisited group (p = 0.001). Furthermore, the co-occurrence of nausea and anorexia was notably higher in the re-visited group, with 13.0% reporting these symptoms versus none in the non-revisited group, highlighting a significant association with re-visit (p < 0.001). Additionally, the presence of fever combined with constipation was statistically significant in the re-visited group, with 2.90% experiencing these symptoms (p = 0.005). Lastly, there was a significant decrease in patients reporting no symptoms in the re-visited group (2.90%) compared to the non-revisited group (14.3%, p = 0.013), suggesting that the absence of symptoms is less likely in those who re-visited (Table 4).
With each additional year of age, the odds of re-visit decreased (OR = 0.95, 95% CI: 0.93-0.97, p < 0.001). Normal levels of WBC compared to leukocytosis were associated with about half the odds of re-visit, although this was marginally significant (OR = 0.49, 95% CI: 0.23-1.02, p = 0.056). The presence of nausea at presentation increased the odds of re-visit more than threefold (OR = 3.05, 95% CI: 1.49-6.23, p = 0.002). Patients with constipation had more than eight times the odds of re-visit (OR = 8.24, 95% CI: 3.61-18.82, p < 0.001). The presence of anorexia was also associated with a sixfold increase in the odds of re-visit (OR = 6.40, 95% CI: 2.65-15.48, p < 0.001). Those with no history of abdominal surgery had lower odds of re-visit compared to those with such a history (OR = 0.24, 95% CI: 0.12-0.51, p < 0.001), while previous non-abdominal surgery was not associated with re-visit (OR = 0.50, 95% CI: 0.23-1.11, p = 0.088).
Experiencing colicky pain increased the odds of re-visit (OR = 3.54, 95% CI: 1.46-8.58, p = 0.005). Hypothyroidism was also associated with higher odds of re-visit (OR = 3.24, 95% CI: 0.97-10.75, p = 0.055). Individuals with type 2 diabetes had significantly higher odds of re-visit (OR = 6.61, 95% CI: 1.81-24.13, p = 0.004). Overweight individuals had three times the odds of re-visit compared to those with a normal BMI (OR = 3.01, 95% CI: 1.56-5.78, p = 0.001). The model’s R² value of 0.362 indicated that these predictors explained approximately 36.2% of the variability in re-visit (Table 5).
Discussion
This study evaluated revisit patterns among patients discharged from the ED with NSAP. We found that approximately 7% of patients returned within 72 hours, most commonly with acute cholecystitis and appendicitis. These findings highlight the clinical relevance of NSAP, a common yet diagnostically challenging presentation, and underscore the importance of appropriate discharge planning and follow-up.
Revisit rate and diagnoses
The 7% revisit rate observed in our study is comparable to international reports. Studies from the United States and Europe have documented revisit rates between 5% and 10% among NSAP patients [2,8-10]. Similar results have been reported in Asian cohorts, where appendicitis and biliary disease were among the leading causes of return visits [14]. Abdominal pain presentations also vary significantly between younger and older populations, as highlighted in previous studies of elderly patients [15,16]. The most frequent second-visit diagnoses in our cohort, appendicitis and cholecystitis, were consistent with international literature [17-19]. These consistencies suggest that the diagnostic uncertainty of NSAP is a global challenge rather than one limited to our setting.
Risk factors for revisit
Several factors were associated with higher revisit risk. Younger age emerged as a significant factor in our study, echoing findings that abdominal pain presentations differ between younger and older patients [4,5]. While older patients are often evaluated more extensively due to comorbidities, younger patients may be discharged earlier, potentially contributing to higher revisit rates.
Comorbidities also influenced outcomes. Type 1 diabetes was significantly associated with revisits, while Type 2 diabetes was not. Prior studies have shown that diabetes can complicate abdominal pain presentations due to atypical symptoms, making diagnosis more challenging [13]. Hypothyroidism, while significant in univariate analysis, was only borderline in regression and should be interpreted cautiously.
Other predictors included higher BMI, prior abdominal surgery, leukocytosis, and GI symptoms such as nausea, constipation, and anorexia. These associations are biologically plausible and align with previous studies highlighting the importance of systemic and gastrointestinal factors in missed diagnoses [6,7].
Clinical implications
Our findings, in line with international literature, suggest that certain subgroups of NSAP patients may require closer monitoring, additional diagnostic testing, or enhanced discharge instructions. In particular, younger patients, those with type 1 diabetes, and those presenting with gastrointestinal symptoms represent higher-risk groups. These implications are hypothesis-generating and warrant further investigation in prospective multicenter studies.
Limitations
This study has several important limitations that should be considered when interpreting the findings. First, it was conducted at a single tertiary care center, which may limit the generalizability of results to other settings with different patient populations, healthcare systems, or diagnostic resources. Second, only revisits to the same hospital were captured; patients who sought care at other facilities were not included. This may have led to an underestimation of the true revisit rate.
Third, the definition of a “different diagnosis” relied on electronic medical record documentation and coding, which introduces the potential for misclassification. Although manual chart review and physician adjudication were performed, diagnostic variability and coding errors cannot be completely excluded.
Fourth, data abstraction was retrospective and subject to limitations of the available records. Missing data were handled using complete-case analysis, which may introduce bias if missingness was not random. The proportion of missing values was not negligible for certain variables, and this should be taken into account when interpreting results.
Fifth, symptom recoding into composite categories (e.g., combining nausea and anorexia) may have introduced collinearity and reduced reproducibility. Although these categories were predefined, they remain subjective and could affect associations.
Sixth, the number of patients with revisits (n = 69) was relatively small compared with the number of variables considered in the regression model. This imbalance increases the risk of overfitting, despite the use of backward elimination, and limits the strength of inferences. Model performance metrics such as discrimination and calibration were included, but the small event count remains an inherent constraint.
Finally, the follow-up period was limited to 72 hours. While this window is clinically relevant for early return visits, it may not capture clinically significant revisits occurring after three days. Longer follow-up intervals, such as 5-7 days, may provide additional insights into delayed presentations of surgical abdominal pathology.
Conclusions
In this retrospective single-center study, approximately 7% of patients discharged with NSAP revisited the ED within 72 hours, most commonly with acute cholecystitis or appendicitis. Younger age, type 1 diabetes, higher body mass index, prior abdominal surgery, leukocytosis, and GI symptoms such as nausea, constipation, and anorexia were associated with a higher risk of revisit. These findings highlight the importance of careful discharge planning and clear return precautions, particularly for patients in these higher-risk groups.
Our results are consistent with international studies reporting similar revisit rates and diagnostic patterns, underscoring that NSAP remains a global diagnostic challenge. While this study provides valuable region-specific data, its retrospective, single-center design and limited follow-up period necessitate cautious interpretation. Future multicenter, prospective studies with larger cohorts and extended follow-up are needed to validate these associations, enhance reproducibility, and guide evidence-based strategies for the management and safe discharge of NSAP patients.
The reference list from the paper itself. Each links out to its DOI / PubMed record.
- 1Guideline for the diagnostic pathway in patients with acute abdominal pain Dig Surg Gans SL Pols MA Stoker J Boermeester MA 23313220152565926510.1159/000371583 · doi ↗ · pubmed ↗
- 2Characteristics and trends of emergency department visits in the United States (2010-2014)J Emerg Med Hooker EA Mallow PJ Oglesby MM 3443515620193070482210.1016/j.jemermed.2018.12.025 · doi ↗ · pubmed ↗
- 3Acute Abdomen Kopitnik NL Kashyap S Dominique E Treasure Island, FL Stat Pearls Publishing 2025 https://www.ncbi.nlm.nih.gov/books/NBK 459328/29083722 · pubmed ↗
- 4Intraabdominal infection: differences in presentation and outcome between younger patients and the elderly Clin Infect Dis Cooper GS Shlaes DM Salata RA 146148191994 http://10.1093/clinids/19.1.146794851710.1093/clinids/19.1.146 · doi ↗ · pubmed ↗
- 5The use of abdominal computed tomography in older ED patients with acute abdominal pain Am J Emerg Med Hustey FM Meldon SW Banet GA Gerson LW Blanda M Lewis LM 2592652320051591539510.1016/j.ajem.2005.02.021 · doi ↗ · pubmed ↗
- 6Diagnostic accuracy of surgeons and trainees in assessment of patients with acute abdominal pain Br J Surg Acute Abdominal Pain (AAP) Study Group 1343134910320162746540910.1002/bjs.10232 · doi ↗ · pubmed ↗
- 7Nonspecific abdominal pain Emergency Laparoscopy Carlucci M Beneduce AA Fiorentini G Burtulo G 7378 Cham Springer 2016
- 8Abdominal pain in the ED: stability and change over 20 years Am J Emerg Med Powers RD Guertler AT 301303131995775582210.1016/0735-6757(95)90204-X · doi ↗ · pubmed ↗