Time to Total Hip Arthroplasty Among Patients in the US Military Health System
Brandon L. Hillery, Ashton H. Goldman, Alexander G. Velosky, Maxwell Y. Amoako, Jeffrey C. Leggit, Krista B. Highland

TL;DR
This study examines how long it takes for patients in the US Military Health System to receive hip replacement surgery after being diagnosed with hip osteoarthritis, finding differences based on patient, care, and structural factors.
Contribution
The study identifies multilevel factors influencing time to total hip arthroplasty in the US Military Health System, offering insights for policy improvements.
Findings
Patients with more orthopedic surgeon visits and imaging were more likely to receive hip replacement surgery.
Racial and ethnic minorities had lower rates of hip replacement surgery compared to White patients.
Retired service members and their families were more likely to undergo surgery than active-duty members.
Abstract
How does time to total hip arthroplasty (THA) after hip osteoarthritis diagnosis vary across patient-, care-, and structural-level factors in the US Military Health System? In this cohort study including 37 239 patients, time-to-THA varied across patient (eg, age, race and ethnicity, sex, beneficiary category), care (eg, imaging, orthopedic surgeon visits, injections, therapeutic visits), and structural (eg, health care system, year) factors. These results highlight variation in THA timing across military and civilian health care systems; future data-driven policy and programming may optimize timely care. This cohort study assesses variations in time to total hip arthroplasty after hip osteoarthritis diagnosis among patients in the US Military Health System. Total hip arthroplasty (THA) delays can be deleterious. Robust evaluation of time to THA enables data-driven improvement…
Genes, proteins, chemicals, diseases, species, mutations and cell lines named across the full text — each resolved to its canonical identifier and authoritative record.
Click any figure to enlarge with its caption.
 Figure
| Characteristic | Patients, No. (%) | |||
|---|---|---|---|---|
| Overall (N = 37 239) | Received THA | |||
| No (n = 26 737) | Yes (n = 10 502) | |||
| Age, median (IQR), y | 59 (50-64) | 58 (48-64) | 60 (54-65) | <.001 |
| Race and ethnicity | ||||
| American Indian and Alaska Native | 320 (1) | 248 (1) | 72 (1) | <.001 |
| Asian and Pacific Islander | 1603 (4) | 1276 (5) | 327 (3) | |
| Black | 8123 (22) | 6296 (24) | 1827 (17) | |
| Hispanic | 2041 (5) | 1603 (6) | 438 (4) | |
| White | 23 327 (63) | 15 921 (60) | 7406 (71) | |
| Another race and ethnicity | 1825 (5) | 1393 (5) | 432 (4) | |
| Beneficiary group | ||||
| Active-duty service member | 5730 (15) | 4843 (18) | 887 (8) | <.001 |
| Family member | 13 229 (36) | 9703 (36) | 3526 (34) | |
| Retired service member | 18 280 (49) | 12191 (46) | 6089 (58) | |
| Sex | ||||
| Female | 15 686 (42) | 11 717 (44) | 3969 (38) | <.001 |
| Male | 21 553 (58) | 15 020 (56) | 6533 (62) | |
| Age-adjusted CCI category | ||||
| 0 | 7227 (19) | 5985 (22) | 1242 (12) | <.001 |
| 1 | 8151 (22) | 5595 (21) | 2556 (24) | |
| ≥2 | 21 861 (59) | 15 157 (57) | 6704 (64) | |
| Diagnosis 1 y before index date | ||||
| Psychiatric diagnosis | 9957 (27) | 7776 (29) | 2181 (21) | <.001 |
| Pain-related diagnosis | 31 285 (84) | 23 076 (86) | 8209 (78) | <.001 |
| Obesity | 8575 (23) | 6189 (23) | 2386 (23) | .39 |
| Nicotine dependence or documented tobacco use | 4277 (11) | 3189 (12) | 1088 (10) | <.001 |
| Index diagnosis system | ||||
| Direct | 13 120 (35) | 9000 (34) | 4120 (39) | <.001 |
| Purchased | 24 119 (65) | 17 737 (66) | 6382 (61) | |
| Index year, median (IQR) | 2021 (2019-2022) | 2021 (2019-2022) | 2021 (2019-2022) | <.001 |
| Care received 3 y before index date | ||||
| Hip injections | ||||
| 0 | 31 683 (85) | 22 609 (85) | 9074 (86) | <.001 |
| 1 | 2599 (7) | 1925 (7) | 674 (6) | |
| ≥2 | 2957 (8) | 2203 (8) | 754 (7) | |
| Hip imaging | ||||
| 0 | 28 085 (75) | 20 170 (75) | 7915 (75) | .01 |
| 1 | 6092 (16) | 4310 (16) | 1782 (17) | |
| ≥2 | 3062 (8) | 2257 (8) | 805 (8) | |
| Geographic region | ||||
| East South Central | 2601 (7) | 1885 (7) | 716 (7) | <.001 |
| Midwest | 2873 (8) | 1998 (7) | 875 (8) | |
| Mountain | 3489 (9) | 2323 (9) | 1166 (11) | |
| Northeast | 1196 (3) | 878 (3) | 318 (3) | |
| Pacific | 4830 (13) | 3302 (12) | 1528 (15) | |
| South Atlantic | 15 059 (40) | 10 779 (40) | 4280 (41) | |
| US territory, another country, unknown | 947 (3) | 819 (3) | 128 (1) | |
| West South Central | 6244 (17) | 4753 (18) | 1491 (14) | |
| Factor | IRR (95% CI) | TV | |
|---|---|---|---|
| Race and ethnicity | |||
| American Indian and Alaska Native | 0.87 (0.66-1.14) | .30 | .76 |
| Asian and Pacific Islander | 0.76 (0.66-0.88) | <.001 | .63 |
| Black | 0.79 (0.74-0.85) | <.001 | .002 |
| Hispanic | 0.84 (0.73-0.96) | .01 | .11 |
| White | 1 [Reference] | NA | .45 |
| Another Race and ethnicity | 0.88 (0.77-1.00) | .06 | .85 |
| Beneficiary category | |||
| Active-duty service member | 1 [Reference] | NA | NA |
| Retired service member | 1.39 (1.24-1.56) | <.001 | >.99 |
| Family member | 1.48 (1.30-1.69) | <.001 | .24 |
| Sex | |||
| Female | 1 [Reference] | NA | NA |
| Male | 1.20 (1.11-1.31) | <.001 | .98 |
| Age | Smooth | <.001 | .03 |
| Diagnosis 1 y prior to index date | |||
| Psychiatric diagnosis | 0.79 (0.76-0.83) | <.001 | NA |
| Pain-related diagnosis | 0.69 (0.66-0.72) | <.001 | NA |
| Obesity | 0.92 (0.88-0.96) | <.001 | NA |
| Nicotine dependence diagnosis or tobacco use | 0.97 (0.91-1.04) | .36 | NA |
| CCI category | |||
| 0 | 1 [Reference] | NA | .43 |
| 1 | 1.03 (0.91-1.17) | .61 | .68 |
| ≥2 | 0.85 (0.74-0.97) | .02 | >.99 |
| Index System | |||
| Direct care | 1 [Reference] | NA | .002 |
| Purchased care | 0.38 (0.36-0.40) | <.001 | <.001 |
| Index diagnosis year | 0.97 (0.95-0.99) | .001 | .01 |
| Preindex date injections | |||
| 0 | 1 [Reference] | NA | NA |
| 1 | 0.83 (0.77-0.90) | <.001 | NA |
| ≥2 | 0.75 (0.70-0.81) | <.001 | NA |
| Preindex date imaging | |||
| 0 | 1 [Reference] | NA | .99 |
| 1 | 0.93 (0.87-1.01) | .07 | .10 |
| ≥2 | 0.77 (0.69-0.86) | <.001 | <.001 |
| Orthopedic surgeon visits | 1.67 (1.64-1.69) | <.001 | <.001 |
| Opioid prescriptions | 1.02 (1.01-1.03) | .002 | <.001 |
| Therapeutic visits | Smooth | <.001 | <.001 |
| Imaging | 1.26 (1.24-1.28) | <.001 | .07 |
| Geographic region | |||
| East South Central | 0.90 (0.81-1.00) | .05 | .01 |
| Midwest | 1.35 (1.22-1.49) | <.001 | .01 |
| Mountain | 1.34 (1.22-1.46) | <.001 | .01 |
| Northeast | 0.96 (0.83-1.12) | .60 | .01 |
| Pacific | 1.30 (1.20-1.40) | <.001 | .02 |
| South Atlantic | 1 [Reference] | NA | NA |
| US Territory, another country, unknown | 0.64 (0.52-0.78) | <.001 | <.001 |
| West South Central | 0.96 (0.89-1.04) | .28 | .02 |
| Time, wk | Smooth | <.001 | NA |
Peer Reviews
No public reviews on file for this paper yet. If you reviewed it on a platform where reviews are public (OpenReview, ICLR, NeurIPS, ICML), you can paste yours below so the community can read it here.
Videos
No videos yet. Explain this paper in a talk, walkthrough, or lecture? Add one.
Taxonomy
TopicsTotal Knee Arthroplasty Outcomes · Osteoarthritis Treatment and Mechanisms · Orthopaedic implants and arthroplasty
Introduction
Delays in total joint arthroplasty are associated with decreased quality of life and may confer worse postarthroplasty outcomes.^1^ While the projected demand for total hip arthroplasty (THA) is estimated to increase over the next decades,^2,3^ access is tempered by variation in orthopedic surgeon location and training programs.^4,5^ To date, research has identified several patient- and structural-level factors associated with THA receipt across multi-institutional studies, national samples, and Military Health System (MHS), Veterans Health Administration, and Medicare and Medicaid beneficiaries.^6,7,8,9,10,11,12,13^ However, there is a lack of literature that accounts for nonsurgical guideline-congruent and guideline-incongruent care after osteoarthritis diagnosis (eg, opioid prescriptions, imaging, therapeutic interventions)^14,15,16,17,18,19^ and uses time-to-event models to account for longitudinal nuances in hip osteoarthritis care.
Given delayed and inadequate osteoarthritis treatment can negatively impact quality of life and incur financial burden,^20^ evaluating THA timing within the context of osteoarthritis-related care enables targeted intervention across large health care systems. In the MHS, patients receiving THA tend to be younger and male relative to national databases.^21^ Moreover, unlike private health care settings, surgeons in military treatment facilities do not contend with payers or receive increased reimbursement based on productivity. Patients enrolled in TRICARE insurance (eg, active duty and retired service members and their eligible family members) do not incur large out-of-pocket costs when receiving a THA within military treatment facilities (eg, direct care system) but may pay more in the civilian network (eg, purchased care system). Therefore, evaluating THA timing in MHS beneficiaries enables evaluation of the context of direct and purchased care systems.
The objective of this study was to evaluate time to THA after hip osteoarthritis diagnosis in patients enrolled in insurance plans in which some or all health care is provided at military treatment facilities, when such services are available at the local facility (eg, TRICARE Prime, TRICARE Plus, direct care only). These plans are like health maintenance organization plans in which patients must receive specialty care referrals (eg, orthopedic surgery, imaging) from their primary care managers. Other plans that are outside of the scope of this study, such as TRICARE Select, are akin to preferred provider organizations and incur higher out-of-pocket costs. It was hypothesized that variation in time to THA would be associated with patient-, care-, and structural-level factors, which would be maintained in sensitivity models evaluating patients receiving care in only the direct vs purchased care systems, separately. Given prior research, it was specifically hypothesized that THA receipt would be less likely in American Indian and Alaska Native, Asian and Pacific Islander, Black, and Hispanic patients and patients with another race and ethnicity compared with White patients; female patients compared with male patients; older patients compared with younger patients; and patients with fewer imaging, orthopedic surgeon, and therapeutic visits compared with those with more visits.
Methods
Study Design, Data Sources, and Record Selection
This retrospective cohort study was determined to be exempt from review and informed consent by the Uniformed Services University institutional review board because this study leveraged secondary research for which consent is not required, per the Revised Common Rule, 45 CFR 46.104(d)(4). This study followed the Strengthening the Reporting of Observational Studies in Epidemiology (STROBE) reporting guideline. Medical record data (eg, encounter records, prescriptions) were extracted from the MHS Information Platform. Records were included of adult patients ages 18 to 89 years, who received an *International Statistical Classification of Diseases and Related Health Problems, Tenth Revision *(ICD-10) M16 diagnosis for hip osteoarthritis (primary, posttraumatic, and unspecified osteoarthritis) between March 1, 2018, and June 30, 2023 (ie, index diagnosis), without prior documented diagnosis from March 1, 2015, to March 29, 2018, to ensure this diagnosis was the first within a 3-year period. There was no requirement that the hip osteoarthritis diagnosis be the primary diagnosis for the encounter.
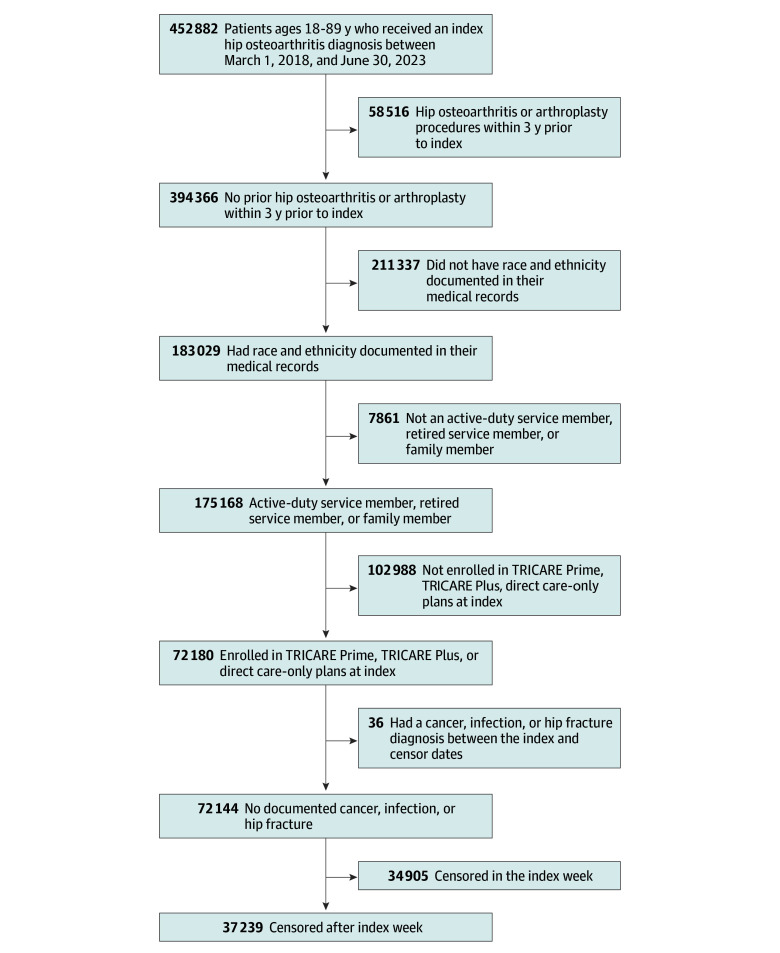
Patients were excluded if they had an M16 diagnosis within 3 years prior to the index hip osteoarthritis diagnosis (including *International Classification of Diseases, Ninth Revision *[ICD-9] and ICD-10 diagnosis codes) or THA; did not have race and ethnicity documented in their medical records; were not an active-duty service member, retired service member (eg, served ≥20 years before separation), or family member; were not enrolled in TRICARE Prime, TRICARE Plus, or direct care only plans at index; had a diagnosis corresponding to cancer, infection, or hip fracture between index and censor dates; or lacked documented hip osteoarthritis diagnoses after the week of index diagnosis, as time-to-event analyses required censoring or the terminal event (THA receipt) to occur after the index (ie, week 0) and data were aggregated on the week-level. Therefore, all patients had at least 1 follow-up visit in which hip osteoarthritis was documented at least 1 week and up to 3 years after index. After identifying the index diagnosis, direct and purchased care records up to 3 years before and 3 years after the index diagnosis were extracted up until June 21, 2024. As such, some patients did not have 3 years of postindex records. The Figure provides a flowchart of included and excluded records.
Flowchart of Patient Selection and Inclusion
Primary Outcome
The primary outcome was time-to-THA receipt within 3 years after the index diagnosis. Receipt of THA was indicated by Current Procedural Terminology code 27130 or ICD-10 Procedure Coding System codes 0SR9*, 0SRA*, 0SRB*, 0SRE*, 0SRR*, or 0SRS*.
Model Covariates
Covariates included patient-, care-, and structural-level factors. Patient-level information included self-reported race and ethnicity recorded in the administrative records (American Indian and Alaska Native, Asian and Pacific Islander, Black, Hispanic, White, and another race and ethnicity [eg, >1 race and ethnicity]), sex (male or female), age, and beneficiary group (active-duty service member, retired service member, family member). Age was retained as a continuous variable in the models and categorized for descriptive purposes into 3 age groups: younger than 55 years, 55 to 69 years, and 70 years or older. Patient-level diagnosis covariates included those documented within 1 year before the index diagnosis. Diagnosis covariate flags (yes or no) included psychiatric diagnoses, pain-related diagnoses per prior literature,^22^ and obesity diagnoses per prior literature.^23^ An age-adjusted Charlson Comorbidity Index score^24^ was categorized as 0, 1, or 2 or greater. Tobacco use (yes or no) was defined as nicotine dependence diagnosis or self-reported and clinician-documented tobacco use. Care-related covariates included hip injections and hip imaging visits before index diagnosis using procedure codes described in prior studies^25^ (eAppendix in Supplement 1). Due to data skewness, 3-year preindex cumulative hip injections and hip imaging receipt were categorized as 0, 1, or 2 or more visits, each. Additional care-related covariates were time-dependent and cumulative, such that values could increase across time and had a maximum value of the 99th percentile due to data skewness. These covariates (99th percentile) included postindex cumulative opioid prescriptions (9 prescriptions) and days in which patients received hip imaging (7 days), orthopedic surgeon visits (6 days), and therapeutic visits (eg, physical therapy, biofeedback injections, other interventional pain therapies; 24 days). Hip injections and opioid prescriptions may have been for other pain-related conditions but could have contributed to hip osteoarthritis management. We used treatment days rather than encounters because some encounters included multiple procedure codes (eg, manual therapy, education, exercise therapy) and clinicians (eg, physical therapist, occupational therapist). At the index week, all postindex cumulative variables were set at 0, then increased by 1 with each care-related event. Lastly, structural-level information included the index care system (direct, purchased), year of index hip osteoarthritis diagnosis, and geographic area of index diagnosis per US Census regions and divisions.^26^ Divisions are a more specific geographic area and were used unless sample size warranted use of the region. Therefore, geographic area categories were Pacific (division), Mountain (division), Midwest (region), Northeast (region), West South Central (division), East South Central (division), South Atlantic (division), and in US Territories, in another country, or in an unknown location (neither a division nor region).
Statistical Analysis
Records were right-censored on the last recorded visit date if no THA occurred and no visits occurred after the 3-year postindex period or at 3 years after index if no THA occurred and visit records continued after 3 years. Nonparametric bivariate analyses (eg, Kruskal-Wallis tests, nonparametric χ^2^ tests) with pairwise tests and Benjamini and Hochberg–adjusted P values compared patients who (1) were excluded due not having race and ethnicity recorded in administrative records, as well as due to censoring in the index week (eg, had no other hip osteoarthritis visits after 1-week after the index diagnosis) vs included in the analysis (eTable 1 in Supplement 1), (2) those who did not and did receive a THA within 3 years after the index diagnosis, and (3) those who received hip osteoarthritis care in the purchased care system only, direct system only, or both systems (eTable 2 in Supplement 1). Bivariate tables were constructed using the compareGroups^27^ package in R software versions 4.4.0 to 4.5.1 (R Project for Statistical Computing). We used the survminer package^28^ in R to create unadjusted survival curves and a censoring table across races and ethnicities (eFigure 1 in Supplement 1).
The primary model was constructed in 2 steps. First, a Cox proportional hazards model (survival model) examined the assumption of proportionality for each covariate using the survival package^29^ in R. The proportionality assumption assumes the hazard ratio is constant across the observation period and all covariate levels. Covariates not meeting the proportionality assumption were modeled as fixed and time-varying covariates (eg, time × covariate interaction) in subsequent models.
The primary model was a piecewise exponential additive model, a generalized additive model (GAM) with a Poisson distribution, estimated using the pammtools^30^ and mgcv^31^ R packages. With GAM, continuous covariates with adequate ranges (eg, age) can be modeled as smooth covariates to model nonlinear associations between covariates and the outcome. Time-varying covariates are modeled as smooth covariates to allow for effects that can change across time (eg, nonproportional hazards). When time-varying covariates are not significant, the corresponding fixed covariates are interpreted alone. If corresponding fixed and time-varying covariates are significant, the fixed covariate indicates the geometric mean baseline hazard and the time-varying covariate is interpreted using visualizations to determine how the hazards change across time.^32^
Three sensitivity models were evaluated. Two GAMs replicated the primary model separately for patients who received hip osteoarthritis care solely in direct vs purchased care systems. A third GAM extended the direct care–only GAM by including a random effect for military treatment facility of index diagnosis. Due to sample size requirements with multilevel models, sites with at least 25 index diagnoses were included.
GAM results are rendered as incidence rate ratios (IRRs) with 95% CIs, which indicate the incidence of THA in a comparator group relative to the incidence in the reference group. For example, if the incidence rate was 10% in a comparison group and 20% in a reference group, the IRR would be 0.5 (10% / 20%). Results of the GAM were tabulated using the sjPlot R package.^33^ Estimated survival probabilities for fixed, smooth, and time-varying covariates were calculated using the pammtools R package^30^ based on the a priori reference categories of nonfocal variables as follows: White race and ethnicity, age 60 years, male, active-duty service member, with an age-adjusted CCI score of 1, no psychiatric or obesity diagnosis prior to the index diagnosis, with a pain-related diagnosis, index direct care system, index year 2020, index diagnosis in the South Atlantic geographic area, 0 hip injections or imaging visits prior to the index diagnosis, 1 imaging visit after diagnosis, 0 opioid prescriptions after diagnosis, and 2 therapeutic visits after diagnosis. These probabilities facilitate inferences regarding relative differences. Changes to a priori categories shift probability estimates. The cumulative hazard differences for significant time-varying smoothed covariates were calculated using the pammtools R package.^30^ Time-varying survival probabilities and cumulative hazard differences were visualized using the ggplot2 R package.^34^ P values were 2-sided, and statistical significance was set at P ≤ .05. Data were analyzed from July 2024 to August 2025.
Results
Sample Description
Overall, 37 239 patients (median [IQR] age 59 [50-64] years; 21 553 [58%] male) met all inclusion and exclusion criteria (Figure and Table 1). The cohort included 320 American Indian and Alaska Native patients (1%), 1603 Asian and Pacific Islander patients (4%), 8123 Black patients (22%), 2041 Hispanic patients (5%), 23 327 White patients (63%), and 1825 patients with another race and ethnicity (5%). Most patients had an index diagnosis for primary hip osteoarthritis (33 659 patients [90%]), followed by unspecified (2383 patients [6%]), hip dysplasia–related (578 patients [2%]), posttraumatic (389 patients [1%]), other (224 patients [1%]), and secondary (92 patients [<1%]) osteoarthritis. More than half of patients (20 821 patients [56%]) received all hip osteoarthritis care (eg, index and follow-up care) in the purchased care system only; 6896 patients (19%) received only direct system care for hip osteoarthritis; the remaining 9522 patients (26%) received hip osteoarthritis care across both systems. The median (IQR) proportion of hip osteoarthritis care provided in the direct care system was 0% (0%-64%) and the mean (SD) was 29% (40%). Of patients who received a THA, 9048 patients (86%) had a THA on the side matching their index diagnosis; 1113 patients (11%) had a THA on the side matching a postindex diagnosis; and 341 patients (3%) had an unspecified THA and/or hip osteoarthritis side or were unmatched in laterality.
Across the 3-year postindex period and without accounting for censoring, 502 patients (28%) received a THA. Proportions were highest among White patients (7406 patients [32%]), followed by patients with another race and ethnicity (432 patients [24%]), and American Indian and Alaska Native (72 patients [23%]), Black (1827 patients [23%]), Hispanic (438 patients [22%]), and Asian and Pacific Islander (327 patients [20%]) patients. Of patients who received a THA, the unadjusted time to THA was lowest for Hispanic patients (median [IQR], 28 [14-59] weeks), followed by White patients (median [IQR], 29 [14-65] weeks), patients with another race and ethnicity (median [IQR], 31 [14-68]), Asian and Pacific Islander patients (median [IQR], 34 [15-69] weeks), Black patients (median [IQR], 36 [16-77] weeks), and American Indian and Alaska Native patients (median [IQR], 44 [15-81]). Proportions were higher and time to THA lower for male (6533 patients [30%]; median [IQR], 29 [14-65] weeks) relative to female (3969 patients [25%]; median [IQR], 32 [15-70] weeks) patients and for retired service members (6089 patients [33%]; median [IQR], 29 [13-62] weeks) and family members (3526 patients [27%]; median [IQR], 33 [15-71] weeks) compared with active-duty service members (887 patients [16%]; median [IQR], 38 [17-78] weeks). Patients younger than 55 years had the lowest proportions of unadjusted THA receipt (13 325 patients [21%]), followed by patients 70 years and older (6098 patients [28%]) and ages 55 to 69 years (17 816 patients [34%]). However, patients 70 years and older had the shortest time to THA (median [IQR], 27 [13-60] weeks) compared with patients ages 55 to 69 years (median [IQR], 30 [14-66] weeks) and younger than 55 years (median [IQR], 34 [15-74] weeks). Patients receiving a hip osteoarthritis diagnosis in the direct care system had both higher proportion of THA receipt (4120 patients [31%]) and longer time to THA (median [IQR], 34 [16-71] weeks) than in the purchased care system (6382 patients [27%]; median [IQR], 28 [13-64] weeks). Lastly, THA receipt was highest and time to THA shortest in the Mountain area (1166 patients [33%]; median [IQR], 27 [13-62] weeks), whereas THA occurred least often and with the longest duration for patients in US territories, in other countries, or in an unknown location (128 patients [14%]; median [IQR], 45 [23-88] weeks). Unadjusted survival curves and censoring frequencies by race and ethnicity, sex, beneficiary group, age group, system of diagnosis, and geographic area are in eFigure 1 in Supplement 1.
Bivariate analysis indicated patients included vs excluded varied across all tested variables (eTable 1 in Supplement 1). All potential covariates, aside from an obesity diagnosis, were significantly different between patients who did not and did receive a THA (Table 1). In the Cox proportional hazards models, several variables across both primary and sensitivity models were not proportional and therefore were included as time-varying covariates.
Primary Model
Time to THA varied across several patient-, care-, and system-level covariates. Asian and Pacific Islander patients (IRR, 0.76; 95% CI, 0.66-0.88; P < .001), Black patients (IRR, 0.79; 95% CI, 0.74-0.85; P < .001), and Hispanic patients (IRR, 0.84; 95% CI, 0.73-0.96; P = .01) had lower incidence of THA compared with White patients across time (Table 2; eFigure 4 in Supplement 1). There was a significant time-varying effect for Black patients, such that cumulative hazard differences steeply decreased within the first year, with less intense decreases afterward. Adjusted probabilities indicated that an estimated 37% (95% CI, 32%-42%) of White patients received a THA by 3 years after the index diagnosis, followed by Hispanic patients (34%; 95% CI, 29%-40%), patients with another race and ethnicity (33%; 95% CI, 28%-39%), American Indian and Alaska Native patients (32%; 95% CI, 24%-42%), Asian and Pacific Islander patients (30%; 95% CI, 25%-36%), and Black patients (28%; 95% CI, 24%-33%). To examine how a priori levels of nonfocal covariates might affect estimates, probabilities were recalculated to change the assumption of direct care index diagnosis to purchased care. Adjusted probabilities maintained the same order, with White patients having the highest estimated probability of THA at 3 years (18%; 95% CI, 16%-21%), followed by Hispanic patients (17%; 95% CI, 14%-20%), patients with another race and ethnicity (16%; 95% CI, 13%-19%), American Indian and Alaska Native patients (15%; 95% CI, 11%-21%), Asian and Pacific Islander patients (15%; 95% CI, 12%-18%), and Black patients (13%; 95% CI, 11%-16%). Adjusted probabilities across races and ethnicities are depicted in eFigure 2 in Supplement 1.
IRRs and 3-year adjusted probabilities were lower for patients who had (probability, 21%; 95% CI, 27%-35%) vs did not have (probability, 37%; 95% CI, 32%-42%) a psychiatric diagnosis (IRR, 0.79, 0.76-0.83; P < .001), had (probability, 37%; 95% CI, 32%-42%) vs did not have (probability, 49%; 95% CI, 43%-55%) a pain-related diagnosis (IRR, 0.69; 95% CI, 0.66-0.72; P < .001), and had (probability, 34%; 95% CI, 30%-40%) vs did not have (probability, 37%, 32%-42%) an obesity diagnosis (IRR, 0.92; 95% CI, 0.88-0.96; P < .001) prior to the index diagnosis. Patients with a CCI score of 2 or greater were less likely to undergo THA (probability, 32%; 95% CI, 28%-36%) compared to those with a CCI score of 0 (probability, 35%; 95% CI, 30%-41%) (IRR, 0.85; 95% CI, 0.74-0.97; P = .02). Patients diagnosed in the purchased care system (probability, 18%; 95% CI, 16%-21%) compared with the direct care system (probability, 37%; 95% CI, 32%-42%) were less likely to undergo THA (IRR, 0.38; 95% CI, 0.36-0.40; P < .001), and those diagnosed in later years (eg, 2022: probability, 36%; 95% CI, 32%-42%) were less likely to receive THA than those diagnosed earlier (eg, 2018: probability, 38%; 95% CI, 33%-43%) (IRR, 0.97; 95% CI, 0.95-0.99, P = .001). Patients with 1 (probability, 32%; 95% CI, 27%-37%) or more (probability, 29%; 95% CI, 25%-34%) preindex injections were less likely to receive THA than those who received none (probability, 37%; 95% CI, 32%-42%) (1 injection: IRR, 0.83; 95% CI, 0.77-0.90; P < .001; >1 injections: IRR, 0.75; 95% CI, 0.70-0.81; P < .001). Patients with at least 2 preindex imaging visit days (probability, 34%; 95% CI, 28%-40%) were less likely to receive THA than those with 0 visit days (probability, 37%; 95% CI, 32%-42%) (IRR, 0.77; 95% CI, 0.69-0.86; P < .001) (Table 2; eFigure 2 in Supplement 1). Probabilities and incidences were higher for retired service members (probability, 49%; 95% CI, 45%-53%) and family members (probability, 50%; 95% CI, 45%-55%) compared with active-duty service members (probability, 37%; 95% CI, 32%-42%) (retired service members: IRR, 1.39; 95% CI, 1.24-1.56; P < .001; family members: IRR, 1.48; 95% CI, 1.30-1.69; P < .001). Male patients were more likely to receive THA (probability, 37%; 95% CI, 32%-42%) compared with female patients (probability, 32%; 95% CI, 28%-37%) (IRR, 1.20; 95% CI, 1.11-1.31; P < .001). Patients with increasing orthopedic surgeon visit days after the index diagnosis (eg, 0 days: probability, 22%; 95% CI, 19%-26%; vs 2 days: probability, 58%; 95% CI, 52%-64%) were more likely to receive THA (IRR, 1.67; 95% CI, 1.64-1.69; P < .001), as were those with more opioid prescriptions (eg, 0 prescriptions: probability, 37%; 95% CI, 32%-42%; vs 2 prescriptions: probability, 43%; 95% CI, 38%-49%; IRR, 1.02; 95% CI, 1.01-1.03; P = .002) or more imaging visit days (eg, 0 days: probability, 30%; 95% CI, 26%-35%; vs 2 days: probability, 45%; 95% CI, 39%-50%; IRR, 1.26; 95% CI, 1.24-1.28, P < .001) (Table 2; eFigure 2 in Supplement 1). IRRs varied in direction across geographic areas. Compared with patients diagnosed in the South Atlantic area (probability, 37%; 95% CI, 32%-42%), those diagnosed in the Midwest (probability, 46%; 95% CI, 40%-53%) (IRR, 1.35; 95% CI, 1.22-1.49; P < .001), Mountain (probability, 45%; 95% CI, 39%-51%) (IRR, 1.34; 95% CI, 1.22-1.46; P < .001), and Pacific (probability, 42%, 36%-48%) (IRR, 1.30; 95% CI, 1.20-1.40; P < .001) areas had higher incidence of THA; whereas, patients diagnosed in a US territory, another country, or an unknown location had lower incidence (probability, 24%; 95% CI, 18%-31%) (IRR, 0.64; 95% CI, 0.52-0.78; P < .001).
Several smooth and time-varying covariates were also significant, indicating that longitudinal hazards were nonproportional for several covariates (Table 2). Therefore, visualizations are provided in eFigures 2 to 5 in Supplement 1. Lastly, adjusted cumulative probabilities of THA receipt across covariate values at 1, 2, and 3 years after the index diagnosis are reported in eTable 4 in Supplement 1.
Sensitivity Analysis
In the first set of sensitivity GAMs, 6896 patients were included in the direct care–only GAM and 20 821 patients were included in the purchased care–only GAM (eTable 2 in Supplement 1). Therefore, 9522 patients who had hip osteoarthritis care across both systems were removed from this analysis. There were 6165 patients included in the sensitivity analysis of patients receiving all hip osteoarthritis care in the direct care system with an index diagnosis at a military treatment facility with at least 25 included patients. Each sensitivity model required different time-varying covariates.
The significant associations found in the primary model were similar to the sensitivity models with some exceptions. Similar to the primary model, Black patients had lower IRRs across all 3 models (direct care: IRR, 0.74; 95% CI, 0.66-0.82; P < .001; purchased care: IRR, 0.77; 95% CI, 0.68-0.88; P < .001; direct care with facility random effect: IRR, 0.84; 95% CI, 0.73-0.96; P = .01) than White patients (eTable 3 and eFigure 4 in Supplement 1). Asian and Pacific Islander patients had lower IRR in both the primary and purchased care models (IRR, 0.72; 95% CI, 0.55-0.95; P = .02); there was a lack of statistically significant differences in the direct care models. While patients with another race and ethnicity did not significantly vary in time to THA in the primary model compared with White patients, the IRR was lower in the purchased care model (IRR, 0.80; 95% CI, 0.65-0.97; P = .02). The significantly lower IRRs in the primary analysis for Hispanic patients did not maintain in the sensitivity models. Male patients had higher IRRs in the primary and purchased care models (IRR, 1.29; 95% CI, 0.17-1.43; P < .001) compared with female patients, but not in the direct care sensitivity models. The association of having 2 or more preindex imaging visits with lower IRRs compared with none in the primary model was maintained in the purchased care model (IRR, 0.80; 95% CI, 0.68-0.93, P = .004) and direct care sensitivity model with the facility-level random effect (IRR, 0.76; 95% CI, 0.60-0.90; P = .02). Patients with CCI scores 2 or greater and fewer opioid prescriptions had lower IRRs in the primary model but lacked significance across the 3 sensitivity models.
IRR varied across geographic areas, with differences in the direction of associations across models. Compared with the South Atlantic area, patients in the Midwest had higher incidence of THA in the purchased care model (IRR, 1.28; 95% CI, 1.10-1.48; P = .001), similar to the primary model, but lower incidence in the direct care model with the facility-level random effect (IRR, 0.29; 95% CI, 0.12-1.70; P = .006). Similarly, patients in the Mountain area had higher incidence of THA in the purchased care model (IRR, 1.45; 95% CI, 1.27-1.66; P < .001), like the primary model, but lower incidence in the direct care model (IRR, 0.61; 95% CI, 0.46-0.80; P < .001).
Discussion
In this cohort study, several patient-, care-, and structural-level factors were associated with time to THA in a sample of patients enrolled in TRICARE Prime, TRICARE Plus, and direct care–only plans. Similar to prior research, Asian and Pacific Islander, Black, and Hispanic patients, compared with White patients, and female patients, compared with male patients, were less likely to receive a THA across time.^6,7,8,13^ In sensitivity analyses of subsamples receiving all hip osteoarthritis care in the direct vs purchased care systems, Black patients and female patients had lower hazards of THA across time. While older patients and retired service members and family members had higher THA hazards relative to younger patients and active-duty service members, respectively, the discrepancies increased within the first year, then plateaued. Most athletes return to sports within 6 to 12 months of hip arthroplasty,^35^ but return may be contingent on the physical demands of the sport.^36^ For active-duty service members, not being able to maintain physical fitness requirements for an extended period may have negative career implications (eg, reduced deployability, medical separation).^37^ Alternatively, younger patients and active-duty service members may have received an osteoarthritis diagnosis earlier in the disease process, which could be more amenable to nonpharmacological and pharmacological management. Taken together, patient-level variation in time to THA within the MHS is similar to prior studies and warrants further investigation into osteoarthritis diagnosis timing and referral pathways.
Delay in THA may be due to systemic barriers across geographic areas, especially for patients in the purchased care system whose health care is not delivered in a centralized facility. In a 2018 study,^38^ Black patients had worse presurgical pain and functioning before THA; after surgery, Black patients residing in areas with higher proportions of Medicaid enrollees and people whose incomes were below the federal poverty threshold had worse outcomes than those living in less socioeconomically marginalized areas. However, White patients who resided in areas with high vs low socioeconomic marginalization lacked differences.^38^ In a Medicare claims evaluation,^39^ hospital service areas with higher proportions of Black residents tended to have fewer surgeons per capita. Other studies have reported that Black and Hispanic patients undergoing total joint arthroplasty were less likely to receive care from high-volume hospitals, which may result in worse outcomes.^40,41^ In this study, geographic area was associated with THA receipt, but variation across geographic areas with direct vs purchased care systems highlights the need to evaluate and incorporate orthopedic surgeon locations, structural factors, and beneficiary residences within geospatial modeling to optimize personnel allocation and care access.
Patients who received their index hip osteoarthritis diagnosis in purchased care were less likely to receive a THA across time relative to those diagnosed in direct care. This finding demonstrates challenges with purchased care access, which may be due to reduced reimbursement rates^42^ or increased care navigation demands. It is unclear whether increasing reimbursement rates or access to care navigators would improve THA timeliness. Prior research indicates that the Medicare Comprehensive Care for Joint Replacement Model may have improved total knee and hip arthroplasty accessibility for Hispanic patients but may have reduced accessibility for Black patients, with no changes in receipt for White patients.^43^ While increasing direct care recapture is a Department of Defense goal,^44^ it is unclear whether the direct care system has adequate capacity, per reports by both the Government Accountability Office and Department of Defense Inspector General.^45,46^ As a result, access to THA, as well as hip osteoarthritis care consistent with the policy-directed Stepped Care Model for Pain,^47^ may be stymied. Recommendations from these reports highlight the need to fully evaluate health care requirements, accessibility, barriers, and staffing to implement effective strategies across direct and purchased care systems.
Because the MHS is a single-payer system, surgeon allocation and care models could be altered to optimize timely THA access, reduce delay, and enhance value-based care. However, recent estimates indicate total joint arthroplasty volumes at military treatment facilities and among its orthopedic surgeons are generally low, and surgeons with the highest volume are still considered to have a relatively medium volume^48^ compared with prior research.^49^ Restructuring the MHS to enable high-volume arthroplasty hospitals and surgeons could improve patient outcomes and reduce costs.^40,41,50,51^ Future restructuring requires a thorough evaluation of factors preventing high-volume arthroplasty facilities and surgeons, as volume could be attributed to many factors (eg, surgical and imaging personnel, equipment, and room availability; patient transportation; and access to post-THA physical therapy).
Limitations
This study has several limitations. Several factors associated with THA (eg, osteoarthritis symptom severity, hip joint trauma history, morphology, environmental exposures) were not available in these data, and the proportion of patients with posttraumatic hip osteoarthritis index diagnoses was small (1%). To account for symptom severity, analyses included time-dependent health care covariates that could offset THA need (eg, therapeutic visits) or made THA more likely (eg, imaging and orthopedic surgeon visits).^52^ The aggregated therapeutic visits variable incorporated many care types; specific conclusions regarding which therapies were attributed to THA timing were outside the study scope. Recorded diagnoses may be provisional and may not represent finalized or confirmed diagnoses. Therefore, there were several bivariate differences between patients who were included vs excluded from the sample due to not having a follow-up osteoarthritis visit at least 1 week after the index diagnosis. Evaluating why patients did not continue hip osteoarthritis care was outside the study scope. This study did not include patients whose race and ethnicity were not recorded in their records; bivariate analyses indicated that patients without race and ethnicity in their administrative records were disproportionately family members of TRICARE policy holders. Historically, TRICARE registration is done by the primary policy holder (eg, active-duty or retired service member), and policy holders are not required to report the race and ethnicity of family members. Therefore, findings may not generalize to patients who are family members. While management of hip and other lower-limb conditions could indirectly affect hip osteoarthritis symptoms and this study leveraged hip imaging and injection codes used in previous work, it is not possible to confirm their use was for hip osteoarthritis or the specific injection type. Due to the lack of adequate sample sizes at purchased care hospitals, analyses could not incorporate a random effect for facility in the primary and purchased care models. This study only included patients enrolled in specific TRICARE and direct care–only plans; therefore, generalizability to patients in other health care systems may be limited.
Conclusions
This cohort study identified variation in time to THA among MHS beneficiaries. Consistent with US Government Accountability Office and Department of Defense Inspector General reports, future research could be used to improve THA accessibility and reduce barriers by accounting for structural inputs, such as personnel availability and reimbursement rates within the context of geographic location.
The reference list from the paper itself. Each links out to its DOI / PubMed record.
- 1Cooper GM, Bayram JM, Clement ND. The functional and psychological impact of delayed hip and knee arthroplasty: a systematic review and meta-analysis of 89,996 patients. Sci Rep. 2024;14(1):8032. doi:10.1038/s 41598-024-58050-6 38580681 PMC 10997604 · doi ↗ · pubmed ↗
- 2Singh JA, Yu S, Chen L, Cleveland JD. Rates of total joint replacement in the United States: future projections to 2020-2040 using the National Inpatient Sample. J Rheumatol. 2019;46(9):1134-1140. doi:10.3899/jrheum.170990 30988126 · doi ↗ · pubmed ↗
- 3Shichman I, Roof M, Askew N, . Projections and epidemiology of primary hip and knee arthroplasty in Medicare patients to 2040-2060. JB JS Open Access. 2023;8(1):e 22.00112. doi:10.2106/JBJS.OA.22.00112 36864906 PMC 9974080 · doi ↗ · pubmed ↗
- 4Qiu A, Meadows K, Ye F, Iyawe O, Kenneth-Nwosa K. Quantifying patient demand for orthopedics care by region through Google Trends analysis: descriptive epidemiology study. Online J Public Health Inform. 2025;17:e 63560. doi:10.2196/63560 39888712 PMC 11804898 · doi ↗ · pubmed ↗
- 5Sloan M, Premkumar A, Sheth NP. Future demand for total joint arthroplasty drives renewed interest in arthroplasty fellowship. HSS J. 2020;16(suppl 2):210-215. doi:10.1007/s 11420-019-09678-y 33380948 PMC 7749885 · doi ↗ · pubmed ↗
- 6Thirukumaran CP, Cai X, Glance LG, . Geographic variation and disparities in total joint replacement use for Medicare beneficiaries: 2009 to 2017. J Bone Joint Surg Am. 2020;102(24):2120-2128. doi:10.2106/JBJS.20.00246 33079898 PMC 8190867 · doi ↗ · pubmed ↗
- 7Best MJ, Mc Farland EG, Thakkar SC, Srikumaran U. Racial disparities in the use of surgical procedures in the US. JAMA Surg. 2021;156(3):274-281. doi:10.1001/jamasurg.2020.6257 33439237 PMC 7807389 · doi ↗ · pubmed ↗
- 8Hartnett DA, Brodeur PG, Kosinski LR, Cruz AI Jr, Gil JA, Cohen EM. Socioeconomic disparities in the utilization of total hip arthroplasty. J Arthroplasty. 2022;37(2):213-218.e 1. doi:10.1016/j.arth.2021.10.021 34748913 · doi ↗ · pubmed ↗