Glaucoma and cardiovascular disease: a bidirectional two-sample Mendelian randomization analysis
Dongdong Jin, Jie Sun, Wei Zhang, Mingxuan Zhang, Chengfang Li

TL;DR
This study finds a potential causal link between glaucoma and cardiovascular diseases like heart attacks and high blood pressure using genetic data.
Contribution
The study uses bidirectional Mendelian randomization to explore causal relationships between glaucoma and various cardiovascular diseases.
Findings
Glaucoma is associated with a decreased risk of myocardial infarction.
Genetic susceptibility to unstable angina pectoris and high blood pressure increases glaucoma risk.
High blood pressure shows heterogeneity and is a risk factor for glaucoma.
Abstract
Many studies reported that glaucoma is associated with cardiovascular disease (CVD). This study aims to investigate the potential causal relationship between glaucoma and CVD using a bidirectional two-sample Mendelian randomization (MR) analysis. The genome-wide association studies (GWAS) of glaucoma and CVD were downloaded from the IEU OpenGWAS project. The CVD included unstable angina pectoris (UAP), coronary artery disease (CAD), high blood pressure (HBP), myocardial infarct (MI), heart failure (HF), ischemic stroke (IS), atrial fibrillation (AF), and pulmonary embolism (PE). The inverse variance weighting (IVW) analysis was the primary method in MR analysis. Meanwhile, sensitivity analysis and statistical power tests were performed. The random effects IVW method showed a causal relationship between glaucoma and a decreased risk of MI (Odds ratio (OR): 0.94, 95% confidence interval…
Genes, proteins, chemicals, diseases, species, mutations and cell lines named across the full text — each resolved to its canonical identifier and authoritative record.
Click any figure to enlarge with its caption.
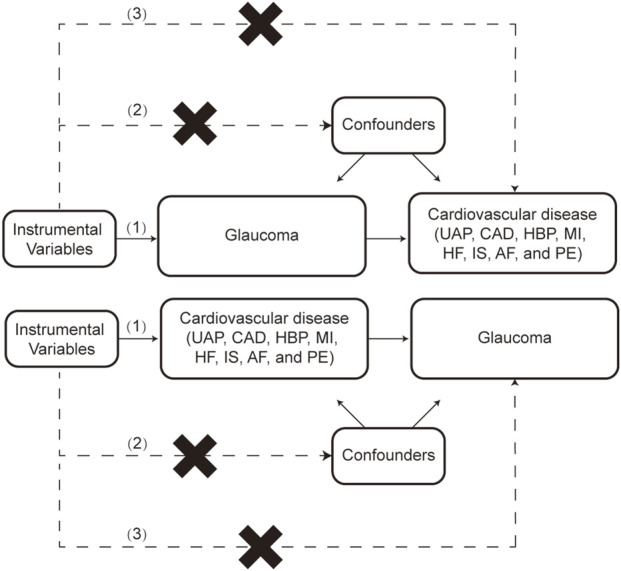 FIGURE 1
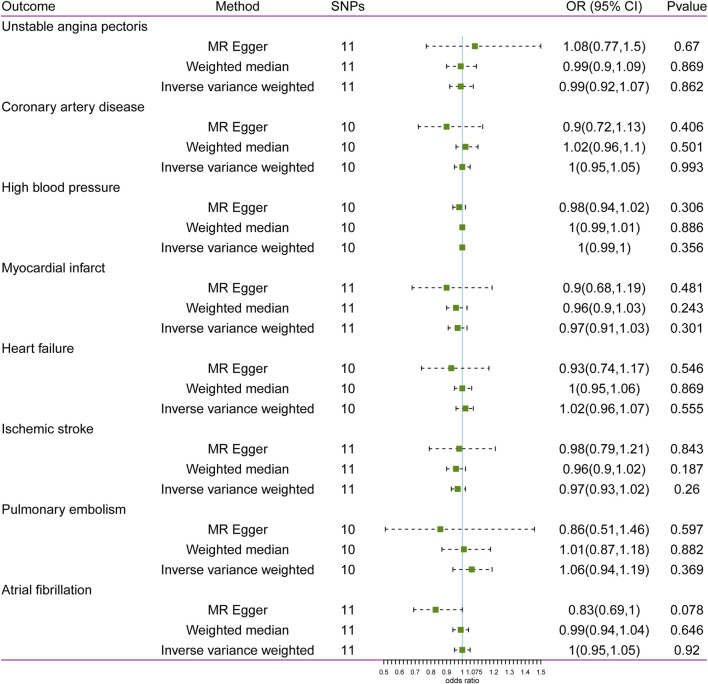 FIGURE 2
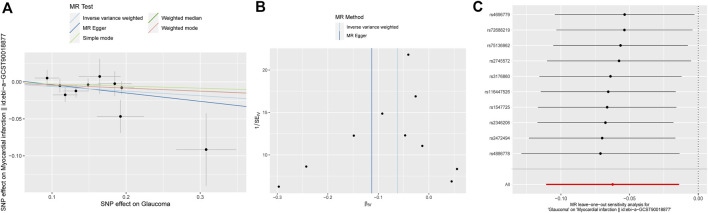 FIGURE 3
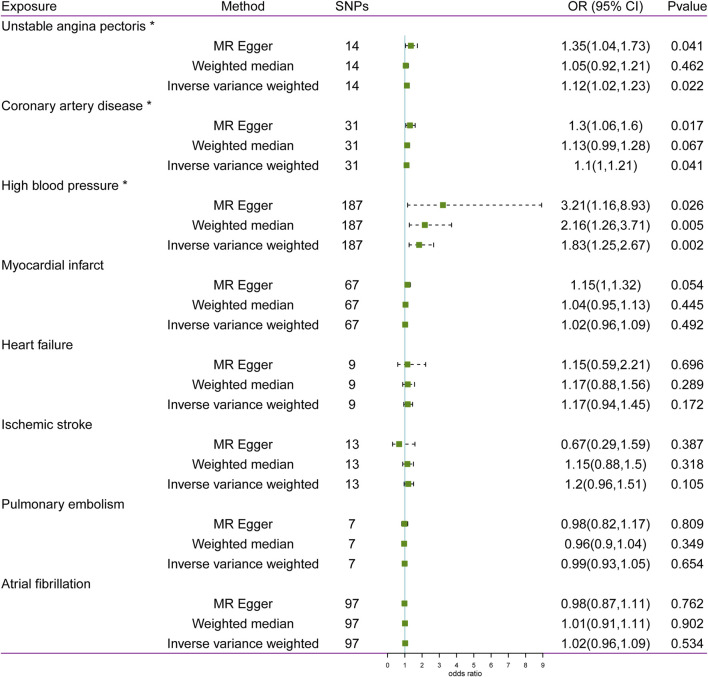 FIGURE 4
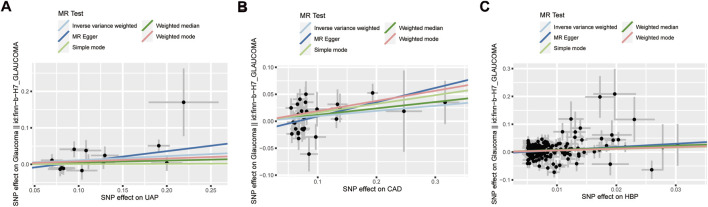 FIGURE 5
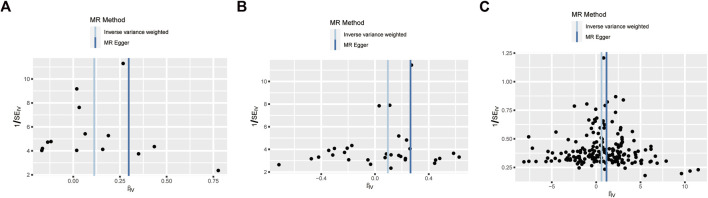 FIGURE 6
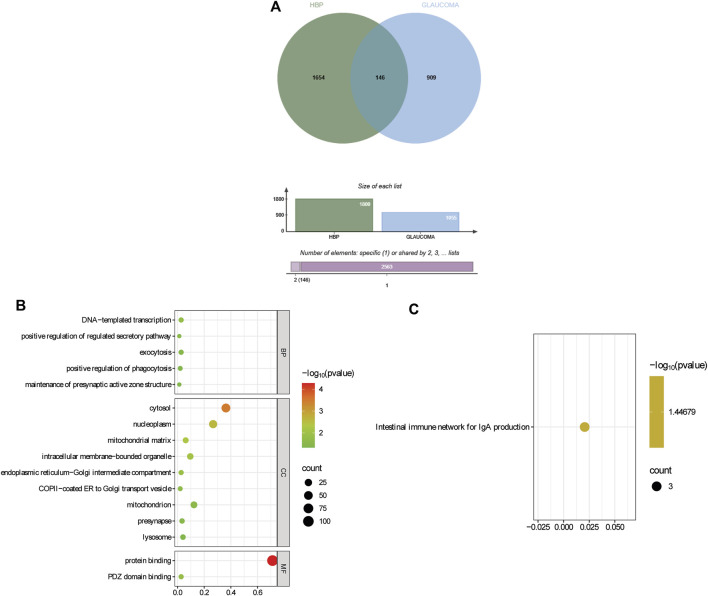 FIGURE 7
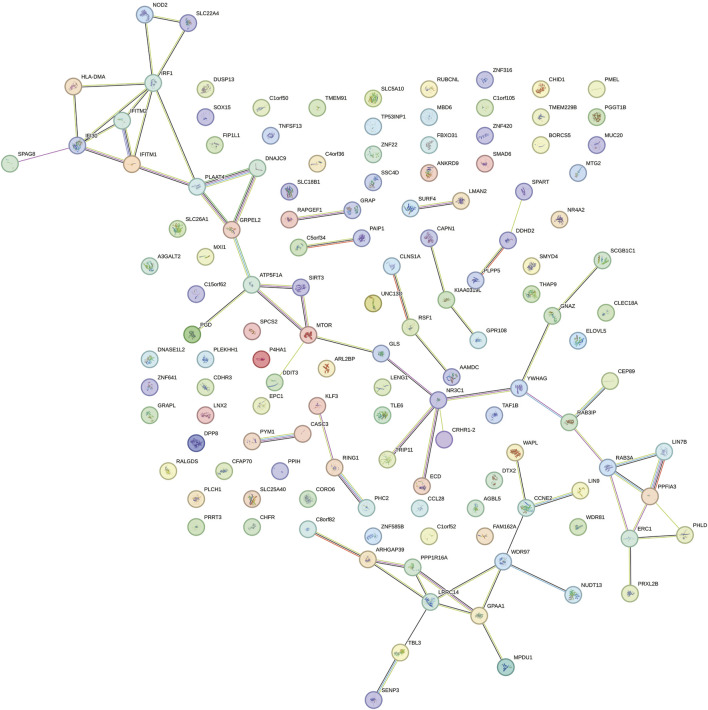 FIGURE 8
| Exposure or outcomes | GWAS ID | Sample size (case/controls) | SNPs | Year |
|---|---|---|---|---|
| Glaucoma | finn-b-H7_GLAUCOMA | 8,591/210,201 | 16,380,466 | 2021 |
| Unstable angina pectoris | ebi-a-GCST90018932 | 9,481/446,987 | 24,179,929 | 2021 |
| Coronary artery disease | ebi-a-GCST003116 | 42,096/361 | 8,597,751 | 2015 |
| High blood pressure | ukb-b-14177 | 124,227/337,653 | 9,851,867 | 2018 |
| Myocardial infarct | ebi-a-GCST90018877 | 20,917/440,906 | 24,172,914 | 2021 |
| Heart failure | ebi-a-GCST009541 | 47,309/93,0014 | 7,773,021 | 2020 |
| Ischemic stroke | ebi-a-GCST90018864 | 11,929/472,192 | 24,174,314 | 2021 |
| Atrial fibrillation | ebi-a-GCST006414 | 60,620/970,216 | 11,039,197 | 2018 |
| Pulmonary embolism | ebi-a-GCST90013887 | 407,746 | 33,519,037 | 2021 |
| Outcome | Heterogeneity test | Pleiotropy test | |||||||
|---|---|---|---|---|---|---|---|---|---|
| MR-Egger | Inverse variance weighted | MR-Egger | |||||||
| Q | Q_df | Q_pval | Q | Q_df | Q_pval | Egger intercept | se | pval | |
| UAP | 12.731 | 9 | 0.175 | 13.073 | 10 | 0.220 | −0.012 | 0.025 | 0.634 |
| CAD | 9.306 | 8 | 0.317 | 10.245 | 9 | 0.331 | 0.015 | 0.017 | 0.395 |
| HBP | 31.092 | 8 | 1.35E-04 | 34.297 | 9 | 7.92E-05 | 0.003 | 0.003 | 0.390 |
| MI | 18.341 | 9 | 0.031 | 18.900 | 10 | 0.042 | 0.011 | 0.021 | 0.613 |
| HF | 14.607 | 8 | 0.067 | 15.730 | 9 | 0.073 | 0.013 | 0.017 | 0.455 |
| IS | 9.799 | 9 | 0.367 | 9.801 | 10 | 0.458 | −0.001 | 0.016 | 0.971 |
| PE | 4.929 | 8 | 0.765 | 5.531 | 9 | 0.786 | 0.030 | 0.038 | 0.460 |
| AF | 14.090 | 9 | 0.119 | 20.431 | 10 | 0.025 | 0.027 | 0.013 | 0.075 |
| Exposure | Heterogeneity test | Pleiotropy test | |||||||
|---|---|---|---|---|---|---|---|---|---|
| MR-Egger | Inverse variance weighted | MR-Egger | |||||||
| Q | Q_df | Q_pval | Q | Q_df | Q_pval | Egger intercept | se | pval | |
| UAP | 12.569 | 12 | 0.401 | 15.020 | 13 | 0.306 | −0.023 | 0.015 | 0.152 |
| CAD | 35.806 | 29 | 0.179 | 39.748 | 30 | 0.110 | −0.018 | 0.010 | 0.084 |
| HBP | 238.149 | 185 | 0.005 | 239.889 | 186 | 0.005 | −0.005 | 0.004 | 0.246 |
| MI | 79.118 | 65 | 0.112 | 83.277 | 66 | 0.074 | −0.012 | 0.006 | 0.069 |
| HF | 2.686 | 7 | 0.912 | 2.689 | 8 | 0.952 | 0.001 | 0.022 | 0.958 |
| IS | 16.348 | 11 | 0.129 | 19.144 | 12 | 0.085 | 0.036 | 0.026 | 0.197 |
| PE | 2.736 | 5 | 0.741 | 2.747 | 6 | 0.840 | 0.003 | 0.026 | 0.921 |
| AF | 154.450 | 95 | 0.000 | 155.349 | 96 | 0.000 | 0.004 | 0.005 | 0.459 |
Peer Reviews
No public reviews on file for this paper yet. If you reviewed it on a platform where reviews are public (OpenReview, ICLR, NeurIPS, ICML), you can paste yours below so the community can read it here.
Videos
No videos yet. Explain this paper in a talk, walkthrough, or lecture? Add one.
Taxonomy
TopicsGlaucoma and retinal disorders · Genetic Associations and Epidemiology · Diabetes, Cardiovascular Risks, and Lipoproteins
Impact statement
Many studies reported that glaucoma is associated with CVD. However, the causal relationship between glaucoma and CVD is not clear. This discovery bridges the gap between basic research and clinical care, providing genetic-based evidence. This evidence could potentially guide the development of prevention strategies in the clinical practice of glaucoma and CVD, such as early screening for at-risk patients with specific cardiovascular conditions for glaucoma and vice versa, and tailoring treatment plans considering the identified causal relationships. The MR analysis found that glaucoma serves as a protective factor for MI, while UAP and HBP were risk factors for glaucoma in the European population, which may contribute to preventing and managing glaucoma and CVD.
Introduction
Glaucoma is a chronic, progressive optic neuropathy, characterized by optic nerve damage and visual field loss, leading to irreversible blindness [1]. In 2020, glaucoma (3.6 million cases) is the second leading cause of blindness in people aged 50 and older worldwide, after cataracts (15.2 million cases) [2]. The global prevalence of glaucoma is 3.54%, and patients with glaucoma are expected to reach 111 million by 2040 [3]. Based on the anatomical state of the anterior chamber angle, glaucoma can be categorized into open-angle and closed-angle types [4]. Each type can be further divided into primary and secondary glaucoma [4]. An increase in intraocular pressure (IOP) is closely associated with the development of glaucoma, and lowering IOP is the only feasible way to treat glaucoma [1, 5]. However, the IOP of nearly 50% of glaucoma patients falls within the normal range [1]. Many studies have reported that there are associations between gut microbiota, body mass index, and waist circumference with glaucoma [6, 7]. Noteworthily, some cardiovascular diseases (CVD) have also been associated with glaucoma [8, 9].
CVD are various diseases that affect the heart and blood vessels, such as unstable angina pectoris (UAP), coronary artery disease (CAD), high blood pressure (HBP), myocardial infarction (MI), heart failure (HF), ischemic stroke (IS), atrial fibrillation (AF), and pulmonary embolism (PE) [10, 11]. CVD poses a heavy medical burden in China [12]. Several large population studies have reported CVD as a risk factor for open-angle glaucoma (OAG) [13, 14]. Bennion et al. demonstrated that heart disease was the leading cause of death in glaucoma-related mortality in the United States, followed by malignant neoplasms and cerebrovascular disease [15]. Similarly, patients with OAG are about 1.5 times more likely to develop CVD than non-glaucoma individuals [16]. However, the causal relationship between glaucoma and CVD is not clear.
Mendelian randomization (MR) analysis is applied to explore the potential causal relationship between exposure and outcome through single‐nucleotide polymorphisms (SNPs) as the instrumental variable (IV) [17]. Since the selected SNPs were randomly assigned through meiosis, MR results are not influenced by confounders between exposure and outcome and reverse causation [18]. Meng et al. reported that ankylosing spondylitis was the risk factor for both primary OAG and primary angle-closure glaucoma [19]. In addition, getting up easily in the morning and sleep duration were demonstrated as risk factors for POAG through MR analysis [20]. Therefore, the potential causal effects between glaucoma and CVD, including MI, HBP, HF, PE, CAD, UAP, IS, and AF, are explored using bidirectional two-sample MR analysis in this study.
Materials and methods
Data source and study design
Summary statistics data for glaucoma- and CVD-associated SNPs were collected from the IEU OpenGWAS project1. The GWAS of glaucoma2 included 8,591 cases and 210,201 controls. For the CVD datasets, summary data for UAP3 included 9,481 cases and 446,987 controls [21], summary data for CAD4 comprised 42,096 cases and 361 controls [22], summary data for HBP5 included 124,227 cases and 337,653 controls, summary data for MI6 comprised 20,917 cases and 440,906 controls [21], summary data for HF7 included 47,309 cases and 930,014 controls [23], summary data for IS8 comprised 11,929 cases and 472,192 controls [21], and summary data for AF9 contained 60,620 cases and 970,216 controls [24]. The summary data for PE10 included 407,746 samples [25]. The detailed information of all the GWAS is demonstrated in Table 1. All statistical data were gathered from the descendants of Europeans, reducing the potential bias due to racial differences. Notably, no overlap was observed, given that samples of glaucoma and CVD originated from distinct study groups.
Two-sample MR analysis was utilized to explore the potential causal association between glaucoma and CVD risks. An overview of the study design is shown in Figure 1. SNPs served as IVs must satisfy the following conditions: (1) IVs must be closely related to the exposure; (2) IVs independent from confounders; (3) IVs only affect outcomes through exposure, not through other pathways.
The flow chart of this study. The MR method is based on 3 hypotheses: (1) Instrumental variables (IVs) must be closely related to the exposure; (2) IVs independent from confounders; (3) IVs only affect outcomes through exposure, not through other pathways. UAP: Unstable angina pectoris, CAD: Coronary artery disease, HBP: High blood pressure, MI: Myocardial infarction, HF: Heart failure, IS: Ischemic stroke, AF: Atrial fibrillation, PE: Pulmonary embolism.
Selection of IVs
First, the SNPs with p-value < 5 × 10^−8^ were selected as the IVs. Then, the parameters (r^2^ < 0.001 and clump window = 10,000 kb) were utilized to remove the linkage disequilibrium bias. Next, SNPs with F-statistic >10, strongly correlated with exposure, were obtained [26].
Statistical analysis
This study used three methods (fixed-effects inverse variance weighted (IVW), weighted median, and MR-Egger) to perform MR analysis. The fixed-effects IVW method is the primary analysis to assess the causal associations between glaucoma and CVD according to heterogeneity [27]. Weighted median and MR-Egger methods were applied as supplementary analyses. The weighted median method can provide reliable causal estimates when at least half of the IVs are valid [28]. MR-Egger regression can discern horizontal pleiotropy and offer causal estimates after correction for horizontal pleiotropy [28].
For sensitivity analysis, firstly, MR-Egger regression and IVW methods were used to detect heterogeneity [28]. Cochrane’s Q-derived p-value < 0.05 indicated that heterogeneity existed between IVs, and then random effects IVW was carried out to calculate causal estimates [29]. Second, for the horizontal pleiotropy analysis, the MR-Egger intercept was performed. The p-value > 0.05 was considered a weak possibility of genetic pleiotropy, and its impact may be discarded [30]. The MR-PRESSO method was utilized to remove outliers and then calculate causal estimates [31]. Finally, leave-one-out was performed to evaluate whether the results were caused by a single SNP [32]. The “TwoSampleMR” and “MR-PRESSO” packages in R (v 4.2.3) were utilized to perform statistical analysis.
Summary data-based mendelian randomization (SMR) analysis
Using the summary statistics of eQTL and GWAS, the association between gene expression and HBP and glaucoma was tested by SMR analysis. Gene expression was used as the exposure factor, and HBP and glaucoma were the outcome factors. The SNPs of cis-eQTL were used as IVs. The analysis was performed using Rstudio and SMR software, with default settings applied during the analysis. Genes with significant loci were selected using P_SMR less than 0.05, and the heterogeneity in dependent instruments (HEIDI) test was used to evaluate the heterogeneity of the results (p_HEIDI > 0.05). Subsequently, GO and KEGG enrichment analysis (P < 0.05) was performed and a Protein-Protein Interaction (PPI) network was constructed to explore the possible molecular mechanisms involved in potential pathogenic genes.
Results
Information of IVs
A total of 11 SNPs associated with glaucoma were obtained. For SNPs linked to CVD, there were 14 for UAP, 31 for CAD, 187 for HBP, 67 for MI, 9 for HF, 13 for IS, 7 for PE, and 97 for AF. All SNPs were satisfied the following criteria: p < 5 × 10^−8^, r^2^ < 0.001, and clump window = 10,000 kb. Simultaneously, palindromic SNPs were removed. The range of SNPs associated with glaucoma based on F-statistic was 30.91–135.09, while the range of SNPs linked to CVD was 29.50–2039.47.
Causal effects of glaucoma on CVD
The results of MR analysis do not support a causal relationship between glaucoma and CVD risks (Figure 2). The p-values of Cochran’s Q test were less than 0.05 for both MR-Egger and IVW methods in HBP and MI, demonstrating that the IVs of HBP and MI presented different degrees of heterogeneity (Table 2). Additionally, IVW analysis showed that IVs in AF (P = 0.025) also have heterogeneity (Table 2). Meanwhile, the MR-Egger regression intercept test found that IVs among CVD were not present with horizontal pleiotropy (Table 2). Then, random effects IVM analysis was carried out, and we found that no causal associations existed between glaucoma and HBP (P = 0.356), MI (P = 0.301), and AF (P = 0.92). MR-PRESSO analysis showed that HBP (P < 0.001), MI (P = 0.049), and AF (P = 0.021) existed horizontal pleiotropy. After removing outliers, causal relationships between glaucoma and HBP, as well as AF, were not present. However, there was a causal relationship between glaucoma and MI (P = 0.028). Subsequently, MR analysis was performed again after removing outliers, and the results showed that glaucoma was linked to a decreased risk of MI (OR: 0. 94, 95% CI: 0.89–0.99; P = 0.012). The effect estimates of glaucoma on MI by different MR methods are displayed in Figure 3A. The funnel plots is displayed in Figure 3B. The leave-one-out method revealed that no SNPs strongly affected the potential causal association between glaucoma and MI risk (Figure 3C).
Associations between glaucoma and risk of cardiovascular disease using Mendelian randomization analysis. SNPs: Single-nucleotide polymorphisms, OR: Odds ratio, CI: Confidence interval.
Associations between glaucoma and risk of MI using Mendelian randomization analysis. (A) Scatter plot for the associations between glaucoma and MI. (B) Funnel plots for the relationship between glaucoma and MI. (C) Leave-one-out for the relationship between glaucoma and MI. MI: Myocardial infarction; SNP: Single nucleotide polymorphism.
Causal effects of CVD on glaucoma
The statistical results of reverse-direction MR between CVD and glaucoma are depicted in Figure 4. We found that genetic susceptibility of UAP, CAD, and HBP was significantly linked to glaucoma (Figure 4). The Odds ratios (ORs) of UAP, CAD, and HBP were 1.12 (95% confidence interval (CI): 1.02–1.23; P = 0.022), 1.1 (95% CI: 1–1.21; P = 0.041), and 1.83 (95% CI: 1.25–2.67; P = 0.002), respectively, in the IVW model. However, no evidence was supported for the causal association between MI (OR: 1.02, 95% CI: 0.96–1.09; P = 0.492), HF (OR: 1.17, 95% CI: 0.94–1.45; P = 0.172), IS (OR: 1.2, 95% CI: 0.96–1.51; P = 0.105), PE (OR: 0.99, 95% CI: 0.93–1.05; P = 0.654), AF (OR: 1.02, 95% CI: 0.96–1.09; P = 0.534) and glaucoma. Noteworthily, the result of MR-Egger in HBP was consistent with the IVW method (Figure 5).
Associations between cardiovascular disease and risk of glaucoma using Mendelian randomization analysis. SNPs: Single-nucleotide polymorphisms, OR: Odds ratio, CI: Confidence interval.
Scatter plot for the associations between UAP (A), CAD (B), as well as HBP (C) and glaucoma. UAP: Unstable angina pectoris; CAD: Coronary artery disease; HBP: High blood pressure; SNP: Single nucleotide polymorphism.
MR-Egger regression and IVW analysis for UAP, CAD, MI, HF, IS, and PE revealed no heterogeneity among IVs. However, both MR-Egger regression (P = 0.005) and IVW analysis (P = 0.005) of HBP indicated the presence of heterogeneity among IVs (Table 3). The IVs in AF also exhibited heterogeneity (P = 0.0001). The MR-Egger regression intercept test indicated no horizontal pleiotropy among the IVs for CVD. Then, random effects IVM analysis demonstrated a causal association between HBP and glaucoma (P = 0.0017). After eliminating outliers (rs2032915 and rs73046792) in the MR-PRESSO analysis, genetic susceptibility of HBP was also significantly associated with glaucoma (P = 0.00015). The funnel plots of UAP, CAD, and HBP are displayed in Figure 6. Additionally, random effects IVM analysis showed that glaucoma susceptibility was unrelated to AF (P = 0.086). Furthermore, leave-one-out analysis demonstrated that the causal relationships between UAP, CAD, and HBP and glaucoma were not driven by any single SNP (Supplementary Figure S1).
Funnel plot to assess the robustness. Unstable angina pectoris (A), Coronary artery disease (B), and High blood pressure (C). MR: mendelian randomization; SE: standard error; IV: instrument variable.
Multivariable MR (MVMR) analysis
Based on the observed causal association between UAP, CAD, and HBP and glaucoma, further MVMR was performed to evaluate the causal effect of UAP, CAD, and HBP on glaucoma after adjusting for the underlying risk factors. The selected common risk factors of smoking, obesity, body mass index (BMI), and physical activity were validated whether there was the presence of causality with glaucoma in using MR analysis, and results showed that obesity and BMI were causally associated with glaucoma (Supplementary Table S1). Subsequently, obesity and BMI were included in the MVMR analysis, and the results showed that UAP and HBP were causally associated with glaucoma after controlling for the effects of obesity and BMI (Supplementary Table S2).
SMR analysis
Through SMR analysis and filtering by P_SMR and P_HEIDI, 1800 and 1055 potential pathogenic genes (potential drug targets) related to HBP and glaucoma were identified, respectively. Among them, 146 genes were common potential pathogenic genes for HBP and glaucoma (Figure 7A). The GO enrichment analysis revealed that the common potential pathogenic genes were associated with 5 biological processes, 9 cellular component and 2 molecular functions (Figure 7B). Furthermore, only one pathway intestinal immune network for IgA production was enriched in KEGG (Figure 7C). The pathogenic genes enriched in the intestinal immune network for IgA production signaling pathway include HLA-DMA, TNFSF13 and CCL28. Subsequently, the PPI network was used to analyze the interactions among the proteins encoded by the common potential pathogenic genes (Figure 8). The number of interacting proteins for IRF1, IFI30, NR3C1 and LRRC14 was relatively abundant, suggesting that they may play a key role in the regulatory pathways of HBP and glaucoma.
Identification and functional enrichment of common potential pathogenic genes for HBP and glaucoma. (A) Identification of common potential pathogenic genes. (B) GO enrichment of common potential pathogenic genes. (C) KEGG enrichment of common potential pathogenic genes.
PPI network of proteins encoded by common potential pathogenic genes.
Discussion
In a longitudinal prospective study from UK Biobank, multivariable Cox regression analyses demonstrated that individuals with glaucoma were more susceptible to develop CVD than healthy controls [9]. In the population-based cohort study, cardiovascular mortality is elevated in individuals with glaucoma among 3,654 persons aged 49–97 years [33]. A meta-analysis indicated that MI, chronic ischemic heart disease, angina, and HBP were related to pseudoexfoliation, which is the common cause of OAG [34]. In an epidemiological study of patients with diabetes, glaucoma was positively correlated with MI and arterial hypertension [35]. Our study showed that glaucoma was associated with a lower risk of MI after removing outliers, while no evidence supported the causal effects between glaucoma and other CVDs. Previous MR studies have shown that the results are different before and after removing outliers [36–38]. Eliminating abnormal instrumental variables can optimize causal inference [39].
The precise mechanism through which glaucoma reduces the risk of MI remains unclear. Impaired ocular blood flow regulation is one of the factors affecting glaucomatous optic neuropathy [40, 41]. The self-regulating system of arteries, arterioles, and capillaries is essential for maintaining steady blood flow within the eye [40]. Nitric oxide (NO) and renin-angiotensin system (RAS) are one way to regulate the stabilization of intraocular blood flow [40, 42]. Polak et al. found that NO was increased in endothelial cells of glaucoma [43]. In the cardiovascular system, NO, acting on vascular smooth muscle, serves as a significant vasodilator and protector against MI-reperfusion injury [44]. RAS is an important fluid regulatory system in the body, playing a crucial role in regulating vascular tone and blood pressure [45]. High concentrations of angiotensin II (ANG-II), a major active peptide of the RAS, were observed in the aqueous humor of patients with POAG [46]. However, the conversion of ANG-(1–7) from ANG-II has been reported to have protective effects on the cardiovascular system [47]. Additionally, timolol, a nonselective beta-blocker, can not only alleviate OAG but also be used to prevent MI [48]. Therefore, we speculate that NO and RAS may be a bridge between glaucoma and MI.
Reverse MR analysis showed that UAP, CAD, and HBP were associated with an increased risk of glaucoma in our study. A prospective longitudinal study supported by Marshall et al. reported that CVD significantly increases the risk of glaucoma progression [8]. Moreover, having cardiovascular risk factors/disease is associated with higher risk of developing POAG [13]. The relationships among UAP, CAD, and glaucoma were not reported, while many studies were consistent with our findings in HBP. In a retrospective cohort study, Baek et al. reported that higher morning blood pressure surge was a significant independent predictor of visual field progression in normal-tension glaucoma patients with hypertension [49]. Another retrospective study demonstrated that HBP (HR: 1.056), stage 1 hypertension (HR: 1.101), and stage 2 hypertension (HR: 1.114) were associated with an elevated risk of glaucoma [50]. A regression discontinuity study found that HBP positively correlates with glaucoma, and antihypertensive therapy can significantly reduce the risk of glaucoma progression in a nationwide survey covering >2.6 million individuals [51]. Mechanically, increased IOP was the leading risk factor for glaucoma, and IOP is controlled by aqueous humor homeostasis [1, 40]. HBP could elevate IOP through increased secretion of aqueous humor and decreased outflow of aqueous humor to cause glaucoma [52]. While reverse MR suggested an association, our MVMR (adjusting for obesity/BMI) did not detect a robust causal effect of CAD on glaucoma. This indicates that the initial association observed in MR was likely mediated by shared metabolic risk factors. Furthermore, this discrepancy may also stem from residual confounding—CAD often clusters with complex cardiovascular comorbidities (dyslipidemia, endothelial dysfunction) not fully captured by our selected covariates (obesity, BMI). Notably, the lack of prior literature on the causal relationship between CAD and glaucoma, which further highlights the necessity of conducting in-depth research.
Through SMR analysis, 146 common potential pathogenic genes for HBP and glaucoma were identified. The enrichment of these genes in the intestinal immune network for IgA production pathway (involving HLA-DMA, TNFSF13, and CCL28) is particularly intriguing, as it hints at a potential crosstalk between gut immunity and ocular/vasculature homeostasis. Additionally, PPI network analysis showed that IRF1, IFI30, NR3C1 and LRRC14 have relatively abundant interacting proteins, suggesting that these genes might act as key regulatory nodes in the molecular pathways underlying HBP and glaucoma. Collectively, these findings may provide new insights into the shared pathogenic mechanisms of HBP and glaucoma, and the identified common genes and pathways might serve as potential therapeutic targets for further investigation.
The present study has several advantages. First, for the first time, the causal effects between glaucoma and CVD, including MI, HBP, CAD, UAP, HF, IS, PE, and AF, were investigated using bidirectional two-sample MR analysis. Secondly, IVW was used to assess the causal association, and weighted median and MR-Egger methods were utilized as the supplementary analysis. Thirdly, the evaluations of IV strength and sensitivity analysis were carried out to ensure the accuracy and reliability of the results. Some limitations should be noticed in this study. The subtypes of glaucoma and different stages of CVD were not classified, and the relationships need to be further explored. Then, this study included only European populations and may not be applied to other populations. In addition, stratified analysis, such as the subgroups based on sex, age, could not be conducted with aggregated information from the GWAS. In the future, we will collect a large number of clinical samples to verify the results of this study and conduct further stratified analyses.
Conclusion
Conclusively, we found a causal effect between glaucoma and MI. In addition, reverse MR and MVMR suggested that UAP and HBP were the risk factors for glaucoma. However, the potential mechanisms among glaucoma, MI, UAP, and HBP require further investigation.
The reference list from the paper itself. Each links out to its DOI / PubMed record.
- 1Jayaram H Kolko M Friedman DS Gazzard G. Glaucoma: now and beyond. The Lancet (2023) 402:1788–801. 10.1016/s 0140-6736(23)01289-8 37742700 · doi ↗ · pubmed ↗
- 2Steinmetz JD Bourne RRA Briant PS Flaxman SR Taylor HRB Jonas JB Causes of blindness and vision impairment in 2020 and trends over 30 years, and prevalence of avoidable blindness in relation to VISION 2020: the right to sight: an analysis for the global burden of disease study. The Lancet Glob Health (2021) 9:e 144–e 160. 10.1016/s 2214-109x(20)30489-7 33275949 PMC 7820391 · doi ↗ · pubmed ↗
- 3Jerrome S Joseph S Niranjana B Arkaprava M Lakshmanan P Balagiri S Agreement and reliability of transpalpebral tonometers with goldmann applanation tonometer: a systematic review and meta-analysis. Ophthalmol Glaucoma (2025) 8:242–56. 10.1016/j.ogla.2024.11.001 39542211 · doi ↗ · pubmed ↗
- 4Kang JM Tanna AP. Glaucoma. Med Clin North America (2021) 105:493–510. 10.1016/j.mcna.2021.01.004 33926643 · doi ↗ · pubmed ↗
- 5Hakim A Guido B Narsineni L Chen D-W Foldvari M. Gene therapy strategies for glaucoma from IOP reduction to retinal neuroprotection: progress towards non-viral systems. Adv Drug Deliv Rev (2023) 196:114781. 10.1016/j.addr.2023.114781 36940751 · doi ↗ · pubmed ↗
- 6Zhou X Xu J Zhang X Zhao Y Duan X. Causal relationships between gut microbiota and primary open-angle glaucoma: a Mendelian randomization and mediation analysis of glaucoma endophenotypes. Exp Eye Res (2024) 240:109788. 10.1016/j.exer.2024.109788 38218362 · doi ↗ · pubmed ↗
- 7Yuan R Liu K Cai Y He F Xiao X Zou J. Body shape and risk of glaucoma: a Mendelian randomization. Front Med (2022) 9:999974. 10.3389/fmed.2022.999974 36213644 PMC 9538570 · doi ↗ · pubmed ↗
- 8Marshall H Mullany S Qassim A Siggs O Hassall M Ridge B Cardiovascular disease predicts structural and functional progression in early glaucoma. Ophthalmology (2021) 128:58–69. 10.1016/j.ophtha.2020.06.067 32730956 · doi ↗ · pubmed ↗