Serum creatinine-to-albumin ratio as a prognostic marker for short- and long-term mortality in critically ill stroke patients: a MIMIC-IV study
Dong Sun, Sichun Chen, Ying Bi, Shuang Wu, Yu Xie, Renwei Zhang, Lei Zhang, Bitang Dan, Huagang Li, Yang Liu, Yumin Liu, Bin Mei, Li Zou

TL;DR
This study shows that the serum creatinine-to-albumin ratio (sCAR) can predict both short- and long-term mortality in ICU stroke patients better than traditional markers.
Contribution
The study introduces sCAR as a novel, easily measurable biomarker for mortality risk in critically ill stroke patients.
Findings
High sCAR was linked to significantly higher 28-day and 1-year mortality in ICU stroke patients.
sCAR outperformed traditional markers in predicting mortality with AUCs of 0.618 and 0.639.
RCS curves showed a non-linear relationship between sCAR and mortality risk.
Abstract
Stroke remains a leading cause of mortality and disability worldwide, with critically ill patients facing particularly poor outcomes. Existing prognostic markers often fail to capture the full spectrum of metabolic and nutritional disturbances in stroke. The serum creatinine-to-albumin ratio (sCAR), reflecting renal function and nutritional status, may offer improved mortality prediction for the intensive care unit (ICU)-admitted stroke patients. This retrospective cohort study used the MIMIC-IV database (v2.2) to analyze 2,819 adult stroke patients admitted to the ICU. Patients were stratified into low- and high-sCAR groups based on an optimal cutoff of 0.419. Predictive performance was assessed using Cox regression, Kaplan–Meier survival analysis, and ROC and RCS curve modeling. Patients in the high sCAR group (≥0.419) demonstrated significantly higher short- and long-term…
Genes, proteins, chemicals, diseases, species, mutations and cell lines named across the full text — each resolved to its canonical identifier and authoritative record.
Click any figure to enlarge with its caption.
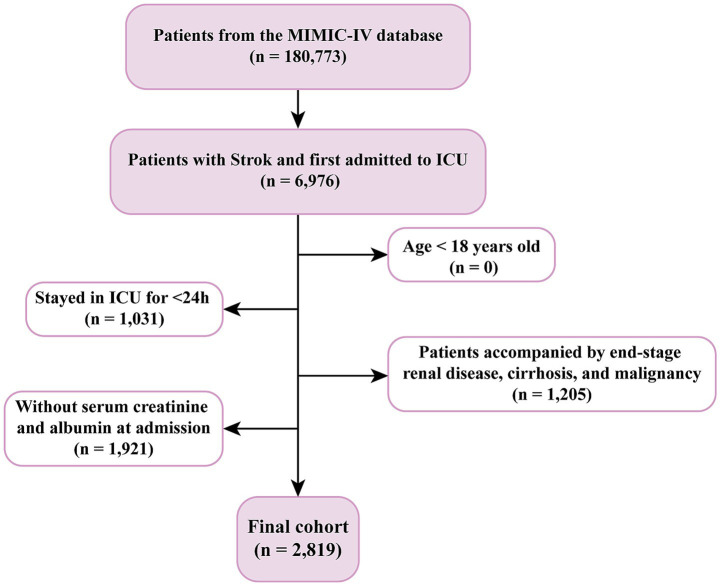 Figure 1
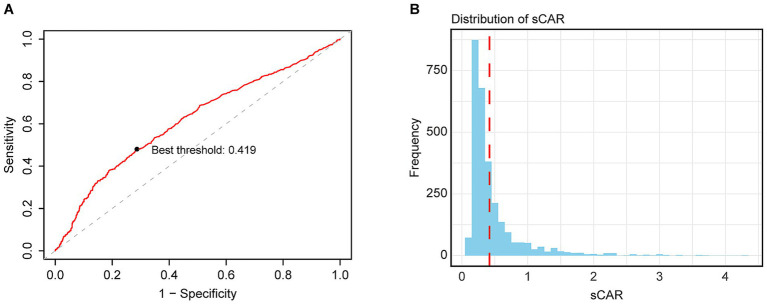 Figure 2
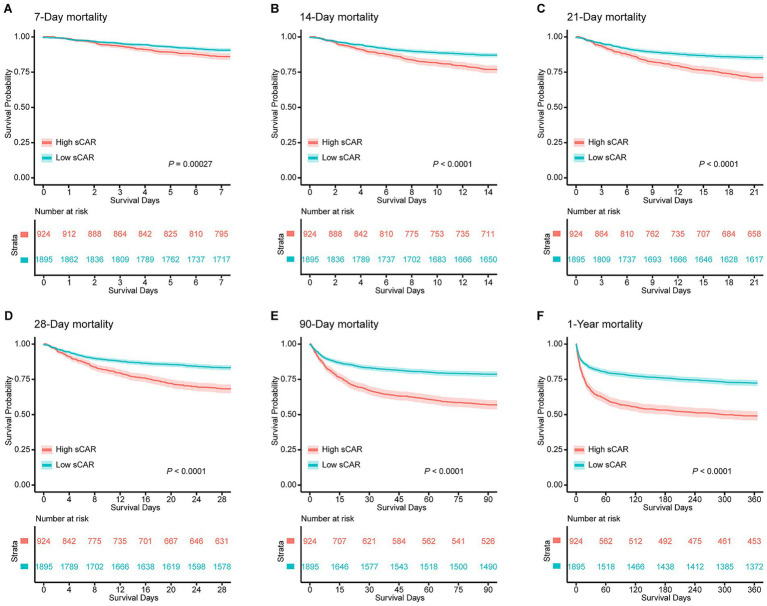 Figure 3
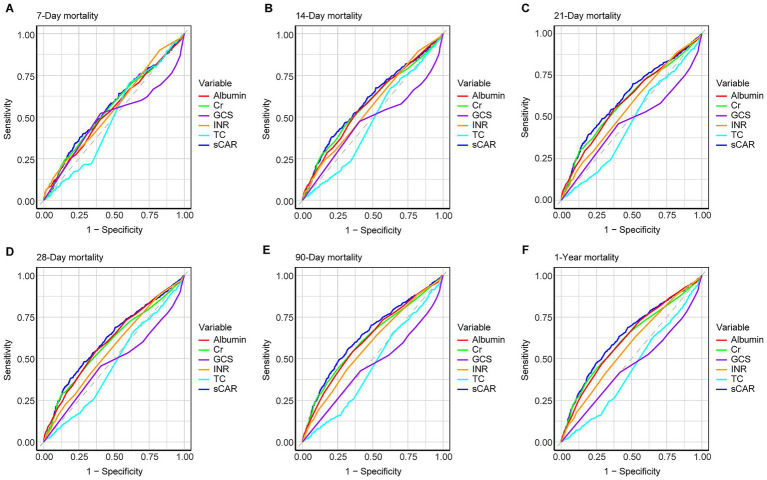 Figure 4
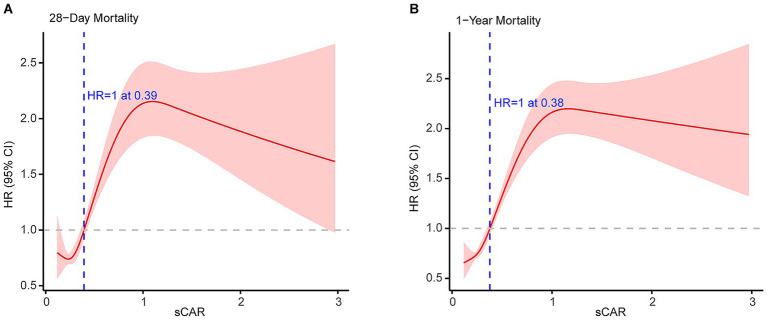 Figure 5
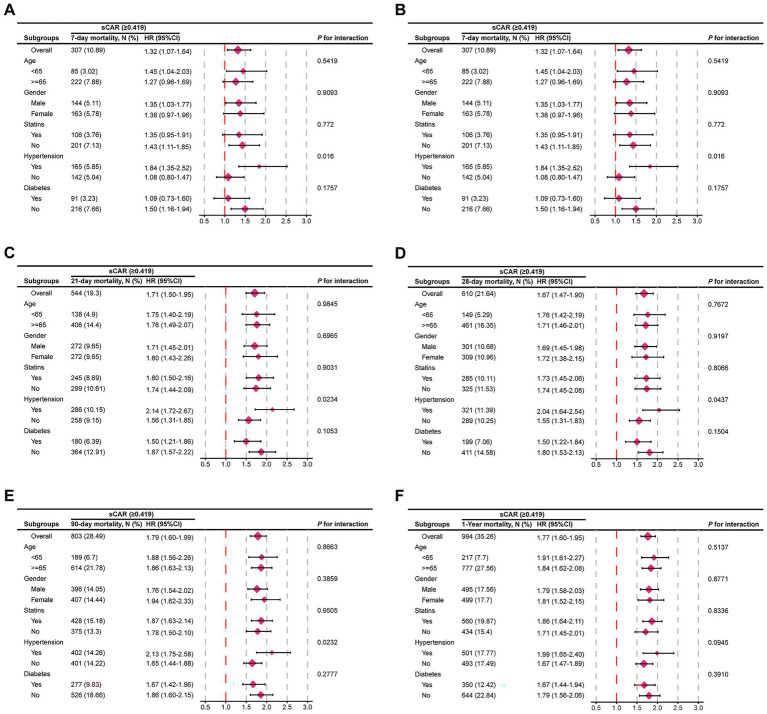 Figure 6
| Variables | Total | sCAR |
| |
|---|---|---|---|---|
| < 0.419 | ≥ 0.419 | |||
| ( | ( | ( | ||
| Demographics | ||||
| Age | 71 (58–81) | 71(57–80) | 72 (59–82) | 0.025 |
| Gender | <0.001 | |||
| F | 1,377 (48.85) | 1,010 (53.3) | 367 (39.72) | |
| M | 1,442 (51.15) | 885 (46.7) | 557 (60.28) | |
| Race | 0.003 | |||
| Asian | 73 (2.59) | 55 (2.9) | 18 (1.95) | |
| White | 1746 (61.94) | 1,180 (62.27) | 566 (61.26) | |
| Black | 265 (9.40) | 153 (8.07) | 112 (12.12) | |
| Other/unknown | 735 (26.07) | 507 (26.75) | 228 (24.68) | |
| Vital signs | ||||
| Heart rate | 82 (71–95) | 80.00 (70.00–92.00) | 86.00 (74.00–101.00) | <0.001 |
| Respiratory rate | 19 (15–22) | 18.00 (15.00–22.00) | 19.00 (16.00–24.00) | <0.001 |
| SBP | 131 (114–149) | 133 (117–150) | 127 (110–145) | <0.001 |
| DBP | 67 (57–80) | 70 (58–82) | 63.00 (54–76) | <0.001 |
| Temperature | 36.83 (36.50–37.22) | 36.83 (36.50–37.19) | 36.83 (36.44–37.30) | 0.468 |
| SpO2 | 98 (96–100) | 98 (96–100) | 98 (95–100) | 0.008 |
| Comorbidities | ||||
| COPD | 539 (19.12) | 318 (16.78) | 221 (23.92) | <0.001 |
| Sepsis | 362 (12.84) | 111 (5.86) | 251 (27.16) | <0.001 |
| HF | 710 (25.19) | 319 (16.83) | 391 (42.32) | <0.001 |
| AF | 472 (16.74) | 298 (15.73) | 174 (18.83) | 0.043 |
| Hypertension | 1,534 (54.42) | 1,202 (63.43) | 332 (35.93) | <0.001 |
| Diabetes | 853 (30.26) | 478 (25.22) | 375 (40.58) | <0.001 |
| Clinical treatment | ||||
| Vasopressin | 217 (7.7) | 69 (3.64) | 148 (16.02) | <0.001 |
| Statins | 1789 (63.46) | 1,160 (61.21) | 629 (68.07) | <0.001 |
| Beta blockers | 2,188 (77.62) | 1,419 (74.88) | 769 (83.23) | <0.001 |
| MV | 1,278 (45.34) | 758 (40) | 520 (56.28) | <0.001 |
| CRRT | 67 (2.38) | 1 (0.05) | 66 (7.14) | <0.001 |
| ACEI | 946 (33.56) | 643 (33.93) | 303 (32.79) | 0.576 |
| Clinical index | ||||
| GCS | 14 (11–15) | 14 (11–15) | 14 (11.75–15) | <0.001 |
| SOFA | 3 (2–6) | 3 (1.5–4) | 5 (3–9) | <0.001 |
| SIRS | 3 (2–3) | 2 (2–3) | 3 (2–3) | <0.001 |
| OASIS | 33 (27–38) | 31 (26–36) | 35 (29–41) | <0.001 |
| Laboratory indicators | ||||
| WBC | 9.90 (7.50–13.10) | 9.50 (7.40–12.30) | 11.00 (8.00–14.83) | <0.001 |
| RBC | 3.58 (3.10–4.16) | 3.80 (3.31–4.29) | 3.22 (2.82–3.72) | <0.001 |
| Hb | 10.70 (9.20–12.30) | 11.40 (9.90–12.80) | 9.40 (8.30–11.00) | <0.001 |
| PLT | 222 (166–302) | 226 (176–299) | 209 (140.75–308.00) | <0.001 |
| RDW | 14.30 (13.30–15.60) | 13.90 (13.20–15.10) | 15.10 (14.10–16.80) | <0.001 |
| Neutrophil counts | 13.79 (7.57–25.87) | 12.75 (7.30–25.87) | 15.60 (8.74–25.87) | <0.001 |
| Lymphocyte counts | 1.96 (0.96–4.45) | 2.01 (0.99–4.45) | 1.84 (0.92–4.45) | 0.152 |
| Eosinophil counts | 0.14 (0.03–0.48) | 0.14 (0.04–0.48) | 0.14 (0.02–0.48) | 0.459 |
| BUN | 19.00 (13.00–29.00) | 16.00 (12.00–21.00) | 31.00 (22.00–49.00) | <0.001 |
| eGFR | 10.00 (7.00–14.00) | 8.00 (7.00–11.00) | 15.00 (11.00–19.00) | <0.001 |
| ALT | 26.00 (16.00–69.00) | 24.00 (15.00–57.00) | 33.00 (17.00–76.94) | <0.001 |
| AST | 33.00 (21.00–77.00) | 29.00 (20.00–60.00) | 45.00 (25.00–103.53) | <0.001 |
| TB | 0.60 (0.40–0.90) | 0.60 (0.40–0.90) | 0.65 (0.40–0.90) | 0.009 |
| Na | 140.00 (137.00–143.00) | 140.00 (137.00–143.00) | 140.00 (137.00–144.00) | 0.013 |
| K | 4.00 (3.70–4.30) | 3.90 (3.60–4.30) | 4.10 (3.70–4.50) | <0.001 |
| Cl | 104.00 (100–107) | 104.00 (100–107) | 105 (100–109) | <0.001 |
| AG | 14.00 (12.00–16.00) | 14.00 (12.00–16.00) | 14.00 (12.00–17.00) | <0.001 |
| TC | 163.50 (141.00–180.00) | 163.50 (146.00–186.00) | 163.50 (131.75–166.00) | <0.001 |
| TG | 149.00 (93.05–162.24) | 138.00 (88.00–162.24) | 162.24 (113.75–162.24) | <0.001 |
| HDL-C | 44.57 (39.00–52.00) | 44.57 (41.00–55.00) | 44.57 (35.00–46.00) | <0.001 |
| LDL-C | 90.30 (74.00–103.00) | 90.30 (76.00–107.00) | 90.30 (67.00–97.00) | <0.001 |
| PT | 13.00 (11.90–14.70) | 12.80 (11.80–14.00) | 13.90 (12.40–16.20) | <0.001 |
| INR | 1.20 (1.10–1.30) | 1.20 (1.10–1.30) | 1.20 (1.10–1.50) | <0.001 |
| APTT | 29.60 (26.60–37.10) | 29.10 (26.30–34.50) | 31.25 (27.00–46.60) | <0.001 |
| Glucose | 129 (105.50–165) | 126 (103.00–158.00) | 136 (110–179) | <0.001 |
| Lactate | 1.00 (0.80–1.30) | 0.90 (0.70–1.00) | 1.50 (1.18–2.10) | <0.001 |
| Cr | 1.10 (0.90–1.70) | 0.90 (0.80–1.10) | 2.10 (1.60–3.20) | <0.001 |
| Alb | 3.60 (3.20–4.00) | 3.70 (3.40–4.10) | 3.20 (2.80–3.60) | <0.001 |
| sCAR | 0.31 (0.23–0.50) | 0.26 (0.21–0.31) | 0.65 (0.51–1.03) | <0.001 |
| Clinical Outcomes | ||||
| LOS ICU | 3.99 (2.14–8.30) | 3.56 (1.97–7.39) | 5.20 (2.81–10.89) | <0.001 |
| LOS hospital | 11.82 (6.24–21.08) | 9.97 (5.56–17.63) | 16.80 (8.80–26.85) | <0.001 |
| ICU mortality | 339 (12.03) | 154 (8.13) | 185 (20.02) | <0.001 |
| In-hospital mortality | 509 (18.06) | 235 (12.4) | 274 (29.65) | <0.001 |
| 7-day mortality | 307 (10.89) | 178 (9.39) | 129 (13.96) | <0.001 |
| 14-day mortality | 458 (16.25) | 245 (12.93) | 213 (23.05) | <0.001 |
| 21-day mortality | 544 (19.3) | 278 (14.67) | 266 (28.79) | <0.001 |
| 28-day mortality | 610 (21.64) | 317 (16.73) | 293 (31.71) | <0.001 |
| 90-day mortality | 803 (28.49) | 405 (21.37) | 398 (43.07) | <0.001 |
| 1-year mortality | 994 (35.26) | 523 (27.6) | 471 (50.97) | <0.001 |
| sCAR | Group | 7-d HR (95% CI) | 14-d HR (95% CI) | 21-d HR (95% CI) | 28-d HR (95% CI) | 90-d HR (95% CI) | 1-y HR (95% CI) |
|---|---|---|---|---|---|---|---|
| Unadjusted | sCAR < 0.419 | 1 | 1 | 1 | 1 | 1 | 1 |
| sCAR ≥ 0.419 | 3.98 (2.14–7.41) | 3.78 (2.42–5.91) | 3.56 (2.21–5.68) | 3.22 (2.01–5.15) | 2.84 (1.89–4.26) | 2.56 (1.78–3.69) | |
|
| 0.001 | <0.001 | <0.001 | <0.001 | <0.001 | <0.001 | |
| Model 1 | sCAR < 0.419 | 1 | 1 | 1 | 1 | 1 | 1 |
| sCAR ≥ 0.419 | 3.45 (1.91–6.58) | 3.12 (1.87–5.23) | 3.01 (1.68–4.98) | 2.89 (1.65–4.54) | 2.56 (1.62–4.05) | 2.41 (1.62–3.48) | |
|
| 0.002 | <0.001 | <0.001 | <0.001 | <0.001 | <0.001 | |
| Model 2 | sCAR < 0.419 | 1 | 1 | 1 | 1 | 1 | 1 |
| sCAR ≥ 0.419 | 3.23 (1.80–6.13) | 2.96 (1.77–4.96) | 2.89 (1.61–4.89) | 2.73 (1.55–4.23) | 2.45 (1.51–3.97) | 2.29 (1.53–3.32) | |
|
| 0.004 | <0.001 | <0.001 | <0.001 | <0.001 | <0.001 |
| Time Point | Variable | AUC | 95% CI | Threshold | Sensitivity | Specificity |
|---|---|---|---|---|---|---|
| 7-Day mortality | sCAR | 0.561 | 0.526–0.596 | 0.323 | 0.570 | 0.535 |
| Cr | 0.553 | 0.518–0.588 | 1.150 | 0.554 | 0.537 | |
| Alb | 0.540 | 0.505–0.575 | 3.450 | 0.485 | 0.597 | |
| TC | 0.494 | 0.463–0.525 | 163.305 | 0.697 | 0.396 | |
| INR | 0.551 | 0.517–0.585 | 1.150 | 0.603 | 0.440 | |
| GCS | 0.491 | 0.452–0.530 | 14.500 | 0.521 | 0.596 | |
| 14-Day mortality | sCAR | 0.598 | 0.569–0.628 | 0.315 | 0.620 | 0.535 |
| Cr | 0.582 | 0.552–0.612 | 1.250 | 0.517 | 0.617 | |
| Alb | 0.582 | 0.553–0.611 | 3.450 | 0.531 | 0.611 | |
| TC | 0.475 | 0.448–0.502 | 163.305 | 0.648 | 0.392 | |
| INR | 0.562 | 0.533–0.590 | 1.150 | 0.627 | 0.448 | |
| GCS | 0.470 | 0.438–0.501 | 14.500 | 0.474 | 0.594 | |
| 21-Day Mortality | sCAR | 0.621 | 0.594–0.649 | 0.378 | 0.542 | 0.648 |
| Cr | 0.600 | 0.572–0.628 | 1.150 | 0.596 | 0.557 | |
| Alb | 0.600 | 0.572–0.627 | 3.450 | 0.551 | 0.622 | |
| TC | 0.466 | 0.441–0.492 | 160.190 | 0.658 | 0.377 | |
| INR | 0.562 | 0.536–0.588 | 1.150 | 0.632 | 0.452 | |
| GCS | 0.466 | 0.437–0.495 | 14.500 | 0.460 | 0.593 | |
| 28-Day mortality | sCAR | 0.618 | 0.592–0.644 | 0.343 | 0.575 | 0.603 |
| Cr | 0.593 | 0.566–0.619 | 1.250 | 0.521 | 0.627 | |
| Alb | 0.606 | 0.580–0.632 | 3.450 | 0.549 | 0.626 | |
| TC | 0.467 | 0.443–0.492 | 160.190 | 0.648 | 0.375 | |
| INR | 0.559 | 0.534–0.585 | 1.150 | 0.626 | 0.453 | |
| GCS | 0.472 | 0.445–0.499 | 14.500 | 0.456 | 0.593 | |
| 90-Day mortality | sCAR | 0.643 | 0.620–0.666 | 0.371 | 0.565 | 0.668 |
| Cr | 0.618 | 0.594–0.642 | 1.150 | 0.603 | 0.579 | |
| Alb | 0.616 | 0.592–0.639 | 3.450 | 0.544 | 0.641 | |
| TC | 0.459 | 0.436–0.482 | 160.190 | 0.636 | 0.373 | |
| INR | 0.580 | 0.557–0.603 | 1.150 | 0.645 | 0.468 | |
| GCS | 0.455 | 0.431–0.479 | 14.500 | 0.427 | 0.587 | |
| 1-Year mortality | sCAR | 0.639 | 0.617–0.661 | 0.315 | 0.634 | 0.588 |
| Cr | 0.615 | 0.592–0.637 | 1.150 | 0.589 | 0.591 | |
| Alb | 0.619 | 0.597–0.641 | 3.550 | 0.592 | 0.583 | |
| TC | 0.442 | 0.420–0.463 | 160.190 | 0.616 | 0.363 | |
| INR | 0.573 | 0.551–0.594 | 1.150 | 0.632 | 0.472 | |
| GCS | 0.453 | 0.431–0.475 | 14.500 | 0.418 | 0.583 |
Peer Reviews
No public reviews on file for this paper yet. If you reviewed it on a platform where reviews are public (OpenReview, ICLR, NeurIPS, ICML), you can paste yours below so the community can read it here.
Videos
No videos yet. Explain this paper in a talk, walkthrough, or lecture? Add one.
Taxonomy
TopicsAcute Ischemic Stroke Management · Venous Thromboembolism Diagnosis and Management · Acute Kidney Injury Research
Introduction
1
Stroke is a leading cause of global death and disability, with the Global Burden of Disease Study 2019 identifying it as the second most frequent cause of mortality worldwide (1). Ischemic stroke, constituting approximately 62% of all stroke cases, results from cerebral vessel occlusion, while hemorrhagic stroke arises from vessel rupture and intracerebral hemorrhage (2). Both subtypes can lead to severe complications, including altered consciousness, heightened intracranial pressure, and potentially, multi-organ failure, necessitating intensive monitoring and treatment in the ICU (3).
Reperfusion therapies, such as thrombolysis and thrombectomy, have improved outcomes in acute ischemic stroke (4). However, delayed hospital presentation and limited access to care, especially in low- and middle-income countries (LMICs), hinder timely treatment (5). With the global stroke burden projected to increase disproportionately in LMICs by 2050 (6), simple and reliable risk assessment tools are urgently needed to guide the management of stroke patients without reperfusion therapy.
Serum creatinine (sCr) and albumin (Alb) are staples in the clinical biochemical assessment toolkit. Creatinine levels are a barometer of renal function, while albumin is pivotal in sustaining plasma colloid osmotic pressure and boasts anti-inflammatory, antioxidant, and antithrombotic capabilities (7, 8). Empirical evidence from prior studies has indicated that elevated creatinine or diminished albumin levels are individually linked to an unfavorable prognosis in stroke patients (9, 10). However, the prognostic value of a solitary biomarker is inherently limited; thus, the amalgamation of multiple indicators may bolster prognostic precision.
The serum creatinine-to-albumin ratio (sCAR) has recently emerged as a novel biomarker, reflecting both renal function and nutritional status. Its prognostic value has been demonstrated in various clinical contexts, including acute kidney injury and cardiovascular diseases (11). However, the association between sCAR and short- and long-term all-cause mortality in stroke patients remains unclear. Notably, the majority of prior studies have focused on either ischemic or hemorrhagic stroke, with limited research examining the prognostic utility of sCAR across both subtypes. Given the distinct pathophysiological mechanisms underlying ischemic and hemorrhagic strokes, it is crucial to explore whether sCAR can serve as a unified prognostic indicator for stroke patients admitted to the ICU.
Our study aimed to elucidate the association between sCAR and all-cause mortality at different time points (7-day, 14-day, 21-day, 28-day, 90-day and 1-year) in stroke patients admitted to the ICU. We harness data from the Medical Information Mart for Intensive Care IV (MIMIC-IV, v2.2) database, spanning from 2008 to 2019. By delving into sCAR as a prospective prognostic indicator, our ambition is to shed new light on clinical risk assessment, thereby augmenting the management paradigm for stroke patients.
Methods
2
Data source
2.1
This study used data from the MIMIC-IV (v2.2) database, a publicly available critical care dataset containing de-identified information from ICU admissions at the Beth Israel Deaconess Medical Center (2008–2019). The database includes demographics, vital signs, laboratory results, treatments, and outcomes. Ethical approval and informed consent were waived as all data were de-identified. Access to the database was authorized after completing the required training on data usage. As described in our previous research (12), the primary investigator, Li Zou (ID: 13349610), authorized to access and extract data from the database was subsequently granted to our research team.
Study population
2.2
For this study, stroke patients were identified using International Classification of Diseases (ICD)-9/10 codes for ischemic (ICD-9: 433–437; ICD-10: I63–I67) and hemorrhagic stroke (ICD-9: 430–432; ICD-10: I60–I62). Inclusion criteria were adult (≥18 years) first-time ICU admissions with sCr and Alb levels measured within 24 h. Exclusion criteria included end-stage renal disease, malignancy, chronic liver disease, missing survival data, or ICU stays <24 h. A total of 2,819 eligible patients were included (Figure 1).
A flowchart for the patient selection process.
Data extraction
2.3
The sCAR was the primary study variable. sCr and Alb levels were measured within 24 h of ICU admission to minimize treatment-related biases. Data were extracted using Structured Query Language (SQL) with PostgreSQL. Extracted variables included demographic information, comorbidities, vital signs, laboratory results, clinical scores [e.g., Sequential Organ Failure Assessment (SOFA)], treatments (e.g., statins), and outcomes. Covariates adjusted for in multivariable Cox regression, including vasopressor drugs and beta blockers, were also extracted and included in the analysis. Supplementary Table 1 summarizes the extracted variables.
Endpoint events
2.4
Primary endpoints were all-cause mortality at 7-d, 14-d, 21-d, 28-d, 90-d, and 1-y. Secondary endpoints included ICU length of stay, hospital length of stay, and in-hospital mortality.
Statistical analysis
2.5
Continuous variables were summarized as mean ± standard deviation (SD) or median (IQR), depending on their distribution, which was assessed using normality tests (Supplementary Table 2). Categorical variables were summarized as counts and percentages. Group comparisons were conducted using t-tests or ANOVA for normally distributed continuous variables and non-parametric tests for non-normally distributed variables, as well as χ^2^ or Fisher’s exact tests for categorical variables. The treatment of missing data was described as follows: Missing laboratory indicators were imputed using the mean value of the respective variable for the study population. The rate of missing laboratory indicators was less than 5% for all variables included in the analysis. The optimal sCAR cutoff for predicting 28-day mortality was determined using the Youden index. Patients were stratified into low- and high-sCAR groups based on this cutoff. The optimal sCAR cutoff for 28-day mortality was determined using the Youden index. Patients were stratified into low- and high-sCAR groups. Cox proportional hazards models assessed the association between sCAR and mortality, reporting hazard ratios (HRs) and 95% confidence intervals (CIs). Kaplan–Meier curves with log-rank tests compared survival between sCAR groups. ROC analysis evaluated sCAR, sCr, and Alb, reporting sensitivity, specificity, and AUC values. Figures and ROC visualization were added to enhance transparency. Subgroup analyses examined interactions with age, sex, statin use, hypertension, and sepsis. The assumptions for these subgroup analyses were predefined based on clinical relevance and prior evidence suggesting potential interactions. Specifically, we hypothesized that hypertension might modify the predictive ability of sCAR due to its impact on cardiovascular outcomes. Similarly, age, sex, statin use, and sepsis were chosen as they are known to influence stroke prognosis and overall mortality. Figures and ROC visualization were added to enhance transparency. Analyses were conducted using R (v4.2.2).
Results
3
Baseline demographic and clinical characteristics
3.1
This study included 2,819 ICU-admitted stroke patients (Figure 1), with 51.15% male and 48.85% female. Based on the Youden index, the optimal sCAR cutoff for 28-day mortality was determined to be 0.419 (Figure 2). Patients were stratified into low (<0.419; n = 1,895, 67.19%) and high (≥0.419; n = 924, 32.81%) sCAR groups.
Optimal cutoff point selection: Maximizing risk ratio (A) and sCAR ≥ 0.419 distribution (B).
Patients in the high sCAR group were older (median age: 72 vs. 70 years, p = 0.025), had a higher proportion of males (60.28% vs. 46.70%, p < 0.001), and more Black patients (12.12% vs. 8.07%, p = 0.003). They also exhibited higher median heart (86 vs. 80 bpm, p < 0.001) and respiratory rates (19 vs. 18 breaths/min, p < 0.001), but lower systolic (127 vs. 133 mmHg, p < 0.001) and diastolic blood pressures (63 vs. 70 mmHg, p < 0.001).
The high sCAR group had higher rates of severe comorbidities, including COPD (23.92% vs. 16.78%, p < 0.001), sepsis (27.16% vs. 5.86%, p < 0.001), and heart failure (42.32% vs. 16.83%, p < 0.001). Clinical scores, such as SOFA (5 vs. 3, p < 0.001) and the Oxford Acute Severity of Illness Score (OASIS) (35 vs. 31, p < 0.001), were significantly worse.
Laboratory markers reflected a more critical state, with higher lactate (1.50 vs. 0.90 mmol/L, p < 0.001) and BUN (31 vs. 16 mg/dL, p < 0.001), but lower hemoglobin (9.4 vs. 11.4 g/dL, p < 0.001) and albumin (3.2 vs. 3.7 g/dL, p < 0.001).
The high sCAR group experienced significantly worse outcomes, including higher ICU (20.02% vs. 8.13%, p < 0.001), in-hospital (29.65% vs. 12.40%, p < 0.001), 28-day (31.71% vs. 16.73%, p < 0.001), and 1-year mortality (50.97% vs. 27.60%, p < 0.001). These findings underscore the discriminative power of sCAR stratification for severity and prognosis (Table 1).
Univariate and multivariate cox regression models of sCAR and mortality
3.2
Cox regression analyses revealed that elevated sCAR (≥0.419) was consistently associated with significantly increased mortality risk across all time points.
In univariate models, high sCAR was linked to higher mortality at 7-day (HR: 2.34, 95% CI: 1.90–2.89), 14-day (HR: 2.52, 95% CI: 2.08–3.06), 21-day (HR: 2.64, 95% CI: 2.22–3.14), 28-day (HR: 2.78, 95% CI: 2.36–3.28), 90-day (HR: 2.95, 95% CI: 2.55–3.42), and 1-year (HR: 3.15, 95% CI: 2.73–3.63; all p < 0.001). In multivariate Model 1 (adjusted for age and sex), sCAR remained a robust mortality predictor at all time points (e.g., 28-day HR: 2.68, 95% CI: 2.28–3.14; p < 0.001). Model 2, further adjusted for confounders such as vasopressin, beta-blockers, and hematologic parameters, confirmed the independent predictive value of sCAR across all endpoints. Detailed results are presented in Table 2.
Kaplan–Meier curve analysis
3.3
Kaplan–Meier survival curves demonstrated that patients in the high sCAR group had significantly higher mortality at all assessed time points compared to those in the low sCAR group. Specifically, the cumulative mortality rates in the high sCAR group versus the low sCAR group were 6.1% vs. 1.6% at 7-day (p = 0.002), 12.1% vs. 3.7% at 14-day (p < 0.001), 15.9% vs. 4.5% at 21-day (p < 0.001), 18.2% vs. 5.0% at 28-day (p < 0.001), 27.8% vs. 10.2% at 90-day (p < 0.001), and 33.3% vs. 14.3% at 1-year (p < 0.001). These results highlight the consistent and robust association between elevated sCAR levels and poorer long-term survival outcomes (Figure 3).
Kaplan–Meier survival analysis curves for all-cause mortality in patients with stroke at 7-d (A), 14-d (B), 21-d (C), 28-d (D), 90-d (E), and 1-y (F) of hospital admission.
ROC and RCS curve analysis
3.4
ROC analysis assessed the predictive performance of sCAR and other variables (e.g., creatinine, albumin, TC, INR, and GCS) across multiple mortality endpoints (7-day, 14-day, 21-day, 28-day, 90-day, and 1-year). For 28-day mortality, sCAR demonstrated an AUC of 0.618 (95% CI: 0.592–0.644) with a threshold of 0.343 (sensitivity: 57.5%, specificity: 60.3%), while for 1-year mortality, it achieved an AUC of 0.639 (95% CI: 0.617–0.661) with a threshold of 0.315 (sensitivity: 63.4%, specificity: 58.8%). Other variables, such as TC and GCS, had lower AUCs (<0.47 across endpoints). Figure 4 and Table 3 summarize these findings.
ROC curves for predicting all-cause mortality in patients with stroke at 7-d (A), 14-d (B), 21-d (C), 28-d (D), 90-d (E), and 1-y (F) after admission.
RCS curve analysis further revealed a non-linear association between sCAR and mortality risk (Figure 5). For 28-day mortality, the HR increased sharply beyond a threshold of approximately 0.34, indicating an elevated short-term mortality risk for patients with higher sCAR levels. For 1-year mortality, the HR initially decreased at lower sCAR levels but increased substantially as sCAR continued to rise, with a turning point where HR equals 1 at approximately 0.32. These findings underscore the robust and consistent predictive power of sCAR across both short-term and long-term outcomes.
Restricted cubic spline analyses of sCAR for 28-d mortality (A) and 1-y mortality (B).
Subgroup analysis of sCAR and mortality
3.5
Figure 6 illustrates the relationship between sCAR and mortality at 7-day, 14-day, 21-day, 28-day, 90-day, and 1-year endpoints across different patient subgroups. Stratified analyses were conducted for age, sex, statin use, hypertension, and diabetes. Most subgroup analyses revealed no significant interaction between sCAR and these factors (p > 0.05). However, a significant interaction was observed for hypertension status at the 7-day, 21-day, 28-day, and 90-day endpoints (P for interaction = 0.016, 0.023, 0.016, and 0.023, respectively), suggesting that the predictive ability of sCAR may vary based on hypertension status. These findings underscore the potential modifying effect of comorbid hypertension on the prognostic value of sCAR.
Forest plots of subgroup analysis of the relationship between all-cause mortality and sCAR in patients with stroke admitted 7-d (A), 14-d (B), 21-d(C), 28-d (D), 90-d (E), and 1-y (F).
Discussion
4
In recent years, several studies have explored the role of serum biomarkers, such as the neutrophil-to-lymphocyte ratio (NLR), mean platelets volume (MPV) and the red blood cell distribution width-to-platelet ratio (RPR), in predicting the prognosis of patients with stroke (13–16). However, no study has explored the predictive value of the sCAR in the prognosis of ICU stroke patients. Our study was based on the hypothesis that sCAR, as a composite biomarker reflecting both renal function and nutritional/inflammatory status, would provide a more comprehensive prognostic assessment in critically ill stroke patients compared to individual markers such as creatinine or albumin alone. We provide novel evidence that the sCAR is a robust prognostic marker for predicting both short- and long-term all-cause mortality in critically ill stroke patients admitted to the ICU. Elevated sCAR levels were consistently associated with increased mortality risk at multiple time points, including 7-day, 14-day, 21-day, 28-day, 90-day, and 1-year endpoints. The Kaplan–Meier survival analyses further demonstrated the stark contrast in survival between patients with high versus low sCAR values, underscoring the potential of sCAR as a clinically informative indicator.
Elevated serum creatinine is a well-established indicator of renal dysfunction and is consistently linked to poor outcomes in critically ill stroke patients. Even subtle increases in creatinine within the normal range can elevate stroke risk and overall mortality, independent of traditional vascular risk factors (17, 18). Mechanistically, ischemia–reperfusion injury following a stroke can compromise renal perfusion and precipitate acute kidney injury, contributing to creatinine elevations (19). Systemic inflammation triggered by the stroke may induce endothelial dysfunction and tubular damage, further impairing renal function (20, 21). Oxidative stress, common in ischemic events, can exacerbate renal injury and raise creatinine concentrations (21). In addition, exposure to nephrotoxic agents—such as contrast media and certain antibiotics—can directly harm the kidneys (22, 23). These multifactorial influences, alongside fluid imbalances and metabolic derangements, worsen prognosis by increasing the risk of thrombotic events and functional decline (24–26).
Albumin (Alb), the most abundant plasma protein synthesized by the liver, plays a pivotal role in maintaining plasma oncotic pressure and regulating fluid distribution between compartments (27). As a negative acute-phase reactant, serum Alb levels decrease in response to systemic inflammation, and hypoalbuminemia (commonly defined as <3.5 g/dL) has emerged as a significant prognostic marker in a variety of conditions, including stroke (8, 28, 29). Beyond its structural and transport functions, Alb displays antioxidant, anti-inflammatory, and antithrombotic properties, contributes to endothelial integrity, and modulates platelet activation and aggregation (30–32). In ischemic stroke, low Alb levels have been linked to increased short-term and long-term mortality, as well as poor functional recovery (29). This relationship may be explained by albumin’s role in countering oxidative stress, mitigating endothelial dysfunction, and reducing vascular permeability—key mechanisms that, when compromised, can exacerbate edema, neuronal injury, and overall disease severity (33, 34). Alb serves as an important prognostic indicator, however, it is influenced by factors such as nutritional status, hepatic function, and systemic disease burden, limiting its specificity in stroke prediction (33).
Despite their individual prognostic relevance, relying on creatinine or Alb alone may be insufficient due to the multifactorial nature of critical illnesses. The sCAR metric combines creatinine and Alb into a single measure, potentially offering a more comprehensive reflection of renal, nutritional, and systemic health. By integrating two complementary biomarkers, sCAR demonstrates greater specificity and predictive power for risk stratification compared to either variable alone. This study supports sCAR as a valuable tool for assessing mortality risk in critically ill stroke patients.
Our findings underscore the clinical utility of sCAR as a robust biomarker for predicting short- and long-term mortality in ICU-admitted ischemic stroke patients. Unlike individual markers like creatinine or Alb, sCAR integrates renal function and nutritional/inflammatory status, providing a more comprehensive physiological assessment. Its superior prognostic accuracy, compared to traditional scoring systems like SOFA or GCS, reflects its ability to capture the complex interplay of neurovascular, metabolic, and inflammatory factors in critical illness (35, 36). However, the reported AUC values for sCAR (0.618–0.639) hold practical significance in clinical practice, as they outperform traditional markers and provide a more nuanced understanding of patient risk. RCS analyses further highlight sCAR’s predictive power, identifying thresholds beyond which mortality risk escalates. Such insights enable precise risk stratification and early interventions, including optimized fluid management, nutritional support, and vigilant monitoring for renal or inflammatory complications, aligning with evidence that early metabolic optimization improves outcomes (37–39).
Additionally, Subgroup analyses confirmed sCAR’s prognostic value across various subgroups, including those stratified by age, sex, statin use, hypertension, and diabetes. Hypertension significantly modified sCAR’s predictive capacity at several time points, with heightened risk observed in hypertensive patients. These findings highlight the potential for sCAR to guide personalized therapeutic strategies in neurocritical care (40, 41). Interestingly, our findings indicated a higher HR for sCAR in non-diabetic patients compared to diabetic patients, despite diabetic patients having a higher overall mortality rate (41.03% vs. 32.76%). This paradoxical observation likely reflects differences in baseline hazard between the two groups: diabetic patients inherently exhibit a higher baseline mortality risk, potentially attenuating the relative impact of sCAR. In contrast, non-diabetic patients, with lower baseline risk, experienced a more pronounced effect of sCAR on mortality. Importantly, interaction analysis revealed no significant modifying effect of diabetes on the relationship between sCAR and mortality (P for interaction = 0.3898), supporting the consistency of sCAR’s prognostic value across diabetes subgroups. These results underscore the importance of considering baseline risk in interpreting HRs and provide further insight into sCAR’s nuanced role in stroke prognosis.
Fluid management is crucial in stroke patients, especially when addressing dehydration and its associated risks. While dehydration therapies, such as mannitol or diuretics, are commonly employed to reduce cerebral edema and intracranial pressure, they may exacerbate renal dysfunction, particularly in patients with elevated sCAR, indicating compromised renal function and nutritional status (42, 43). Proper fluid management strategies, including close monitoring of renal function and individualized hydration plans, are essential to mitigate these risks and optimize outcomes.
Alb plays a vital role in fluid management for stroke patients, especially those with hypoalbuminemia. Its colloid properties enhance oncotic pressure, restore circulating volume, and provide antioxidant and anti-inflammatory benefits, potentially reducing tissue injury, cerebral edema, and intracranial pressure (27, 44). While albumin administration may improve neurological outcomes in some cases, overuse risks fluid overload, necessitating individualized treatment plans (45, 46). In patients with elevated sCAR, optimizing fluid management to maintain renal perfusion and address hypoalbuminemia is critical. Future studies should explore the relationship between sCAR and fluid management strategies, as well as their effects on neurological and systemic outcomes.
This study’s strength lies in its use of the large and well-characterized MIMIC-IV database, which enhances the generalizability of our findings (47). Comprehensive analytical methods, including Cox regression, Kaplan–Meier analyses, and restricted cubic spline modeling, provide robust validation of sCAR’s prognostic value (48, 49). However, several limitations should be acknowledged. First, the retrospective, single-center design limits external validity, and evolving clinical practices over the study period may introduce heterogeneity (40).
The most significant limitation is the lack of stroke-specific data, an inherent constraint of the MIMIC-IV database. We were unable to account for crucial prognostic factors such as stroke severity (e.g., NIHSS scores), stroke subtype (ischemic vs. hemorrhagic), or detailed neuroimaging findings (50). This absence undoubtedly limits the internal validity of our results and their generalizability to all stroke populations. Consequently, our use of all-cause mortality, while an objective endpoint, precludes analysis of neurologic-specific outcomes such as functional recovery. Thus, the prognostic value of sCAR identified here should be interpreted as its association with overall physiological reserve and mortality risk in a general cohort of ICU-admitted stroke patients, rather than as a specific biomarker of neurologic injury severity.
Future studies are warranted to incorporate stroke severity scores and imaging data to provide a more nuanced understanding of sCAR’s predictive capacity and to determine if its utility varies across stroke subtypes. Prospective, multicenter cohorts are needed to validate sCAR and explore its correlation with functional outcomes. Furthermore, a detailed mechanistic explanation of how renal dysfunction and hypoalbuminemia synergistically influence stroke prognosis is crucial. Integrating sCAR with existing risk stratification tools may enhance its predictive capacity, ultimately guiding individualized management strategies for critically ill stroke patients.
Conclusion
5
The sCAR is a strong independent predictor of short- and long-term all-cause mortality in critically ill stroke patients. By integrating renal function and nutritional/inflammatory status, sCAR offers superior prognostic value compared to creatinine or albumin alone. These results highlight its potential to improve risk stratification and guide clinical decisions in the ICU. Prospective multicenter studies are warranted to confirm these findings and explore sCAR’s broader role in neurocritical care.
The reference list from the paper itself. Each links out to its DOI / PubMed record.
- 1Liu Y Wang W Huang X Zhang X Lin L Qin JJ. Global disease burden of stroke attributable to high fasting plasma glucose in 204 countries and territories from 1990 to 2019: an analysis of the global burden of disease study. J Diabetes. (2022) 14:495–513. doi: 10.1111/1753-0407.13299, PMID: 35924673 PMC 9426282 · doi ↗ · pubmed ↗
- 2GBD 2019 Stroke Collaborators. Global, regional, and national burden of stroke and its risk factors, 1990-2019: a systematic analysis for the global burden of disease study 2019. Lancet Neurol. (2021) 20:795–820. doi: 10.1016/S 1474-4422(21)00252-0, PMID: 34487721 PMC 8443449 · doi ↗ · pubmed ↗
- 3de Montmollin E Terzi N Dupuis C Garrouste-Orgeas Mda Silva D Darmon M. One-year survival in acute stroke patients requiring mechanical ventilation: a multicenter cohort study. Ann Intensive Care. (2020) 10:53. doi: 10.1186/s 13613-020-00669-5, PMID: 32383104 PMC 7205929 · doi ↗ · pubmed ↗
- 4Molina CA Saver JL. Extending reperfusion therapy for acute ischemic stroke: emerging pharmacological, mechanical, and imaging strategies. Stroke. (2005) 36:2311–20. doi: 10.1161/01.STR.0000182100.65262.46, PMID: 16179577 · doi ↗ · pubmed ↗
- 5Fiscella K Franks P Gold MR Clancy CM. Inequality in quality: addressing socioeconomic, racial, and ethnic disparities in health care. JAMA. (2000) 283:2579–84. doi: 10.1001/jama.283.19.2579, PMID: 10815125 · doi ↗ · pubmed ↗
- 6Cheng Y Lin Y Shi H Cheng M Zhang B Liu X. Projections of the stroke burden at the global, regional, and National Levels up to 2050 based on the global burden of disease study 2021. J Am Heart Assoc. (2024) 13:e 036142. doi: 10.1161/JAHA.124.036142, PMID: 39575720 PMC 11681572 · doi ↗ · pubmed ↗
- 7Kashani K Rosner MH Ostermann M. Creatinine: from physiology to clinical application. Eur J Intern Med. (2020) 72:9–14. doi: 10.1016/j.ejim.2019.10.025, PMID: 31708357 · doi ↗ · pubmed ↗
- 8Gremese E Bruno D Varriano V Perniola S Petricca L Ferraccioli G. Serum albumin levels: a biomarker to be repurposed in different disease settings in clinical practice. J Clin Med. (2023) 12:17. doi: 10.3390/jcm 12186017, PMID: 37762957 PMC 10532125 · doi ↗ · pubmed ↗