Three-Dimensional Volumetric Iodine Mapping of the Liver Segment Derived from Contrast-Enhanced Dual-Energy CT for the Assessment of Hepatic Cirrhosis
Yosuke Kawano, Masahiro Tanabe, Mayumi Higashi, Haruka Kiyoyama, Naohiko Kamamura, Jo Ishii, Haruki Furutani, Katsuyoshi Ito

TL;DR
This study uses 3D iodine mapping from CT scans to assess liver cirrhosis by comparing iodine concentration differences and extracellular volume in cirrhotic and non-cirrhotic patients.
Contribution
Introduces 3D volumetric iodine mapping from DECT to evaluate hepatic cirrhosis with segment-specific analysis.
Findings
Iodine concentration differences between PVP and EP were significantly smaller in cirrhotic patients.
ECV fraction in the left medial liver segment was higher in cirrhotic patients.
Reduced iodine concentration difference suggests portal flow reduction and fibrosis-related changes in cirrhosis.
Abstract
Objective: This study aimed to evaluate the hepatic volume, iodine concentration, and extracellular volume (ECV) of each hepatic segment in cirrhotic patients using three-dimensional (3D) volumetric iodine mapping of the liver segment derived from contrast-enhanced dual-energy CT (DECT) superimposed on extracted color-coded CT liver segments in comparison with non-cirrhotic patients. Methods: The study population consisted of 66 patients, 34 with cirrhosis and 32 without cirrhosis. Using 3D volumetric iodine mapping of the liver segment derived from contrast-enhanced DECT superimposed on extracted color-coded CT liver segments, the volume and iodine concentration of each hepatic segment in the portal venous phase (PVP) and equilibrium phase (EP), the difference in iodine concentration between PVP and EP (ICPVP-liver—ICEP-liver), and ECV fractions were compared between cirrhotic and…
Genes, proteins, chemicals, diseases, species, mutations and cell lines named across the full text — each resolved to its canonical identifier and authoritative record.
Click any figure to enlarge with its caption.
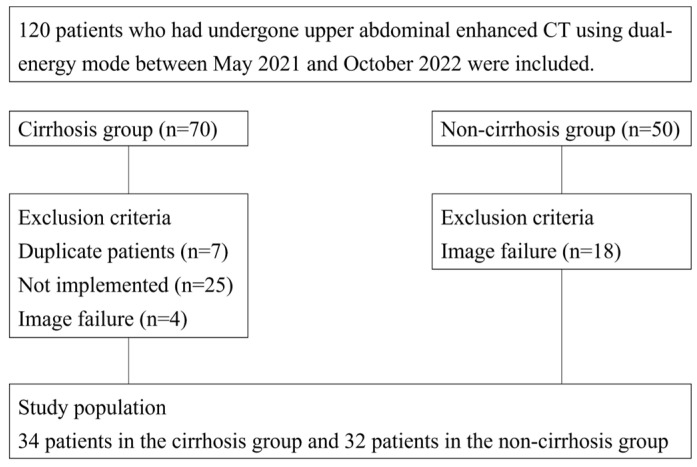 Figure 1
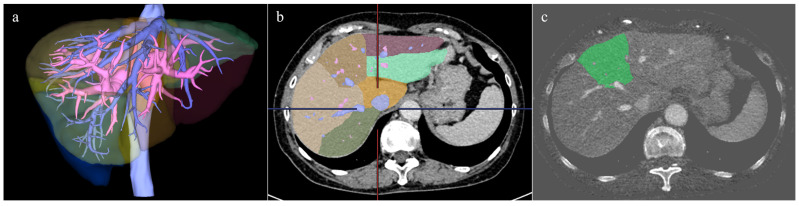 Figure 2
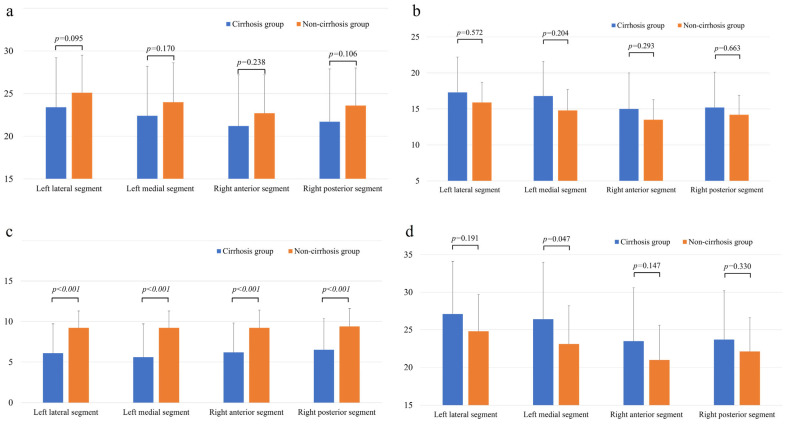 Figure 3
Peer Reviews
No public reviews on file for this paper yet. If you reviewed it on a platform where reviews are public (OpenReview, ICLR, NeurIPS, ICML), you can paste yours below so the community can read it here.
Videos
No videos yet. Explain this paper in a talk, walkthrough, or lecture? Add one.
Taxonomy
TopicsAdvanced X-ray and CT Imaging · Advanced X-ray Imaging Techniques · Hepatocellular Carcinoma Treatment and Prognosis
1. Introduction
Liver cirrhosis is a multifactorial condition, with a variety of etiologies including obesity, non-alcoholic fatty liver disease, heavy alcohol consumption, hepatitis B or C infection, autoimmune disease, cholestatic disease, and excessive iron and copper intake [1]. Chronic inflammation due to these etiologies results in fibrosis, as the liver parenchyma is replaced by stromal cells, such as activated astrocytes and myofibroblasts, leading to the deposition of extracellular matrix, mainly type I collagen [2]. Fibrosis is pathologically associated with microvascular short-circuiting and reduction in circulating blood volume in sinusoids. This is due to compression of portal vein branches by regenerative nodules, crushing, and dysfunction of the hepatic veins. It is also known to produce characteristic liver morphological changes in selective atrophy and compensatory enlargement in patients with cirrhosis. This phenomenon is believed to result from alterations in intrahepatic hemodynamics and fibrosis, influenced by a multitude of factors, including asymmetric anatomy of the left and right liver, central and peripheral zonal differentiation, portal perfusion, and hepatic venous drainage [3]. In a previous study, morphological changes in the liver associated with fibrosis were strongly correlated with portal vein hemodynamics, i.e., blood flow in the right branch of the portal vein tended to decrease, while that in the left branch of the portal vein increased [4].
Recent advancements have led to the development of fully automated three-dimensional (3D) volumetric computed tomography (CT) software programs [5] that generate 3D CT images of the entire liver and color-coded volumetric segmentation of each liver segment to quantitatively assess volumetric changes in the liver segment. In addition, the contrast-enhanced dual-energy CT (DECT) technique can accurately quantify the amount of iodine in the liver associated with hepatic blood flow because it illustrates the iodine distribution on an iodine map, which represents the amount of iodine per voxel [6,7]. Iodine maps are also used to measure extracellular volume (ECV) to grade liver fibrosis [6,8]. By superimposing the iodine map image with each color-coded liver segment on contrast-enhanced dynamic images, the mean iodine concentration (mgI/cm^3^) related to hepatic blood flow and ECV fraction of each liver segment can be measured on a volume basis, although such an assessment has not been reported in clinical studies.
The present study therefore evaluated the hepatic volume, iodine concentration, and ECV of each hepatic segment in cirrhotic patients using 3D volumetric iodine mapping of the liver segment derived from contrast-enhanced DECT superimposed on extracted color-coded CT liver segments in comparison with non-cirrhotic patients.
2. Materials and Methods
2.1. Study Population
This retrospective study received institutional review board approval, and the requirement for written informed consent was waived. Our radiology database was searched to recruit patients who underwent multiphasic contrast-enhanced dynamic CT of the abdomen using dual-energy mode between May 2021 and October 2022. The following patients were excluded: those missing iodine map images (n = 16), those in whom the portal vein was not recognized (n = 1), and those for whom image data were not retrieved (n = 1). Thus, the final study population included 66 patients (34 men, 32 women; mean age, 65.2 ± 11.6 [range, 33–84 years]), consisting of 34 patients in the cirrhosis group and 32 patients in the non-cirrhosis group (Figure 1).
The reasons for abdominal MRI included surveillance or post-therapeutic follow-up of hepatocellular carcinoma (n = 30) and an evaluation of portal hypertension (n = 4) in the cirrhosis group as well as a further evaluation of suspected pancreatic abnormalities (e.g., pancreatic duct stenosis or cystic lesions) (n = 13), gastrointestinal lesions (e.g., gastric cancers) (n = 10), benign hepatic lesions (e.g., hemangioma) (n = 8), and benign biliary stricture (n = 1) in the non-cirrhosis group. The causes of cirrhosis included hepatitis C virus infection (n = 14), hepatitis B virus infection (n = 6), alcohol consumption (n = 6), nonalcoholic steatohepatitis (n = 5), primary biliary cholangitis (n = 1), and cryptogenic (n = 2). Patients in the cirrhosis group were identified based on a clinical diagnosis. All patients had their clinical and laboratory data consulted to determine the fibrosis-4 (FIB-4) index, albumin–bilirubin (ALBI) score, aminotransferase/platelet ratio index (APRI), and Child–Pugh classification.
2.2. CT Technique
All examinations were performed with a dual-source, dual-energy CT scanner (SOMATOM Force; Siemens Healthineer, Forchheim, Germany) with the following parameters: tube voltages, 100 kV and 150 kV with tin filtration; detector collimation, 128 × 0.6 mm; pitch, 0.6; gantry rotation time, 0.5 s; matrix, 512 × 512; and reconstruction thickness, 1.0 mm with no gaps using an iterative reconstruction program (adaptive model-based iterative reconstruction [ADMIRE]) at a level of 2. The tube current was controlled using automated tube current modulation (CareDose 4D).
All patients underwent unenhanced CT in the supine position. Subsequently, multiphasic contrast-enhanced dynamic CT was conducted during the arterial phase (AP), portal venous phase (PVP), and equilibrium phase (EP). Iodinated contrast material (600 mgI/kg) was injected intravenously with a fixed injection duration of 30 s (3–5 mL/s flow rate, depending on the patient’s weight), followed by a 30-mL saline flush. AP scanning was initiated automatically 20 s after a bolus-tracking system detected a trigger threshold of 100 Hounsfield units (HU) at the level of the abdominal aorta. PVP and EP scanning were started 60 and 180 s after the start of intravenous injection, respectively.
For AP, PVP, and EP CT images, using a blending factor of 0.5 (50% data of 100 kVp and 50% data of 150 kVp spectrum), blended images corresponding to 120 kVp CT were created. In addition, iodine concentration map images were generated from each phase of contrast-enhanced DECT using a post-processing software program (Syngo via version 10; Siemens Healthineers, Forchheim, Germany) to measure iodine concentrations in the AP, PVP, and EP of the liver.
2.3. Image Analyses
The liver volume was measured by a radiologist (four years of experience in abdominal radiology) on a workstation with a volume analyzer software program (SYNAPSE VINCENT version 7.0; Fujifilm Medical Corporation, Tokyo, Japan). The contours of the liver on blended 120 kV CT images were automatically outlined by a fully automated 3D volumetric CT software program to create 3D CT images of the whole liver. Large vessels, such as the portal vein, inferior vena cava, and hepatic vein, were then extracted semi-automatically in the PVP and EP, and the boundary of each hepatic segment was determined and color-coded using the extracted portal vein and hepatic vein as indicators (Figure 2). Based on the Couinaud classification of liver anatomy, the liver was divided into the caudate, left lateral, left medial, right anterior, and right posterior segments.
Next, the color-coded hepatic segments were extracted from the 3D CT images and separately superimposed on the iodine map images of the PVP and EP to calculate the iodine content of each hepatic segment (Figure 2). Misalignments in the superimposed images were manually corrected as necessary. Finally, the mean iodine concentration (mgI/cm^3^) of each hepatic segment was calculated by dividing the volumetric iodine content of each hepatic segment by the hepatic volume of each segment.
In addition, the ECV fraction of each hepatic segment was calculated using EP iodine map images. The calculation method was based on the following formula:
where ICliver and ICaorta are the iodine concentrations in the hepatic segment and aorta, respectively, in the EP iodine map images.
The iodine concentration and ECV fractions were measured in the lateral, medial, anterior, and posterior segments of the liver. The caudate lobe was not evaluated in this study because it was sometimes difficult to accurately and automatically delineate its boundaries on superimposed iodine map images due to its complex structure consisting of the Spiegel lobe, paracaval portion, and caudate process [3].
After image processing and calculation, the volume, iodine concentration, and ECV fractions of each hepatic segment in the PVP and EP were compared between the cirrhotic and non-cirrhotic groups. The difference in iodine concentration between PVP and EP (ICPVP-liver—ICEP-liver) was also evaluated in each hepatic segment.
2.4. Statistical Analyses
All data were statistically analyzed by applying IBM SPSS software program (version 27.0; IBM, Armonk, NY, USA). Continuous variables were expressed as the mean ± standard deviation. In patient demographic characteristics, the Mann–Whitney U test and chi-square test were used between the cirrhosis and non-cirrhosis groups. The Mann–Whitney U test was used to compare the iodine concentration and ECV between the cirrhosis and non-cirrhosis groups. The iodine concentration and ECV of the liver parenchyma were compared among each hepatic segment using Friedman’s test followed by post hoc Dann test with Bonferroni correction. For predicting liver cirrhosis in each segment, the areas under the receiver operating characteristic (ROC) curve (AUC) were calculated. Cutoff values were obtained utilizing the maximized Youden index method based on the ROC analysis. Differences were considered statistically significant at p < 0.05.
3. Results
The results of the comparison of the patients’ demographic characteristics are shown in Table 1. No significant differences were found between the cirrhotic and non-cirrhotic groups with regard to age (p = 0.662) and sex (p = 0.806). There was also no significant difference in the ALBI score between the groups (p = 0.359) although the FIB-4 index (4.6 ± 4.2 vs. 1.7 ± 1.1) and APRI score (1.47 ± 1.94 vs. 0.52 ± 0.97) were significantly higher in the cirrhosis group than in the non-cirrhosis group (p < 0.001).
In the comparison of hepatic segmental volume, the cirrhosis group had a significantly greater volume of the lateral segment than the non-cirrhosis group ([259 ± 133] vs. [188 ± 49] ml, p < 0.05) and significantly smaller volume of the medial and anterior segments than the non-cirrhosis group ([114 ± 43] vs. [137 ± 34] ml, p < 0.05; [337 ± 128] vs. [405 ± 118] ml, p < 0.05) (Table 2).
The comparison of iodine concentrations (mgI/cm^3^) in each hepatic segment is shown in Figure 3. In the PVP, the iodine concentration in the cirrhosis group tended to be lower than that in the non-cirrhosis group in all the hepatic segments. However, none of these differences were statistically significant (Figure 3a). In EP, the iodine concentration tended to be greater in the cirrhosis group than in the non-cirrhosis group in all segments, but the difference was not significant (Figure 3b). Conversely, the difference in iodine concentration (ICPVP-liver—ICEP-liver) between PVP and EP was significantly smaller in the cirrhosis group than in the non-cirrhosis group for all hepatic segments (p < 0.001) (Figure 3c). The AUC, cutoff value, sensitivity and specificity for predicting liver cirrhosis in each segment based on the difference in iodine concentration between the PVP and EP are shown in Table 3.
The results of the comparison of the ECV fractions in each hepatic segment are shown in Figure 3d. In the ECV fraction calculated for the EP iodine map images, the ECV fraction of the left medial segment was significantly higher in the cirrhosis group than in the non-cirrhotic group ([26.4 ± 7.6] vs. [23.1 ± 5.1]; p < 0.05).
Regarding the differences in iodine concentration and ECV between each hepatic segment, the iodine concentration in the lateral segment was significantly higher than that in the right anterior and posterior segments in both the cirrhosis and non-cirrhotic group (p < 0.001–0.016) (Table 4, Table 5 and Table 6). The ECV in the lateral segment was significantly higher than that in the medial and right anterior segments in both the cirrhotic and non-cirrhotic groups (p < 0.001) (Table 7).
4. Discussion
In the present study, each liver segment was successfully color-coded and extracted using a fully automated 3D volumetric CT program in contrast-enhanced dynamic images, which were then superimposed with iodine map images generated from DECT data to evaluate the iodine concentration and ECV fraction of each liver segment on a volumetric basis. This study showed that the cirrhosis group had a significantly greater volume in the lateral segment and significantly smaller volume in the medial and anterior segments than the non-cirrhosis group, findings consistent with previous reports of selective atrophy and compensatory enlargement, which are characteristic morphological changes in cirrhosis [9,10].
In contrast, the cirrhosis group exhibited a tendency towards lower iodine concentrations in the PVP across all segments, indicative of reduced portal venous flow. Conversely, the iodine concentrations in the EP and ECV fractions were greater, suggesting increased hepatic interstitial spaces, possibly due to fibrosis, compared with the non-cirrhosis group, but these differences were not significant, except for the ECV fraction in the medial segment. In this study, significant differences were observed between the two groups in the FIB-4 index and APRI, which serve as indicators of fibrosis, but not in the ALBI score, which is a marker of hepatic reserve capacity. These findings indicate that the degree of fibrosis may be underestimated in cases of cirrhosis with a preserved hepatic reserve capacity when the iodine concentration or ECV fraction is evaluated alone.
Conversely, the difference in iodine concentration between PVP and EP (ICPVP-liver—ICEP-liver) was significantly lower in the cirrhosis group than in the non-cirrhosis group, which is thought to be the result of the combined effect of reduced portal venous blood flow and increased interstitial space associated with fibrosis, allowing it to more sensitively reflect mild fibrosis and likely be a clinically useful indicator for assessing compensated cirrhosis. Further studies would be necessary to apply this method to early-stage fibrosis grading or longitudinal follow-up to evaluate its clinical utility.
In addition, when comparing the iodine concentration and ECV (%) in the PVP and EP between segments, the lateral segment was larger than the medial and anterior segments in both the cirrhotic and non-cirrhotic groups. One potential explanation for this phenomenon may be the predominance of splenic venous blood flow in the portal vein during periods of fasting, which tends to flow into the left lobe in cirrhosis [4,11]. The observation that analogous results were exhibited in the non-cirrhosis group is noteworthy, as it implies that, even in normal livers, the portal blood flow and the vascular bed are abundant in the left lobe.
Another reason for this result is the timing of the acquisition of EP images. The EP is generally defined as the time approximately 180 to 200 s after the intravascular and extracellular fluid contrast medium concentrations reach equilibrium [12], but there are various reports on the evaluation timing of liver fibrosis using equilibrium phase CT images, including evaluations at 3 min [8,13,14], 4 min [15,16], 10 min [17,18], and 30 min [19], so the optimal and precise time setting for evaluating liver fibrosis has not been clarified [20]. Compared with previous reports, the effects of blood flow may yet remain in the EP images taken after 3 min used in this study. In this case, it is presumed that the iodine concentration in the EP and ECV fractions was greater in the lateral segment than in the medial and anterior segments, reflecting the effect of blood flow.
Several limitations associated with the present study warrant mention. First, it may have been biased because of its retrospective design. Second, the overall sample size was small, particularly among patients with advanced cirrhosis and high ALBI and Child–Pugh grades. This was primarily due to the fact that many of the eligible patients during the study period had been scanned using other CT systems that lacked a dual-energy mode, which prevented their inclusion in the analysis. In addition, advanced cirrhosis itself is relatively uncommon in our clinical practice, which inherently limited the number of such cases. Future studies should include cirrhotic patients with larger sample sizes to enhance the statistical power and generalizability of the findings. Third, the diagnosis of cirrhosis was based on clinical manifestations without histological evidence, thus making it impossible to compare with the degree of histological fibrosis. Finally, the ECV fraction and iodine concentration in the EP were examined using CT images taken 3 min after contrast in this study. As noted above, further studies will be needed to determine the appropriate timing for assessing liver fibrosis.
5. Conclusions
The decreased difference in iodine concentration between PVP and EP calculated from 3D volumetric iodine mapping of the liver segment using DECT may be a clinically useful indicator for evaluating patients with compensated cirrhosis, suggesting a combined effect of a reduced portal venous flow and increased interstitial space associated with fibrosis.
The reference list from the paper itself. Each links out to its DOI / PubMed record.
- 1Gines P. Krag A. Abraldes J.G. Sola E. Fabrellas N. Kamath P.S. Liver cirrhosis Lancet 20213981359137610.1016/S 0140-6736(21)01374-X 34543610 · doi ↗ · pubmed ↗
- 2Friedman S.L. Hepatic Fibrosis: Emerging Therapies Dig. Dis.20153350450710.1159/00037409826159266 · doi ↗ · pubmed ↗
- 3Ozaki K. Kozaka K. Kosaka Y. Kimura H. Gabata T. Morphometric changes and imaging findings of diffuse liver disease in relation to intrahepatic hemodynamics Jpn. J. Radiol.20203883385210.1007/s 11604-020-00978-632347423 · doi ↗ · pubmed ↗
- 4Higaki A. Kanki A. Yamamoto A. Ueda Y. Moriya K. Sanai H. Sotozono H. Tamada T. Liver cirrhosis: Relationship between fibrosis-associated hepatic morphological changes and portal hemodynamics using four-dimensional flow magnetic resonance imaging Jpn. J. Radiol.20234162563610.1007/s 11604-023-01388-036656540 PMC 10232588 · doi ↗ · pubmed ↗
- 5Jeon S.K. Joo I. Park J. Yoo J. Automated hepatic steatosis assessment on dual-energy CT-derived virtual non-contrast images through fully-automated 3D organ segmentation Radiol. Med.202412996797610.1007/s 11547-024-01833-838869829 PMC 11252222 · doi ↗ · pubmed ↗
- 6Bak S. Kim J.E. Bae K. Cho J.M. Choi H.C. Park M.J. Choi H.Y. Shin H.S. Lee S.M. Kim H.O. Quantification of liver extracellular volume using dual-energy CT: Utility for prediction of liver-related events in cirrhosis Eur. Radiol.2020305317532610.1007/s 00330-020-06876-932335746 · doi ↗ · pubmed ↗
- 7Mc Collough C.H. Leng S. Yu L. Fletcher J.G. Dual- and Multi-Energy CT: Principles, Technical Approaches, and Clinical Applications Radiology 201527663765310.1148/radiol.201514263126302388 PMC 4557396 · doi ↗ · pubmed ↗
- 8Sofue K. Tsurusaki M. Mileto A. Hyodo T. Sasaki K. Nishii T. Chikugo T. Yada N. Kudo M. Sugimura K. Dual-energy computed tomography for non-invasive staging of liver fibrosis: Accuracy of iodine density measurements from contrast-enhanced data Hepatol. Rrs.2018481008101910.1111/hepr.1320529908040 · doi ↗ · pubmed ↗