Chemometric Discrimination of Korean and Chinese Kimchi Using Untargeted Metabolomics
Quynh-An Nguyen, Dong-Shin Kim, Hyo-Dong Kim, Kyu-Bin Kim, Kyung-Sik Ham, Yonghoon Lee, Hyun-Jin Kim

TL;DR
This study uses metabolomics to identify chemical differences between Korean and Chinese kimchi, revealing markers that distinguish their origins and properties.
Contribution
The study introduces new metabolite markers for distinguishing Korean and Chinese kimchi using untargeted metabolomics.
Findings
Thirty-four metabolites were identified that clearly separate Korean and Chinese kimchi.
Korean kimchi is enriched in compounds like rutin, capsicosin, and sinapic acid derivatives.
Chinese kimchi contains higher levels of trihydroxy octadecenoic acid, maltose, and corchorifatty acid F.
Abstract
Background/Objectives: Kimchi has gained global recognition for its unique taste and health benefits, but its quality is totally different according to its geographical origin of materials and production methods. Methods: In this study, differences between Korean (53 samples) and Chinese kimchi (72 samples) were investigated through comprehensive metabolomic analysis using gas chromatography–mass spectrometry (GC-MS) and ultra-performance liquid chromatography–quadrupole time-of-flight mass spectrometry (UPLC-Q-TOF MS). Results: Multivariate statistical analyses revealed a clear separation between the two groups. Thirty-four metabolites contributing to the separation were identified. Korean kimchi was enriched in sucrose, quinic acid, sinapic acid derivatives, rutin, capsicosin, and capsianoside, while Chinese kimchi contained higher levels of trihydroxy octadecenoic acid,…
Genes, proteins, chemicals, diseases, species, mutations and cell lines named across the full text — each resolved to its canonical identifier and authoritative record.
Click any figure to enlarge with its caption.
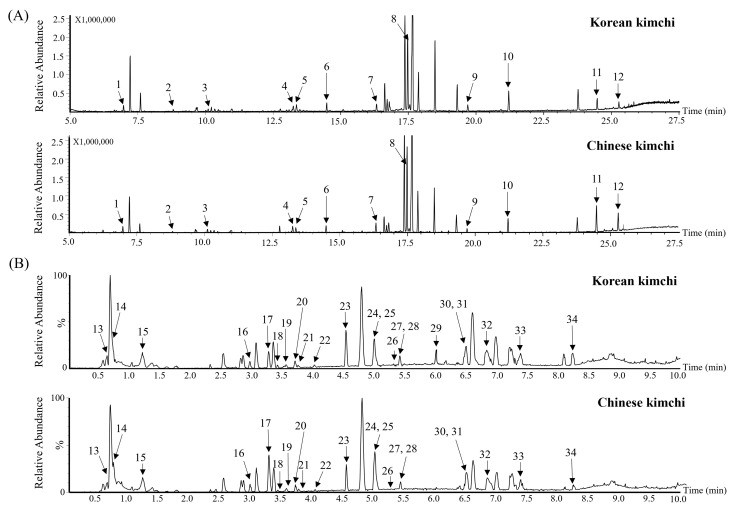 Figure 1
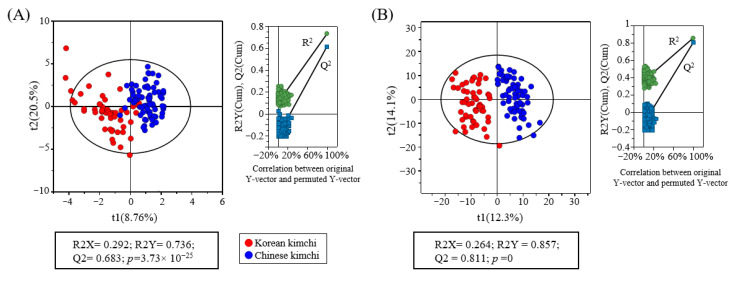 Figure 2
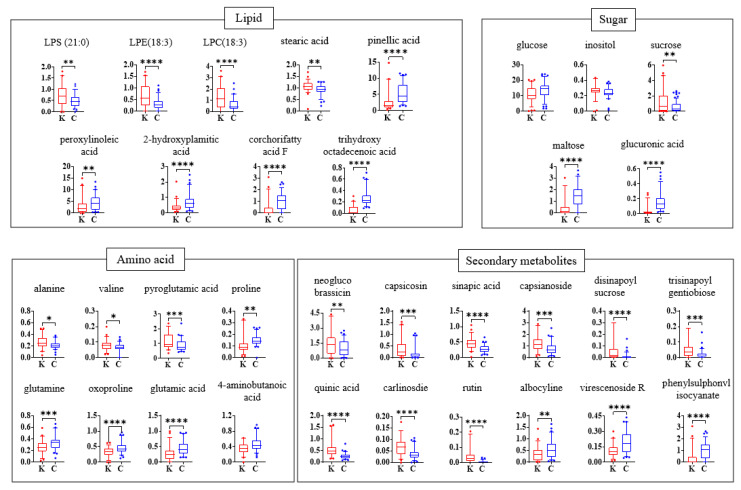 Figure 3
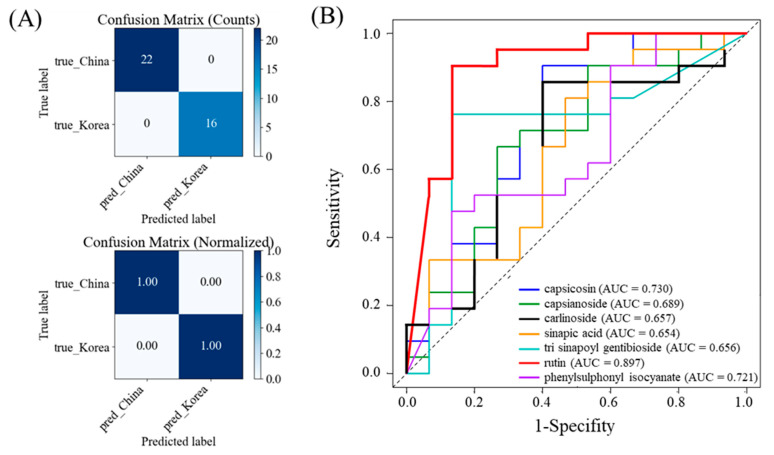 Figure 4
- —National Research Foundation of Korea (NRF)
- —Ministry of Education
- —Korea Food Research Institute (KFRI)
- —Ministry of Science and ICT of South Korea
Peer Reviews
No public reviews on file for this paper yet. If you reviewed it on a platform where reviews are public (OpenReview, ICLR, NeurIPS, ICML), you can paste yours below so the community can read it here.
Videos
No videos yet. Explain this paper in a talk, walkthrough, or lecture? Add one.
Taxonomy
TopicsFood Quality and Safety Studies · Probiotics and Fermented Foods · Fermentation and Sensory Analysis
1. Introduction
The origin and authenticity of food products are a critical concern in the modern food industry. Mislabeling and adulteration can pose significant risks to public health, economic stability, and the expected nutritional and health benefits by introducing potential allergens, toxins, and low-quality ingredients [1,2]. This problem is exacerbated in the global market, where complex supply chains can obscure the origin and ingredients of food materials [1,2]. Therefore, the development of advanced analytical methods is essential to ensure the quality of food materials and to verify their origin. Conventional methods for food authentication have included a range of techniques, from sensory evaluations to advanced molecular analyses [3]. Sensory evaluation using electronic tongue and nose as well as non-destructive testing methods like infrared spectrometry can offer a faster approach, but their specificity is often limited [4]. DNA-based techniques, such as polymerase chain reaction (PCR), target specific genetic markers to confirm the identity of food ingredients [5], while targeted analytical methods of chemical profiles focus on specific compounds [6]. Physical elemental analyses using inductively coupled plasma mass spectrometry (ICP-MS) and isotope ratio mass spectrometry (IRMS) can also provide detailed information for food authentication but are often limited to specific types of adulteration [6].
In addition to these analytical methods, metabolomics, the simultaneous and comprehensive analysis of numerous metabolites in biological systems, is widely used as an informative, discriminative, and predictive technique for assessing food quality, safety, and geographical origin [7,8]. In particular, it has proven to be powerful and effective for determining the geographical differentiation of food products by profiling metabolic signatures. This approach has been applied to various foods, including honey [9], wine [10], olive oils [11], red wines [12], coffee [13], and seafood [14], vegetables, and fruits. Additionally, the study of metabolite profiling in fermented foods is used to observe metabolite changes during fermentation and predict the sensory and nutritional quality of the final food materials, such as meju [15], doenjang [16], fermented soymilk [17], and yogurt [18].
Kimchi, known as one of the healthiest foods, is gaining global popularity due to its distinctive taste and potential health benefits [19]. However, with the growing size of the kimchi market size, a proliferation of kimchi products from various origins has raised concerns about their geographical origin and production methods. Although several metabolomic studies have investigated kimchi [20,21], few have focused on differentiating products based on their production regions. Several previous studies have investigated the geographical discrimination of kimchi, including NMR-based metabolomics [22], elemental profiling [23], and ICP-OES/ICP-MS with multivariate statistics [24]. Nevertheless, applications of combined GC-MS and UPLC-QTOF MS with machine-learning approaches remain limited.
Therefore, in this study, gas chromatography (GC)-MS and ultra-performance liquid chromatography-quadrupole-time-of-flight (UPLC-Q-TOF) MS were employed to analyze untargeted metabolites from 125 commercial kimchi samples produced in two different countries. Multivariate statistical analysis was conducted to identify discriminative metabolites associated with regional differences, in order to establish candidate markers for the chemometric classification of kimchi according to production region.
2. Materials and Methods
2.1. Kimchi Sample
A total of 125 cabbage kimchi samples were collected by the National Agricultural Products Quality Management Service of South Korea in 2021. Among them, 72 samples were imported from China, and 53 samples produced in Korea and obtained from local markets. All kimchi samples were collected within 10 days of production. All samples were washed with distilled water, freeze-dried, and ground into powder.
2.2. pH, Salinity, and Titratable Acidity
The physicochemical properties of the kimchi samples, including pH, salinity, and titratable acidity (TA), were subsequently analyzed. For these measurements, 0.1 g of sample powder was mixed with 0.9 mL of distilled water. Salinity was measured with a salt meter (PAL-SALT, Atago, Minato, Japan), while pH and TA were determined using a pH meter (HI 2215, HANNA Instruments, Woonsocket, RI, USA).
2.3. GC-MS Analysis
The lyophilized kimchi samples were homogenized in 80% aqueous methanol containing dicyclohexyl phthalate as an internal standard (IS). After centrifugation, the supernatant was completely dried. The dried residues were re-dissolved in 70 μL of methoxyamine hydrochloride in pyridine (20 mg/mL) and incubated at 37 °C for 90 min. The samples were derivatized by adding 70 μL of N,O-bis(trimethylsilyl)trifluoroacetamide with 1% trimethylchlorosilane and incubated at 70 °C for 30 min. The derivatized sample was injected into a GC-2010 plus system (Shimadzu Corp., Kyoto, Japan) equipped with a DB-5ms capillary column (30 m × 0.25 mm, 0.25 μm, Agilent J&W column; Agilent Technologies, Santa Clara, CA, USA) using a split ratio of 1:50. The injector temperature was set to 200 °C, and the carrier gas flow rate was 1 mL/min. The oven was held at 70 °C for 2 min, ramped to 210 °C at 7 °C/min, then to 320 °C at 10 °C/min, and finally held at 320 °C for 7 min. The eluents were detected using a GCMS-TQ 8030 MS system (Shimadzu Corp.) with electron ionization at 70 eV. Ion source and interface temperatures were set to 230 °C and 280 °C, respectively. Data were acquired in full-scan mode over the m/z range of 45–550. A quality control (QC) sample, prepared by mixing aliquots of all samples, was injected once after every sample set [25].
2.4. UPLC-Q-TOF MS Analysis
Metabolites were extracted from lyophilized kimchi samples by homogenization with 80% methanol containing zidovudine as an IS. After centrifugation, the supernatants were analyzed by UPLC-Q-TOF MS (Xevo™ G2-S, Waters, Milford, MA, USA) equipped with an Acquity UPLC BEH C18 column (2.1 mm × 100 mm, 1.7 μm; Waters). The column was equilibrated with 0.1% formic acid, and metabolites were eluted using a linear gradient up to 100% acetonitrile containing 0.1% formic acid. The eluted metabolites were analyzed using the Q-TOF MS system in negative electrospray ionization (ESI) mode with a capillary voltage of 3 kV and a sampling cone voltage of 40 V. Leucine-enkephalin was used as a lock mass reference. A QC sample prepared by pooling aliquots of all samples was analyzed between every sample set. MS/MS spectra were acquired using a collision energy ramp from 10 to 30 eV [25].
2.5. Data Processing
The peak intensities obtained by GC-MS were aligned based on the retention time and normalized to the IS. The MS dataset analyzed by UPLC-Q-TOF MS was collected, aligned using MarkerLynx software ver. 4.2. (Waters), and normalized to the IS. The metabolites analyzed by UPLC-Q-TOF MS were identified using Chemspider databases implemented in UNIFI (Waters), and in-house database constructed with commercially available authentic standards, and MS/MS spectra. The metabolites analyzed by GC/MS were identified by comparing retention indices (RIs) calculated using C8-C40 n-alkanes with GC-MS databases (NIST 11 and Wiley 9 mass spectral libraries).
2.6. Predictive Modeling of Kimchi Biomarkers
To evaluate the predictive performance of the identified kimchi biomarkers, the dataset was randomly partitioned into a training set (70%) and a test set (30%). Logistic regression models were trained with a maximum of 500 iterations and a fixed random state (123) to ensure convergence and reproducibility. Model performance was further assessed using confusion matrix–based metrics (accuracy, sensitivity, specificity) on the held-out test set to complement ROC analysis. Univariate Bayesian logistic regression models were fitted on the training data to assess the discriminatory ability of each biomarker individually. The predictive performance of each model was then evaluated on the held-out test set. Receiver operating characteristic (ROC) curve analysis was performed to visualize the discriminatory power of each biomarker, and the area under the curve (AUC) was calculated. Biomarkers with higher AUC values were considered to have greater discriminatory potential.
2.7. Statistical Analysis
Multivariate statistical analysis of the MS data was performed using SIMCA-P+ version 16.0.1 (Umetrics, Umeå, Sweden). Partial least squares discriminant analysis (PLS-DA) was used to visualize the differences among sample groups, and was selected because it provides a robust and reliable discrimination model for metabolomics data. Metabolite intensities were statistically analyzed to identify metabolites contributing to the differences among sample groups by two-way analysis of variance (ANOVA) followed by a t-test (p < 0.05) using SPSS 27.0 (SPSS Inc., Chicago, IL, USA). Moreover, pH, salinity, and acidity were also statistically analyzed using a t-test (p < 0.05). Normality was not explicitly tested; however, given the relatively large sample sizes (Korean kimchi: n = 53; Chinese kimchi: n = 72), parametric methods are considered robust to moderate deviations from normality [26].
3. Results and Discussion
3.1. Physicochemical Properties of Kimchi Samples
The pH, salinity, and TA of 125 kimchi samples produced in two countries with geographical differences were approximately 3.2–3.5, 4.9, and 0.22%, respectively (Table 1). However, no statistically significant differences were observed between the kimchi samples. In kimchi fermentation, pH typically decreases rapidly from around 5–6 to 3–4 within the first few days and then remains relatively stable. In contrast, TA, which is below 0.2% at the initial stage, continues to increase throughout fermentation, depending on conditions such as temperature and microbial activity [21,27]. In this study, the observed pH combined with relatively low acidity suggests that the samples were at a comparable early-to-mid stage of fermentation across both countries [27].
3.2. Metabolomic Analysis
The metabolite profiles of 125 samples (53 Korean and 72 Chinese kimchi samples) were analyzed using GC-MS and UPLC-Q-TOF MS (Figure 1). The acquired MS data were subjected to multivariate statistical analysis to visualize the differences between the two kimchi groups (Figure 2). The statistical parameters, including the goodness of fit (R2Y = 0.815 and 0.857), predictability (Q2 = 0.683 and 0.911), p-values (1.60 × 10^−30^ and 0), and cross-validation results from permutation tests (y-intercepts: GC-MS, R^2^ = 0.102 and Q^2^ = −0.200; UPLC-Q-TOF MS, R^2^ = 0.352 and Q^2^ = −0.136) determined via the permutation test, indicated that the PLS-DA models used in this study were statistically acceptable. The PLS-DA score plots showed that the two kimchi groups were significantly separated along t(1). To identify metabolites contributing to the PLS-DA plots separation and potential markers, the variable importance in projection (VIP) and p-values were calculated, and a total of 34 metabolites having VIP > 0.88 and p < 0.05 were identified (Table 2 and Table 3). Similar metabolites, such as sinapic acid derivatives, glucosinolates, rutin, and GABA, have also been reported in previous kimchi and kimchi cabbage metabolomics studies [25,28].
3.3. Relative Abundance of Identified Metabolites
Based on identified metabolites, significant differences in metabolite composition between the two kimchi groups were observed (Figure 3). The comparison of relative abundance revealed that the two kimchi groups exhibited markedly different metabolite distribution patterns in lipids, sugars, amino acids, and secondary metabolites.
Among these metabolites, several sugars showed distinct differences in abundance between Korean and Chinese kimchi. Sucrose was 2.20-fold more abundant in Korean kimchi compared to Chinese kimchi, whereas glucose, maltose, and glucuronic acid were 1.29-, 3.20-, and 4.56-fold higher in Chinese kimchi.
Sucrose is typically hydrolyzed in the early stage of kimchi fermentation, followed by the gradual reduction in fructose and glucose, while disaccharides such as maltose increase [21]. However, in this study, Korean kimchi showed higher levels of sucrose than Chinese kimchi. This may reflect the use of sugar-containing ingredients in some commercial products, rather than differences in fermentation extent [29,30].
In contrast, the higher levels of glucose, maltose, and glucuronic acid in Chinese kimchi suggest active degradation of starch and plant cell wall polysaccharides. These metabolites may originate from starchy ingredients such as glutinous rice or wheat flour paste, which are often added during kimchi preparation. In particular, the significant increase in maltose, a typical product of starch hydrolysis, implies the involvement of amylolytic enzymes. Glucuronic acid, a constituent of hemicellulose and pectin, may be released during their microbial degradation [31] suggesting possible differences in ingredient composition or enzymatic activity between the two groups.
Regarding amino acids, the levels of alanine, valine, oxoproline, and pyroglutamic acid were approximately 1.2–1.4 times lower in Chinese kimchi than in Korean kimchi, whereas proline, glutamine, 4-aminobutanoic acid (GABA), and glutamic acid were approximately 1.2–1.4 times higher. This difference can be explained by the metabolic activities of bacteria involved in kimchi fermentation. Lactic acid bacteria (LAB) such as Lactobacillus plantarum and Leuconostoc mesenteroides are responsible for utilizing alanine and valine early in the fermentation process, resulting in their lower concentrations. These bacteria convert these amino acids into flavor-enhancing metabolites, which are used up quickly during fermentation, particularly in Chinese kimchi, where fermentation may proceed more rapidly [32,33]. In contrast, proline, glutamine, and glutamic acid tend to accumulate more in Chinese kimchi, potentially due to microbial activities or shorter fermentation times that limit the breakdown of these amino acids [34]. These amino acids, especially glutamic acid and glutamine, contribute to the umami flavor, and their higher levels indicate that the fermentation process in Chinese kimchi favors the retention of these flavor-enhancing compounds [35]. Importantly, GABA, a bioactive compound with health-promoting effects, is produced by LAB (e.g., Lactobacillus plantarum) through the decarboxylation of glutamic acid [36]. Its elevated levels in Chinese kimchi suggest that GABA-producing LAB strains are active or that fermentation conditions in Chinese kimchi favor increased GABA accumulation [37].
Differences in lipid profiles also contribute substantially to the discrimination between Korean and Chinese kimchi. LPE (18:3) and LPC (18:3), phospholipids associated with cell membrane processes, were detected at approximately two-fold lower concentrations in Chinese kimchi (Figure 3). Conversely, several fatty acids, including trihydroxy octadecadienoic acid, pinellic acid, peroxylinoleic acid, 2-hydroxypalmitic acid, and corchorifatty acid F, were detected at higher concentrations in Chinese kimchi, with fold increases of 4.70, 2.00, 1.54, 1.83, and 3.20, respectively (Table 3). The observed differences in lipid profiles between Korean and Chinese kimchi may be attributable to multiple factors, including the lipid composition of raw materials, fermentation conditions, and microbial communities [38]. Dominant LAB and their associated lipolytic and phospholipase activities can alter phospholipid degradation and fatty acid oxidation, thereby shaping the distinct lipid profiles of each regional product [29].
Following the differences observed in primary metabolites such as sugars, amino acids, and lipids, the secondary metabolomic profiling also revealed significant distinctions between Korean and Chinese kimchi. In particular, the levels of quinic acid, neoglucobrassicin, capsicosin, sinapic acid, capsianoside, disinapoyl sucrose, trisinapoyl gentiobiose, carlinoside, and rutin were 2.18-, 1.56-, 2.23-, 1.64-, 1.55-, 6.27-, 2.58-, 1.83-, and 7.45-fold higher in Korean kimchi, respectively, whereas the levels of virescenoside R and phenylsulphonyl isocyanate were 1.63- and 2.68-fold higher in Chinese kimchi. Capsicosin and capsianoside are capsaicinoid-related metabolites derived from Capsicum annuum, contributing to pungency as well as antimicrobial and antioxidant activities [39]. Their elevated abundance in Korean kimchi may reflect the use of chili cultivars with a higher genetic capacity for capsaicinoid biosynthesis, differences in production methods, and possible environmental or geographical influences [40]. Previous studies have also reported that elevated levels of these metabolites can influence kimchi fermentation by altering the microbial community [41]. Higher capsaicinoid concentrations have been associated with a relative increase in capsaicinoid-tolerant lactic acid bacteria such as Lactobacillus sakei, while reducing the abundance of Leuconostoc gelidum. Such shifts may modify fermentation kinetics and ultimately affect the overall quality of kimchi [41,42]. Similarly, higher levels of quinic acid, neoglucobrassicin, sinapic acid derivatives, carlinoside, rutin, and isoeruboside B in Korean kimchi are also likely shaped by cultivar characteristics and production methods, with possible contributions from environmental and geographical factors [43]. Notably, sinapic acid derivatives are among the major phenolic constituents of kimchi cabbage, the primary vegetable in kimchi, and their higher levels in Korean kimchi may reflect compositional differences in the kimchi cabbage used [28,44]. These metabolites are reported to possess antioxidant, anti-inflammatory, and metabolic health–modulating activities and may contribute to both the functional properties and sensory characteristics of kimchi [45,46]. The differences are consistent with origin-associated production methods, although ingredients, microbiota, and production conditions were not directly assessed in this study.
3.4. Discriminative Performance of Key Metabolites for Kimchi Origin Discrimination
To evaluate the discriminative ability of major metabolites, logistic regression and ROC curve analyses were performed in R (Figure 4). The logistic regression model demonstrated a complete classification accuracy of 100% within the test dataset, accurately identifying all samples from the Chinese (n = 22) and the Korean (n = 16) (Figure 4A). To complement the AUC values, classification performance was evaluated at the optimal ROC threshold (Table S1); across the top markers, accuracy ranged from 0.639 to 0.889, sensitivity from 0.476 to 0.905, and specificity from 0.533 to 0.867. Rutin showed the highest classification performance with AUC of 0.897, indicating excellent ability to distinguish Korean and Chinese kimchi samples. Capsicosin (AUC = 0.730) and phenylsulphonyl isocyanate (AUC = 0.721) also demonstrated strong classification performance. Carlinoside (AUC = 0.670), capsianoside (AUC = 0.670), trisinapoyl gentiobiose (AUC = 0.656), and sinapic acid (AUC = 0.654) showed moderate discrimination capacity. The superior performance of rutin, capsicosin, and phenylsulphonyl isocyanate highlights their potential as key metabolites for distinguishing kimchi by origin. In particular, rutin showed excellent classification accuracy, suggesting that it could serve as a reliable single marker. Nevertheless, metabolites such as capsicosin and sinapic acid derivatives, despite lower individual AUCs, may contribute synergistically to multi-marker classification models, thereby enhancing robustness and predictive reliability [47,48].
4. Conclusions
This study demonstrates that the comparative metabolomic profiling of Korean and Chinese kimchi revealed distinct signatures in primary and secondary metabolites through GC-MS and UPLC-Q-TOF MS analyses. Korean kimchi was enriched in sucrose, phenolic compounds, and capsaicinoid-related compounds, including quinic acid, sinapic acid derivatives, rutin, capsicosin, and capsianoside. In contrast, Chinese kimchi contained higher levels of trihydroxy octadecenoic acid, 2-hydroxypalmitic acid, pinellic acid, maltose, glucuronic acid, and A corchorifatty acid F. Among these metabolites, metabolites such as rutin, capsicosin derivatives, and sinapic acid derivatives showed strong potential as origin-discriminant markers, reflecting the influence of raw materials, fermentation practices, and environmental factors on kimchi composition. These markers provide reliable tools for authenticating kimchi origin and enhance understanding of how geographic variation, as well as differences in recipe, ingredients, and production processes, may affect its nutritional and sensory qualities.
The reference list from the paper itself. Each links out to its DOI / PubMed record.
- 1Chien H.J. Zheng Y.F. Wang W.C. Kuo C.Y. Hsu Y.M. Lai C.C. Determination of adulteration, geographical origins, and species of food by mass spectrometry Mass Spectrom. Rev.2023422273232310.1002/mas.2178035652168 · doi ↗ · pubmed ↗
- 2Zhang S. Chen J. Gao F. Su W. Li T. Wang Y. Foodomics as a Tool for Evaluating Food Authenticity and Safety from Field to Table: A Review Foods 2025141510.3390/foods 14010015 PMC 1171964139796305 · doi ↗ · pubmed ↗
- 3Gökmen V. Importance of Food Authentication and Origin Testing Food Chem. X 20231810070810.1016/j.fochx.2023.10070837397195 PMC 10314130 · doi ↗ · pubmed ↗
- 4Gliszczyńska-Świgło A. Chmielewski J. Electronic Nose as a Tool for Monitoring the Authenticity of Food. A Review Food Anal. Meth.2017101800181610.1007/s 12161-016-0739-4 · doi ↗
- 5Salihah N.T. Hossain M.M. Lubis H. Ahmed M.U. Trends and advances in food analysis by real-time polymerase chain reaction J. Food Sci. Technol.2016532196220910.1007/s 13197-016-2205-027407185 PMC 4921084 · doi ↗ · pubmed ↗
- 6Mazarakioti E.C. Zotos A. Thomatou A.-A. Kontogeorgos A. Patakas A. Ladavos A. Inductively Coupled Plasma-Mass Spectrometry (ICP-MS), a Useful Tool in Authenticity of Agricultural Products’ and Foods’ Origin Foods 202211370510.3390/foods 1122370536429296 PMC 9689705 · doi ↗ · pubmed ↗
- 7Li S. Tian Y. Jiang P. Lin Y. Liu X. Yang H. Recent advances in the application of metabolomics for food safety control and food quality analyses Crit. Rev. Food Sci. Nutr.2021611448146910.1080/10408398.2020.176128732441547 · doi ↗ · pubmed ↗
- 8Selamat J. Rozani N.A.A. Murugesu S. Application of the Metabolomics Approach in Food Authentication Molecules 202126756510.3390/molecules 2624756534946647 PMC 8706891 · doi ↗ · pubmed ↗