Acute Kidney Injury Biomarkers in Marathon Runners: Systematic Review and Meta-Analysis
Daniel-Corneliu Leucuța, Loredana-Ioana Trif, Oana Almășan, Ștefan Lucian Popa, Abdulrahman Ismaiel

TL;DR
This study reviews how marathon running affects kidney injury biomarkers and identifies several promising candidates for diagnosing acute kidney injury.
Contribution
The study systematically identifies and compares biomarker changes in marathon runners, highlighting new candidates for acute kidney injury diagnosis.
Findings
Most biomarkers showed significant increases immediately after the marathon compared to baseline.
TIMP-2*IGFBP, copeptin, and L-FABP are promising candidates for diagnosing acute kidney injury.
Biomarker evolution patterns varied, with some remaining elevated even 24 hours post-marathon.
Abstract
Background and Objectives: The objectives of this review were as follows: to measure changes in renal biomarker levels before, immediately after, and 24 h post-marathon; to identify promising biomarkers for the diagnosis of acute kidney injury; and to describe the temporal patterns of biomarker dynamics in relation to the marathon. Materials and Methods: Studies of marathon runners reporting AKI-related biomarkers were included. Four databases (PubMed, EMBASE, Web of Science, and LILACS) were searched. Data on study design, participant characteristics, and biomarker values (pre-, post-, and 24 h post-race) were extracted, and a random effects meta-analysis was performed. Risk of bias was assessed with the National Heart, Lung, and Blood Institute pre–post tool. Results: The study showed significant increases in most biomarkers immediately after the marathon compared to baseline values.…
Genes, proteins, chemicals, diseases, species, mutations and cell lines named across the full text — each resolved to its canonical identifier and authoritative record.
Click any figure to enlarge with its caption.
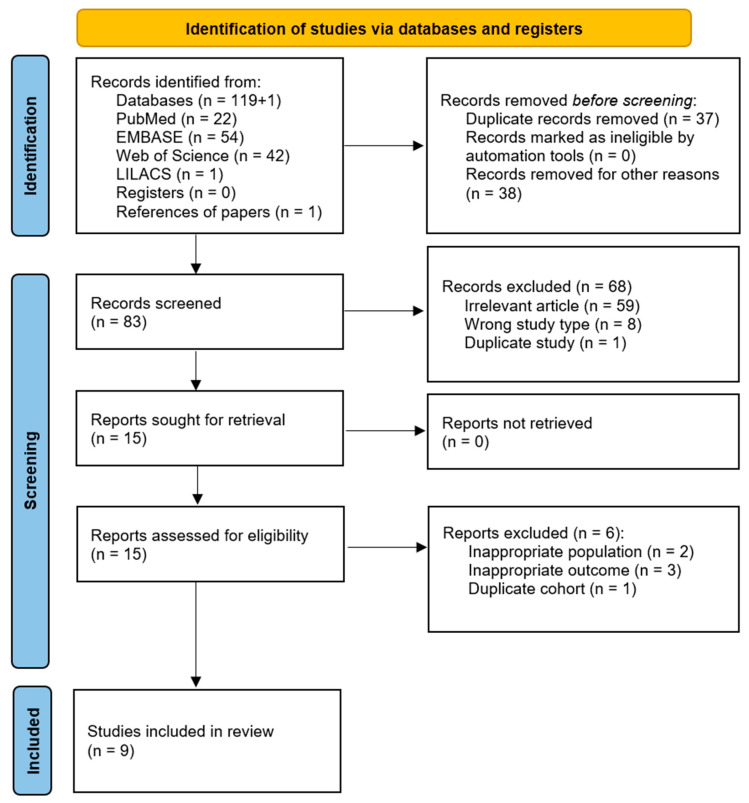 Figure 1
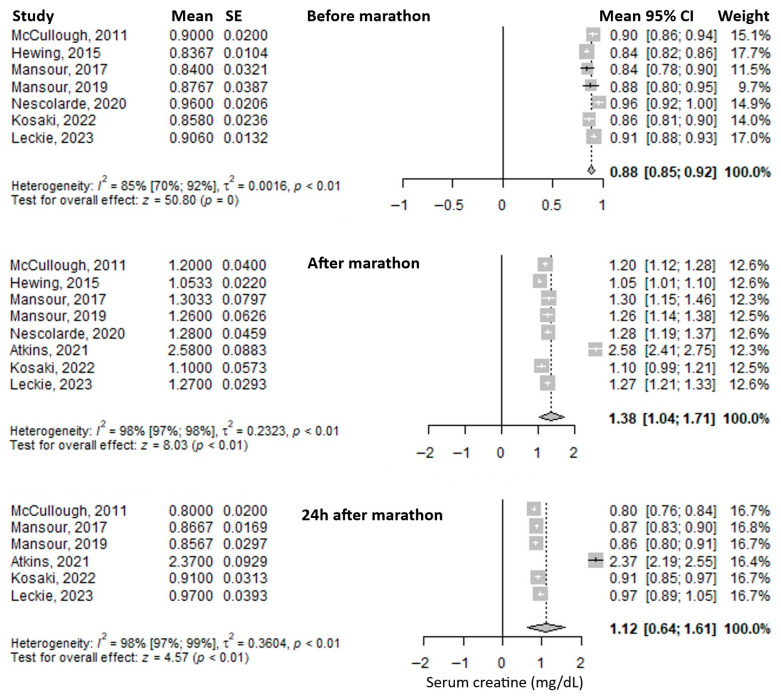 Figure 2
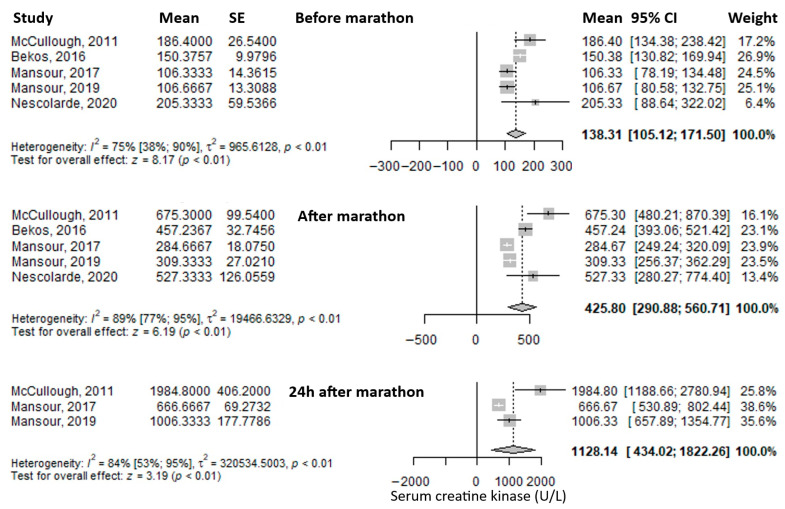 Figure 3
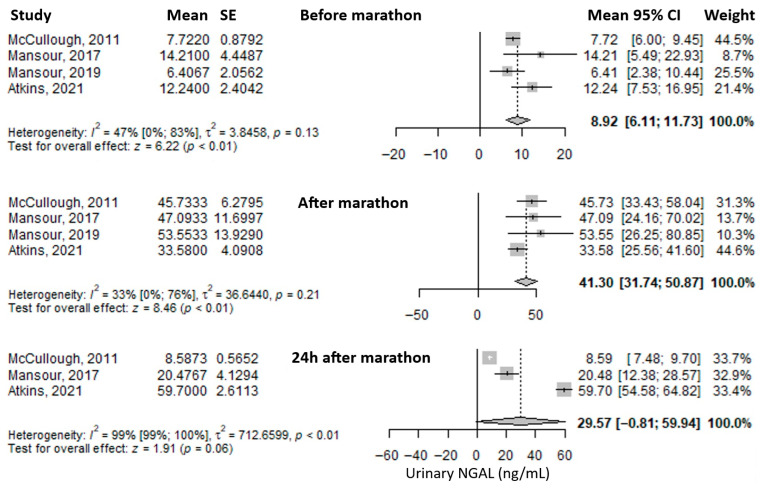 Figure 4
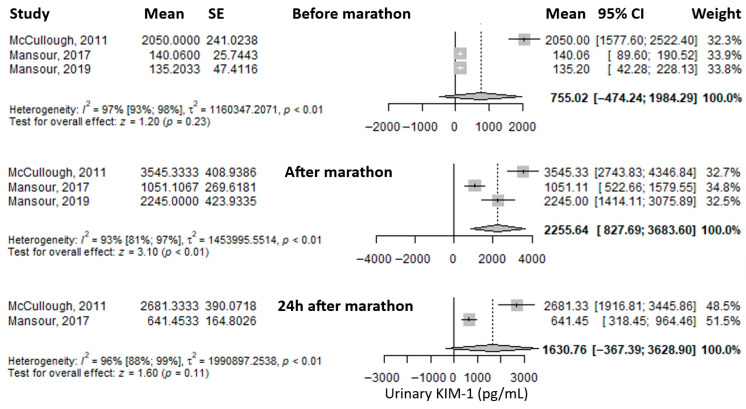 Figure 5
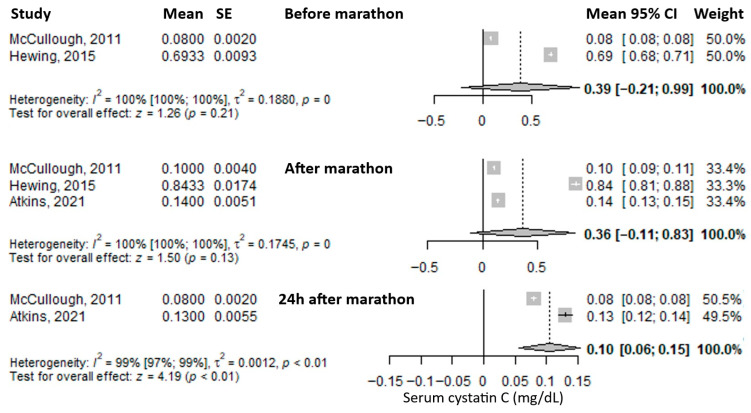 Figure 6
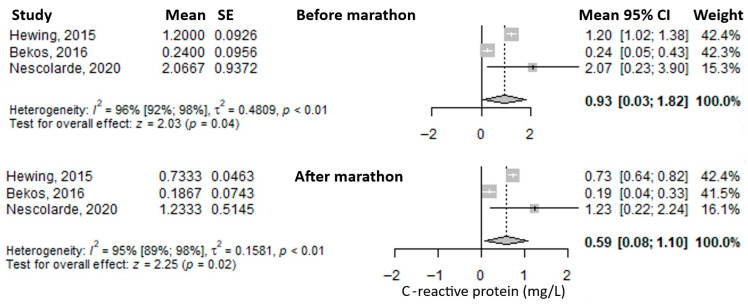 Figure 7
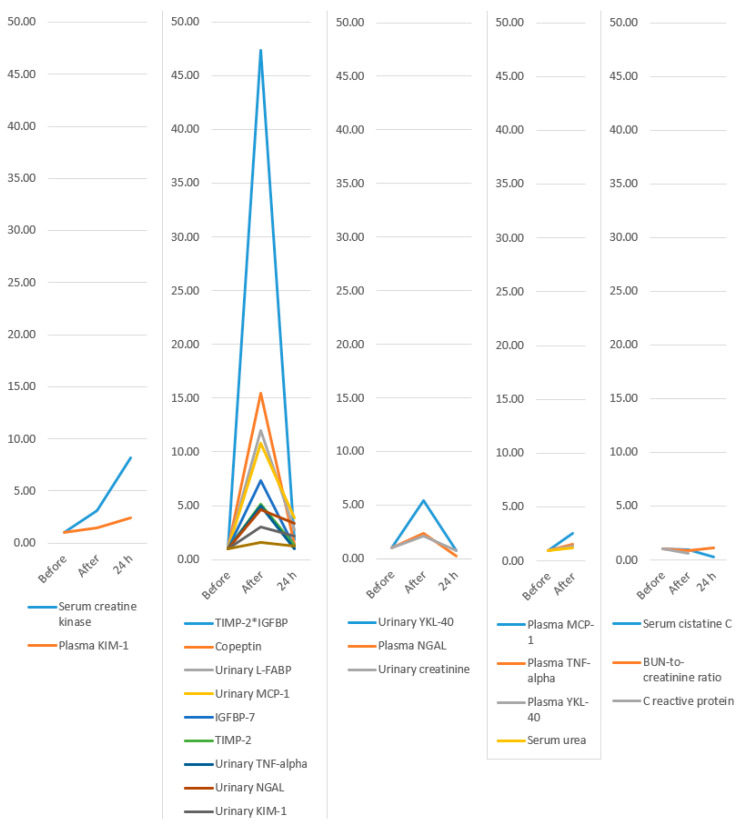 Figure 8
Peer Reviews
No public reviews on file for this paper yet. If you reviewed it on a platform where reviews are public (OpenReview, ICLR, NeurIPS, ICML), you can paste yours below so the community can read it here.
Videos
No videos yet. Explain this paper in a talk, walkthrough, or lecture? Add one.
Taxonomy
TopicsAcute Kidney Injury Research · Trauma, Hemostasis, Coagulopathy, Resuscitation · Chronic Kidney Disease and Diabetes
1. Introduction
Recently, running has gained popularity [1,2,3]. Long-distance running is one of the forms of running, and can include half marathons, marathons, and ultramarathons. Physical activity is acknowledged as a health-protective factor [2,4]. Nevertheless, long-distance running can induce high stress on different organs and systems [5,6]. Studies have found out that the kidneys can be affected during a marathon. Some runners may experience stage 1 acute kidney injury (AKI) [7,8]. AKI is defined as an unexpected and often temporary decline in kidney function, as indicated by a rise in creatinine or a fall in urine volume [9]. Stage 1 AKI is defined by KDIGO as a rise in serum creatinine by ≥0.3 mg/dL within 48 h, or a rise up to 1.5–1.9 times baseline within the prior 7 days, or a decrease in urine excretion <0.5 mL/kg/h for 6–12 h [10]. These episodes are mainly reversible, but when repeated, or maybe in cases with comorbidities or in the presence of other risk factors, a long-term renal injury can happen [11]. It is yet uncertain if recurrent renal insults that fit the criteria of AKI cause an accelerated development of long-term renal problems in long-distance running [12]. In addition to serum creatinine and urine output, there are many biomarkers for AKI. A classification by Oh et al. [13] identifies three main categories: functional biomarkers: serum creatinine, serum cystatin C (sCys C); tubular enzymes; damage biomarkers: urinary Neutrophil Gelatinase-Associated Lipocalin (uNGAL), and serum NGAL (sNGAL), urinary Kidney Injury Molecule-1 (uKIM-1), Interleukin 18, urinary liver-type fatty acid binding protein (uL-FABP); and pre-injury phase biomarkers: urinary Tissue Inhibitor of Metalloproteinases-2 (uTIMP-2) and urinary Insulin-like Growth Factor Binding Protein-7 (uIGFBP-7).
Although many observational studies have shown biomarker modifications after a marathon, no systematic synthesis has assessed the biomarkers’ temporal patterns and diagnosis over time.
The study aimed to investigate changes in urinary, serum, and plasma biomarkers indicative of acute kidney injury in individuals participating in marathons. The objectives were as follows: to measure changes in renal biomarker levels before, immediately after, and 24 h post-marathon; to identify promising biomarkers for the diagnosis of acute kidney injury; and to describe the temporal patterns of biomarker dynamics in relation to the marathon.
2. Materials and Methods
The present manuscript followed the “Preferred Reporting Items for Systematic Reviews and Meta-analyses Protocols (PRISMA)” [14].
2.1. Eligibility Criteria
We included prospective and retrospective observational studies involving (P) individuals who participated in (I) running a marathon, with the primary outcome (O) being the changes in urinary, serum, or plasma biomarkers that may be indicative of acute kidney injury (serum creatinine, urinary creatinine, BUN-to-creatinine ratio, serum urea, TIMP-2, IGFBP-7, TIMP-2*IGFBP, urinary L-FABP, urinary NGAL, plasma NGAL, serum cystatin C, plasma KIM-1, urinary KIM-1, plasma TNF-alpha, urinary TNF-alpha, plasma MCP-1, urinary MCP-1, plasma YKL-40, and urinary YKL-40). Secondary outcomes included serum C-reactive protein, copeptin, and serum creatine kinase. Studies involving other types of marathons (e.g., half-marathon, ultramarathon, or other distances), as well as reviews, meta-analyses, editorials, letters to the editor, and conference abstracts, were excluded.
2.2. Information Sources
To identify studies that met our selection criteria, we searched four databases: PubMed, EMBASE, Web of Science, and LILACS. Additionally, the reference lists of the selected articles and reviews were examined to identify further relevant studies.
2.3. Search Strategy
The search strategy included the following terms: acute kidney injury and marathon, as well as the relevant biomarkers, using MeSH terms, synonyms, singular and plural forms, and abbreviations. The search was conducted from inception until 29 May 2024. No language restrictions were applied in the search strategies or in the selection of articles. The complete search strategy for each database is provided in Supplementary Table S1.
2.4. Selection Process
An initial semi-automated removal of duplicate studies was performed using Zotero version 7.0.11 (Corporation for Digital Scholarship, Vienna, VA, USA) [15]. Subsequently, titles and abstracts were manually screened to exclude articles that did not meet the eligibility criteria, as well as any remaining duplicates. Full-text versions of the remaining articles were then manually reviewed by two authors (D.-C.L., L.-I.T.), and irrelevant studies, non-eligible article types, and duplicates were excluded.
2.5. Data Collection Process
From each selected study, data was manually extracted by several authors (D.-C.L., L.-I.T., O.A., Ș.L.P., and A.I.). The information included study characteristics, country, region, marathon location, study design, age, percentage of female marathon participants (sex), body mass index, the marathon event, previous marathons completed, weekly running distance (km/week), running history (years), AKI criteria, AKI stage 1 reporting, and values of urinary, serum, and plasma biomarkers, and indicators of acute kidney injury.
2.6. Effect Size
For each outcome, the mean and standard deviation were extracted. When this data was unavailable, values were estimated from the median and interquartile range using formulas provided in the Cochrane Handbook [16]. The effect size of interest was represented by the mean values of the biomarkers. Measurements were collected at three time points: before the marathon, immediately after the marathon, and 24 h post-marathon.
2.7. Risk of Bias Assessment
Several authors assessed the methodological quality (D.-C.L., O.A., Ș.L.P., and A.I.) of the selected articles with the quality assessment tool for before and after (pre–post) studies with no control group from the National Heart, Lung, and Blood Institute (NHLBI) [17]. In addition to the questions in the NHLBI assessment tool, we added 4 supplementary original questions to broaden and clarify the risk of bias assessment: Clear exclusion criteria for the following: alcohol or food abstinence 12 h before baseline measurement; exclusion of comorbidities that could alter measurements; exclusion of medication that could alter measurements; and presenting the use of water, electrolytes, or food during the marathon.
2.8. Synthesis Methods
Means and standard deviations were entered into meta-analyses using the meta package in R [18]. Due to clinical heterogeneity among studies, the mean and 95% confidence intervals (CIs) for each variable were calculated using a random-effects model. Results were presented as forest plots. The chi-squared-based Q test and the I^2^ statistic were used to assess statistical heterogeneity between studies. Statistical significance was defined as a p-value less than 0.05. All analyses were performed using R statistical software, version 4.3.2 (R Foundation for Statistical Computing, Vienna, Austria) [19].
2.9. Assessment of Publication Bias
Publication bias was assessed using Egger’s test.
During the preparation of this manuscript, the authors used ChatGPT version 4.0 (OpenAI, San Francisco, CA, USA, accessed in June 2025) as a brainstorming tool to generate suggestions for perspectives to include in the Discussion section. Also, it was used to improve the scientific writing of the manuscript. The authors have reviewed and edited the output and take full responsibility for the content of this publication.
A protocol for the publication can be found at protocols.io with the ID 225510 (registered on 26 August 2025).
3. Results
A total of 119 records were retrieved from the four databases searched, and one additional study was identified through reference screening of the selected articles. The identification and selection process is illustrated in Figure 1. After removing 37 duplicates, 83 records were screened based on title and abstract. Of these, 68 were excluded for not meeting the eligibility criteria or being duplicates. The full texts of the remaining 15 articles were then assessed, resulting in the inclusion of 9 studies in the final review and meta-analysis.
3.1. Study Characteristics
The characteristics of the included studies are detailed in Table 1 and Table 2. Five studies were conducted in Europe, and four in America. All studies employed a prospective cohort design. Acute kidney injury among marathon runners was diagnosed based on the RIFLE, AKIN, or KDIGO criteria. The mean age of participants varied across studies, with several reporting a mean age of around 40 years. However, one study included younger participants with a mean age of 23 years, while another reported a higher mean age of 50 years. Two studies included only male participants. In five studies, the proportions of male and female participants were approximately equal, while in two others, the percentage of female participants was 18% and 29%, respectively. Previous marathon experience, weekly running distance, and running history (in years) also varied across the studies.
3.2. Most Frequently Reported Biomarkers
Serum creatinine was the most frequently reported biomarker. Its mean value before the marathon was 0.88 mg/dL (95% CI: 0.85–0.92), it increased immediately after the marathon to 1.38 mg/dL (95% CI: 1.04–1.71), and decreased at 24 h post-marathon to 1.12 mg/dL (95% CI: 0.64–1.61) (Figure 2). Heterogeneity of the results was substantial, with I^2^ inconsistency indices of 85%, 98%, and 98% for the three respective time points, all statistically significant.
Another frequently reported biomarker was serum creatine kinase. The mean value before the marathon was 138.31 U/L (95% CI: 105.12–171.5), which increased threefold immediately after the marathon to 425.8 U/L (95% CI: 290.88–560.71), and rose even further at 24 h post-marathon—approximately an eightfold increase compared to baseline—to 1128.14 U/L (95% CI: 434.02–1822.26) (Figure 3). Heterogeneity was substantial, with I^2^ inconsistency values of 75%, 89%, and 84% for the three respective time points, all statistically significant.
The most frequently reported urinary biomarker was urinary Neutrophil Gelatinase-Associated Lipocalin (uNGAL). The mean value before the marathon was 8.92 ng/mL (95% CI: 6.11–11.73), which increased substantially—approximately fourfold—immediately after the marathon to 41.30 ng/mL (95% CI: 31.74–50.87), and decreased to 29.57 ng/mL (95% CI: –0.81 to 59.94) at 24 h post-marathon, remaining approximately three times higher than baseline (Figure 4). Heterogeneity was moderate before and immediately after the marathon (I^2^ = 47% and 33%, respectively), and considerable at 24 h post-marathon (I^2^ = 99%), with only the latter being statistically significant.
Another reported urinary biomarker was urinary Kidney Injury Molecule-1 (uKIM-1). The mean value before the marathon was 755.02 pg/mL (95% CI: –474.24 to 1984.29), which increased significantly—approximately threefold—immediately after the marathon to 2255.64 pg/mL (95% CI: 827.69 to 3683.6), and then decreased at 24 h post-marathon to 1630.76 pg/mL (95% CI: –367.39 to 3628.9), remaining about twice as high as baseline (Figure 5). Heterogeneity of the results was considerable at all three time points, with I^2^ values of 97%, 93%, and 96%, respectively, all statistically significant.
Another reported biomarker was serum cystatin C. The mean value before the marathon was 0.39 mg/L (95% CI: –0.21 to 0.99), followed by a slight decrease immediately after the marathon to 0.36 mg/L (95% CI: –0.11 to 0.83), and a further, more pronounced decrease at 24 h post-marathon to 0.10 mg/L (95% CI: 0.06–0.15), representing roughly one-quarter of the baseline level (Figure 6). Heterogeneity was considerable at all three time points, with I^2^ values of 100%, 100%, and 99%, respectively—all statistically significant.
Another reported biomarker was C-reactive protein (CRP). The mean value before the marathon was 0.93 mg/L (95% CI: 0.03–1.82), which decreased immediately after the marathon to 0.59 mg/L (95% CI: 0.08–1.10) (Figure 7). Heterogeneity of the results was considerable for both measurements, with I^2^ values of 96% and 95%, respectively, both statistically significant.
3.3. Other Biomarkers
The mean urinary creatinine level before the marathon was 134.28 mg/dL (95% CI: 4.9–263.66) (Supplementary Table S2). It nearly doubled immediately after the marathon, reaching 283.09 mg/dL (95% CI: 127.91–438.27) (Supplementary Table S3), and then decreased at 24 h post-marathon to 103.74 mg/dL (95% CI: 79.5–127.97), falling below baseline levels (Supplementary Table S4).
The mean blood urea nitrogen-to-creatinine (BUN/Cr) ratio was 17.33 (95% CI: 15.68–18.98) before the marathon (Supplementary Table S2), decreased slightly to 15.33 (95% CI: 13.72–16.95) immediately after the marathon (Supplementary Table S3), and rose modestly above baseline to 19.33 (95% CI: 16.75–21.92) at 24 h post-marathon (Supplementary Table S4).
The mean serum urea level before the marathon was 35.2 mg/dL (95% CI: 31.2–39.2) (Supplementary Table S2), and it increased immediately after the marathon to 43.2 mg/dL (95% CI: 38.97–47.43) (Supplementary Table S3).
The mean value of TIMP-2 before the marathon was 2.4 ng/mL (95% CI: 2.15–2.65) (Supplementary Table S2). It rose markedly—by approximately fivefold—immediately after the marathon to 12.4 ng/mL (95% CI: 10.39–14.41) (Supplementary Table S3), and then decreased at 24 h post-marathon to 3.2 ng/mL (95% CI: 2.26–4.14), approaching baseline levels (Supplementary Table S4).
The mean value of IGFBP-7 before the marathon was 32.3 ng/mL (95% CI: 27.06–37.54) (Supplementary Table S2). It increased substantially—approximately sevenfold—immediately after the marathon to 236.6 ng/mL (95% CI: 188.33–284.87) (Supplementary Table S3), and decreased at 24 h post-marathon to 36.5 ng/mL (95% CI: 21.27–51.73), returning close to baseline levels (Supplementary Table S4).
The mean value of the TIMP-2*IGFBP-7 product before the marathon was 0.1 (95% CI: 0.08–0.12) (Supplementary Table S2). It increased dramatically—by 47 times—immediately after the marathon to 4.74 (95% CI: 2.92–6.56) (Supplementary Table S3), then decreased to 0.18 (95% CI: 0.07–0.29) at 24 h post-marathon, remaining nearly double the baseline value (Supplementary Table S4).
The mean urinary L-FABP (liver-type fatty acid binding protein) value before the marathon was 0.23 ng/mL (95% CI: 0.11–0.34) (Supplementary Table S2). It increased significantly—approximately twelve-fold—immediately after the marathon to 2.76 ng/mL (95% CI: 2.06–3.46) (Supplementary Table S3), then decreased at 24 h post-marathon to 0.63 ng/mL (95% CI: 0.38–0.88), roughly three times the baseline level (Supplementary Table S4).
The mean plasma NGAL value before the marathon was 43 ng/mL (95% CI: –25.75 to 111.76) (Supplementary Table S2). It doubled immediately after the marathon, reaching 100.68 ng/mL (95% CI: –5.57 to 206.94) (Supplementary Table S3), and then dropped substantially at 24 h post-marathon to 10.7 ng/mL (95% CI: 7.8–13.6), approximately one-quarter of the initial value (Supplementary Table S4).
The mean plasma KIM-1 value before the marathon was 1123.44 pg/mL (95% CI: –944.39 to 3191.26) (Supplementary Table S2). It increased immediately after the marathon to 1682.08 pg/mL (95% CI: –1453.4 to 4817.57) (Supplementary Table S3), and rose further at 24 h post-marathon to 2700 pg/mL (95% CI: 2072.81–3327.19), approximately double the baseline value (Supplementary Table S4).
The mean copeptin level before the marathon was 3.08 pmol/L (95% CI: 2.84–3.33) (Supplementary Table S2). It increased dramatically—about 15-fold—immediately after the marathon to 47.53 pmol/L (95% CI: 24.86–70.2) (Supplementary Table S3), and then decreased at 24 h post-marathon to 4.44 pmol/L (95% CI: 3.05–5.83), approaching the initial level (Supplementary Table S4).
The mean plasma TNF-alpha level before the marathon was 1.76 pg/mL (95% CI: 1.58–1.94) (Supplementary Table S2), and it increased after the marathon to 2.7 pg/mL (95% CI: 2.43–2.97) (Supplementary Table S3).
The mean urinary TNF-alpha value before the marathon was 0.02 pg/mL (95% CI: 0.01–0.03) (Supplementary Table S2). It increased fivefold immediately after the marathon to 0.1 pg/mL (95% CI: 0.05–0.15) (Supplementary Table S3), then decreased at 24 h post-marathon to 0.02 pg/mL (95% CI: 0.01–0.03), returning to baseline levels (Supplementary Table S4).
The mean plasma MCP-1 level before the marathon was 153.41 pg/mL (95% CI: 142.44–164.38) (Supplementary Table S2), and it doubled immediately after the marathon to 392.31 pg/mL (95% CI: 335.95–448.66) (Supplementary Table S3).
The mean urinary MCP-1 level before the marathon was 53.03 pg/mL (95% CI: 38.05–68.00) (Supplementary Table S2). It increased substantially—approximately tenfold—immediately after the marathon to 574.3 pg/mL (95% CI: 79.02–1069.59) (Supplementary Table S3), and then decreased at 24 h post-marathon to 202.98 pg/mL (95% CI: 100.04–305.91), remaining about four times higher than the baseline value (Supplementary Table S4).
The mean plasma YKL-40 level before the marathon was 29.33 ng/mL (95% CI: 23.04–35.63) (Supplementary Table S2), and it increased immediately after the marathon to 40.04 ng/mL (95% CI: 34.19–45.9) (Supplementary Table S3).
The mean urinary YKL-40 level before the marathon was 282.66 pg/mL (95% CI: –114.39 to 679.71) (Supplementary Table S2). It increased markedly—approximately fivefold—immediately after the marathon to 1530.34 pg/mL (95% CI: 361.32–2699.36) (Supplementary Table S3), and then decreased at 24 h post-marathon to 219.23 pg/mL (95% CI: 105.68–332.78), slightly below the initial value (Supplementary Table S4).
3.4. Identification of Biomarker Trends
The temporal evolution of biomarker levels is illustrated in Figure 8 and detailed in Table 3.
3.5. Risk of Bias Assessment
We assessed the methodological quality of the selected articles (Table 4) with the quality assessment tool for before and after (pre–post) studies with no control group from the National Heart, Lung, and Blood Institute [21]. All the studies presented a clear question or study objective, and had eligible participants for the intervention (marathon) who were all enrolled in the study. All the studies had the marathon as an intervention, and only participants who finished it were included. The outcome measures were prespecified, clearly defined, valid, reliable, and assessed consistently across all study participants in all studies since there were biomarker measurements from blood, serum, plasma, or urine samples. The blinding of outcome measurements was not reported in any study, but being a laboratory measurement, there is no risk of bias. Only one study reported the sample size calculation, and that it was sufficient to provide confidence in the results, but it was performed after the data collection. Nevertheless, statistically significant results indicate that the sample size was enough for the purpose. The loss to follow-up after baseline was 20% or less in six studies, in two studies it was above 20%, and one study did not report this information. All but one study (88.9%) presented correct statistical methods for pair-wise comparisons between repeated measurements. Nevertheless, our review could not include the comparison for repeated measurements since the data for this was not reported (e.g., stating only that the p-value was less than a limit, without reporting the actual p-value, or confidence interval, or standard deviation of the change), thus the choice of test did not impact our results. All the studies used multiple measurements: at baseline, immediately after the marathon, and 24 h, or later, after the marathon. The intervention was conducted at a group level, but the statistical analysis considered the use of individual-level data, which is appropriate. Seven (77.8%) clearly presented the selection criteria. Four supplementary questions were assessed in addition to those in the NHLBI assessment tool. Only one study used clear exclusion criteria for eating food or alcohol consumption before the baseline measurement. Seven (77.8%) studies clearly excluded comorbidities that could have altered the measurements. Four studies (44.4%) clearly indicated the exclusion of participants who took medication (e.g., anti-inflammatory drugs) that could have altered the measurements. Only two studies (22.2%) presented the use of water, electrolytes, and food during the marathon.
4. Discussion
Our systematic review and meta-analysis succeeded in achieving its objectives. Most biomarkers showed an increase in value immediately after the marathon compared to pre-marathon levels. The largest increases (as a multiple of the baseline value) were observed for TIMP-2*IGFBP (47-fold), copeptin (15-fold), urinary L-FABP (12-fold), urinary MCP-1 (10-fold), IGFBP-7 (7-fold), urinary YKL-40 (5-fold), and TIMP-2 (5-fold). These may represent the most promising biomarker candidates for future research and potential clinical application. Several patterns of biomarker evolution were observed: some increased without decreasing even at 24 h after the marathon (serum creatine kinase and plasma KIM-1); others increased post-marathon and decreased at 24 h while remaining above baseline (TIMP-2IGFBP, copeptin, urinary L-FABP, urinary MCP-1, IGFBP-7, TIMP-2, urinary TNF-alpha, urinary NGAL, urinary KIM-1, and serum creatinine); some increased after the marathon and then fell below baseline at 24 h (urinary YKL-40, plasma NGAL, and urinary creatinine); a few increased post-marathon with no available 24 h data (plasma MCP-1, plasma TNF-alpha, plasma YKL-40, and serum urea); and others decreased immediately post-marathon below baseline (serum cystatin C, which decreased further at 24 h; BUN-to-creatinine ratio, which increased above baseline at 24 h; and C-reactive protein, for which no 24 h values were available).
The data provided by the studies did not allow for statistical testing to determine whether there were significant differences before and after the marathon. Most studies reported statistical test results, which were statistically significant for most of the evaluated biomarkers. Even though change data were not available for meta-analysis, the magnitude of the observed changes from baseline suggests that a meta-analysis including such data would have likely yielded statistically significant results.
This is the first systematic review with meta-analysis focusing on AKI biomarkers. Thus, it adds a quantitative perspective on the topic, coupled with a bird’s-eye view comparison of the most important increases in biomarkers in AKI. We standardized the evolution of biomarkers to be able to make comparisons between them possible. We found that some of them had very important increases immediately after the marathon. Increases over tenfold were observed for TIMP-2*IGFBP, copeptin, uL-FABP, and uMCP-1. Increases over 5-fold were observed for IGFBP-7, uTNF-alpha, and uYKL-40. Increases over 2.5-fold were observed for sCrK, uNGAL, uKIM-1, and pMCP-1. The others had lower increases: pKIM-1, sCr, pNGAL, uCr, pTNF-alpha, pYKL-40, and serum urea. Lastly, there were some biomarkers that diminished after the marathon: sCys C, BUN/Creatinine ratio, and C-reactive protein.
During the marathon, the intense exercise has several effects. One is the reduction in blood flow in the kidney [27] that can induce ischemia, which comes with a plethora of modified biomarkers. Dehydration is another factor that can induce ischemia. Another effect is the increase in the core temperature during running [28]. A quasi-randomized controlled trial showed how increased core temperature and dehydration increase the risk of AKI [29]. ATP depletion is a hypothesized mechanism of AKI [30].
TIMP-2IGFBP was the most sensitive biomarker of the ones observed. Tissue inhibitor of metal proteinase 2 is a member of a family of proteins, named the TIMP family [31]. These proteins include matrix metalloproteinases, which are peptidases. TIMP-2 is an important modulator of extracellular matrix turnover and contributes to several physiological and pathological processes, including kidney damage and healing [32]. Although IGFBP-7 is part of the insulin-like growth factor (IGF) binding protein family, it has roles in addition to not being related to IGF. It causes the inhibition of cell growth and cell apoptosis by activating a specific pathway (ERK1/2) [33]. The combination of the two biomarkers known as TIMP-2IGFBP, and its assessment as a diagnostic utility was first presented by Kashani et al. 2013 [34].
Copeptin had the second most important change, and only one study assessed its evolution [8]. Copeptin is a peptide used as a marker of vasopressin secretion. It is used for diagnosis and prognosis of different diseases, including renal disease [35]
L-FABP had the third most important change immediately after the marathon. It is produced in renal proximal tubular cells and released into the urine in reaction to tubular hypoxia [36]. In addition to its renal secretion, L-FABP can be produced by the liver, too. Studies have shown that the urinary L-FABP can be used as a marker of kidney injury, specifically since it is independent of the serum values due to its liver production [37]
MCP-1 had the fourth most important change immediately after the marathon. Monocyte chemoattractant protein-1 belongs to the CC chemokine family. It plays an important role in the inflammatory process by drawing in or promoting the expression of other inflammatory cells and molecules [38]. MCP-1 has been shown to be associated with a rise in renal monocyte infiltration [39]. After renal ischemia–reperfusion damage, MCP-1 prevents the kidney from the immediate inflammatory response [40].
TNF alpha belongs to the TNF family that includes TNF alpha, beta, CD40 ligand, and others [41]. All these are cytokines with roles in inflammation, apoptosis, and tumor lysis. Macrophages are the main source of TNF alpha, though other cells can produce it too. TNF alpha is implicated in numerous functions: inducing fever, apoptosis, necrosis, tumor genesis, progression, and systemic inflammatory reactions [41]. Higher levels of urinary TNF alpha were observed in participants with acute interstitial nephritis [42]. Also, polymorphisms of TNF alpha were seen as predictive of acute kidney injury [43].
YKL-40 is a glycoprotein from the chitinase protein family [44], although it lacks chitinase activity [45]. It is secreted by many cell types, including macrophages, neutrophils, vascular smooth muscle cells, and chondrocytes [45]. It is implicated in many inflammatory diseases, including infections, cardiovascular, neurologic, respiratory, gastrointestinal, urinary, musculoskeletal, immunological, and endocrinological diseases [46]. YKL-40 levels increase after kidney injury (e.g., after transplantation) [47].
Two studies were performed only on male participants, and in two others, the percentage of female participants was 18% and 29%, respectively. In five (more than half) of the included studies, the proportions of male and female participants were approximately equal (with a slightly higher prevalence in females). Thus, some studies had male prevalence, and others were similarly represented. Nevertheless, we recognize that there are differences in the function of sex concerning physiology. These can influence the levels and the evolution in time of certain biomarkers based on sex. Women usually have lower serum creatinine levels [48] due to less muscle volume. Also, the sex hormones may influence the renal responses to exercise. Despite these differences, the mechanisms of exercise-induced kidney stress, such as transient hypoperfusion, dehydration, and oxidative stress, are likely present in both sexes.
4.1. Limitations
Statistical heterogeneity of the results was substantial, or considerable, and statistically significant in most of the analyses where it could be calculated. This can be explained by clinical heterogeneity among the included studies: differences in participants’ age, sex distribution, genetic predisposition, prior participation in marathon events, previous health condition, athlete type (professional or recreational), training volume and frequency (weekly running distance and duration), possible comorbidities that were not excluded, use of anti-inflammatory medications (e.g., NSAID), fluid (hydration status), electrolytes and food intake (before and during the marathon), environmental temperature during the event, and course difficulty (flat vs. uphill or downhill terrain).
None of the included studies performed adjusted analyses to account for potential confounding variables, such as those mentioned above as sources of variability. This may introduce a risk of confounding. Biomarker measurements were conducted using appropriate techniques, so measurement error at the sample level is unlikely. The laboratory measurements were not clearly reported, if they were blinded. Nevertheless, by being objective assessments, the risk of bias is avoided. However, the timing of measurement was inconsistent, particularly for the pre-marathon assessment. In some studies, baseline measurements were taken on the day of the marathon, while in others, they were obtained in the days, or even weeks, before. Of course, the participants were most likely healthy individuals, and we would expect limited variability in biomarker levels over time, reducing the likelihood of significant bias.
Some biomarkers, such as copeptin and IGFBP-7, were assessed in only one or two studies in our review. Thus, while their change post-marathon was important, the confidence in the results remains cautious. These findings should be viewed as exploratory and sources of hypotheses and not confirmatory.
4.2. Study Strengths
This study provides valuable insights into the early diagnosis of acute kidney injury in marathon runners using a wide range of biomarkers. These findings may support the role of the studied biomarkers in AKI. Moreover, it shows the comparative evolution of biomarkers during and after a marathon run. This can suggest which one of the biomarkers might be more sensitive to identifying AKI.
Currently, the use of kidney injury biomarkers in marathon runners is only an area of research. Future integration of these biomarkers for real-time or field screening of marathon runners for AKI would come with some challenges: costs of the analyses, the use of laboratories, the time to do the analysis and to obtain the result, and the availability of the marathon runners to be evaluated. For some biomarkers, such as urinary NGAL [49] or TIMP-2*IGFBP-7 [50], rapid tests were developed that are now used in some critical care units. These might be more feasible to be used in the framework of a marathon race at the end, and not in real-time, since the test is based on urine samples and requires 10–20 min to provide a result. Since most of the biomarkers return to their baseline values, the necessity of performing the tests on all marathon runners is limited. A pragmatic approach could be the identification of participants at high risk for AKI based on a questionnaire screening before the marathon, and performing these tests on this subgroup. If future portable tests were developed, then they could be used in real-time for high-risk participants.
Future research could focus on evaluating the long-term effects of repeated marathon participation. Expanding the study to include other types of endurance events and a larger sample size could offer a more comprehensive understanding of the impact of intense physical exertion on kidney function. Including other markers, such as oxidative stress and antioxidant protection enzymes, might be another venue of study. Animal studies can provide additional information in a controlled setting to complete the picture of evidence obtained in human studies.
5. Conclusions
The study showed significant increases in most biomarkers immediately after the marathon compared to baseline values. The largest increases were observed in TIMP-2*IGFBP, copeptin, urinary L-FABP, urinary MCP-1, IGFBP-7, urinary YKL-40, and TIMP-2, suggesting that these biomarkers are promising candidates for future research. Several patterns of biomarker evolution were observed: some increased without decreasing even at 24 h after the marathon (serum creatine kinase and plasma KIM-1); others increased post-marathon and decreased at 24 h while remaining above baseline (TIMP-2IGFBP, copeptin, urinary L-FABP, urinary MCP-1, IGFBP-7, TIMP-2, urinary TNF-alpha, urinary NGAL, urinary KIM-1, and serum creatinine); and some increased after the marathon and then fell below baseline at 24 h (urinary YKL-40, plasma NGAL, and urinary creatinine).
The reference list from the paper itself. Each links out to its DOI / PubMed record.
- 1Zuo Y. Zou L. Zhang M. Smith L. Yang L. Loprinzi P.D. Ren Z. The Temporal and Spatial Evolution of Marathons in China from 2010 to 2018 Int. J. Environ. Res. Public Health 201916504610.3390/ijerph 1624504631835745 PMC 6950243 · doi ↗ · pubmed ↗
- 2Zhu H. Han X. Miao G. Yan Q. A Preliminary Exploration of the Regression Equation for Performance in Amateur Half-Marathon Runners: A Perspective Based on Respiratory Muscle Function Front. Physiol.202415134051310.3389/FPHYS.2024.134051338590694 PMC 10999560 · doi ↗ · pubmed ↗
- 3Run Signup Annual Industry Report 2024 (Race Trends 2024)Available online: https://info.runsignup.com/wp-content/uploads/sites/3/2025/01/24-Race-Trends-08-Online-compressed.pdf(accessed on 20 August 2025)
- 4Hespanhol Junior L.C. Pillay J.D. van Mechelen W. Verhagen E. Meta-Analyses of the Effects of Habitual Running on Indices of Health in Physically Inactive Adults Sports Med.2015451455146810.1007/s 40279-015-0359-y 26178328 PMC 4579257 · doi ↗ · pubmed ↗
- 5Braschler L. Nikolaidis P.T. Thuany M. ChlíbkováD. Rosemann T. Weiss K. Wilhelm M. Knechtle B. Physiology and Pathophysiology of Marathon Running: A Narrative Review Sports Med. Open 2025111010.1186/s 40798-025-00810-339871014 PMC 11772678 · doi ↗ · pubmed ↗
- 6Scheer V. Tiller N.B. Doutreleau S. Khodaee M. Knechtle B. Pasternak A. Rojas-Valverde D. Potential Long-Term Health Problems Associated with Ultra-Endurance Running: A Narrative Review Sports Med.20225272574010.1007/s 40279-021-01561-334542868 PMC 8450723 · doi ↗ · pubmed ↗
- 7Mansour S.G. Verma G. Pata R.W. Martin T.G. Perazella M.A. Parikh C.R. Kidney Injury and Repair Biomarkers in Marathon Runners Am. J. Kidney Dis.20177025226110.1053/j.ajkd.2017.01.04528363731 PMC 5526736 · doi ↗ · pubmed ↗
- 8Mansour S.G. Martin T.G. Obeid W. Pata R.W. Myrick K.M. Kukova L. Jia Y. Bjornstad P. El-Khoury J.M. Parikh C.R. The Role of Volume Regulation and Thermoregulation in AKI during Marathon Running Clin. J. Am. Soc. Nephrol.2019141297130510.2215/CJN.0140021931413064 PMC 6730516 · doi ↗ · pubmed ↗