Multi-Channel Spectro-Temporal Representations for Speech-Based Parkinson’s Disease Detection
Hadi Sedigh Malekroodi, Nuwan Madusanka, Byeong-il Lee, Myunggi Yi

TL;DR
This paper introduces a new deep-learning method using multi-channel speech analysis to detect Parkinson’s Disease with high accuracy.
Contribution
A novel multi-channel spectro-temporal fusion approach for PD detection using CNNs and Vision Transformers is proposed and evaluated.
Findings
Fusing three time–frequency representations improves PD detection performance across different architectures.
EfficientNet-B2 achieved 84.39% accuracy and 84.35% F1-score, outperforming recent methods.
Emotionally salient and prosodically emphasized speech yields higher AUC, indicating better discriminability.
Abstract
Early, non-invasive detection of Parkinson’s Disease (PD) using speech analysis offers promise for scalable screening. In this work, we propose a multi-channel spectro-temporal deep-learning approach for PD detection from sentence-level speech, a clinically relevant yet underexplored modality. We extract and fuse three complementary time–frequency representations—mel spectrogram, constant-Q transform (CQT), and gammatone spectrogram—into a three-channel input analogous to an RGB image. This fused representation is evaluated across CNNs (ResNet, DenseNet, and EfficientNet) and Vision Transformer using the PC-GITA dataset, under 10-fold subject-independent cross-validation for robust assessment. Results showed that fusion consistently improves performance over single representations across architectures. EfficientNet-B2 achieves the highest accuracy (84.39% ± 5.19%) and F1-score (84.35% ±…
Genes, proteins, chemicals, diseases, species, mutations and cell lines named across the full text — each resolved to its canonical identifier and authoritative record.
Click any figure to enlarge with its caption.
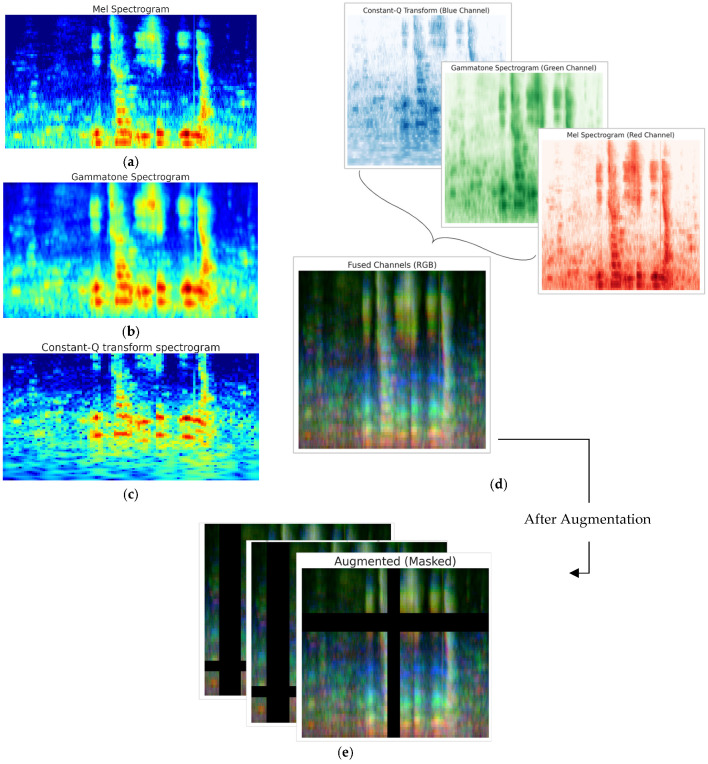 Figure 1
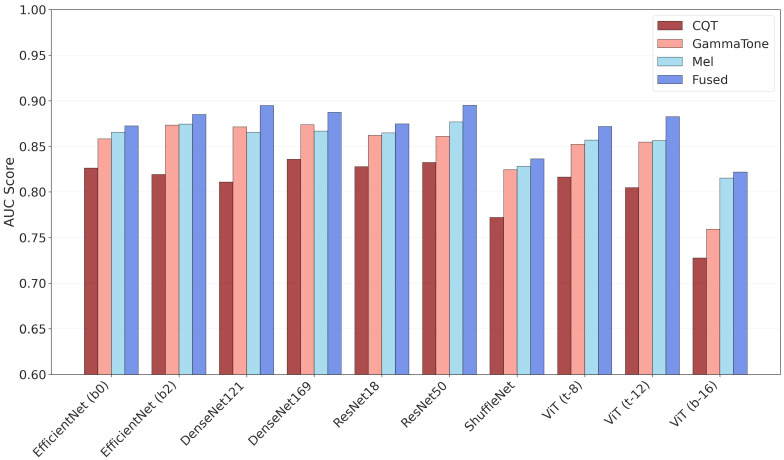 Figure 2
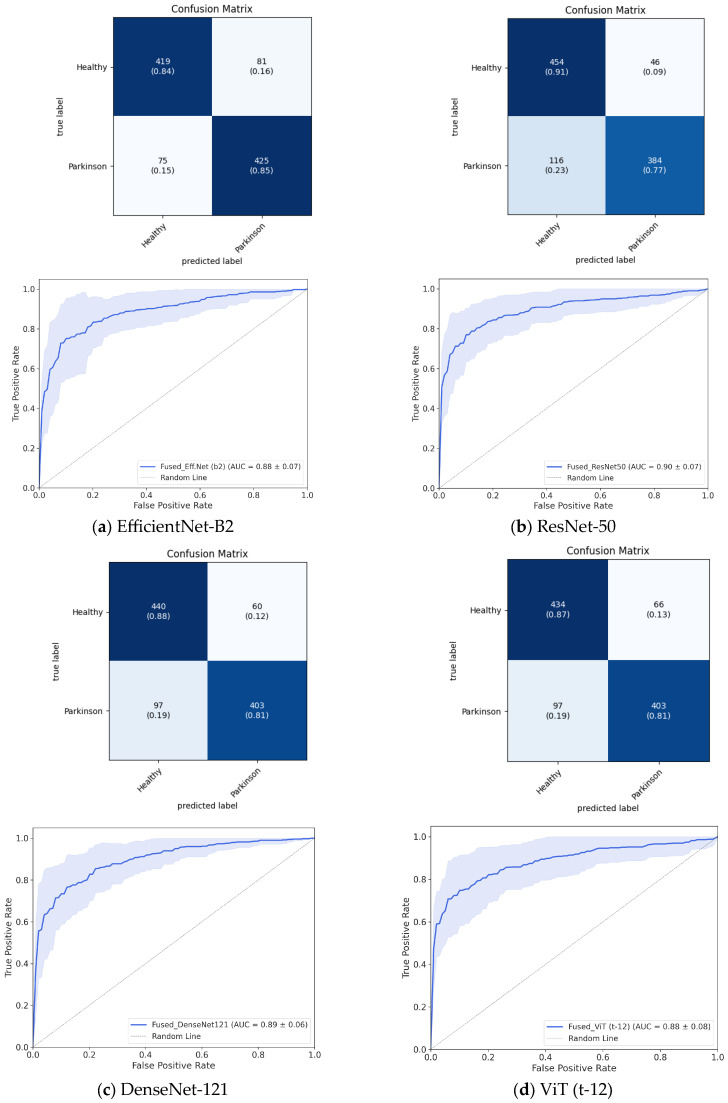 Figure 3
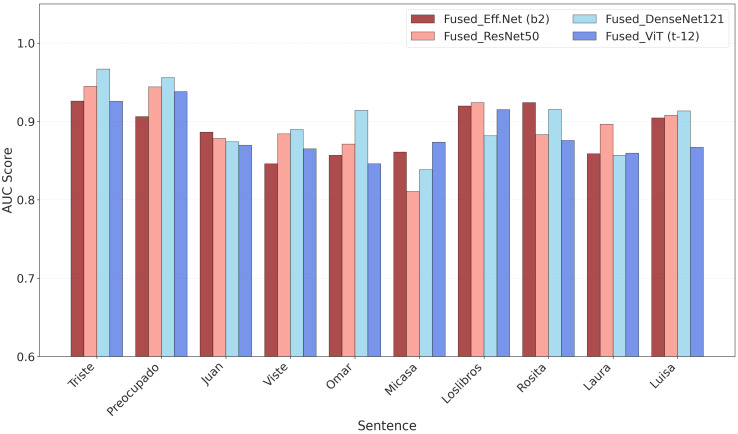 Figure 4
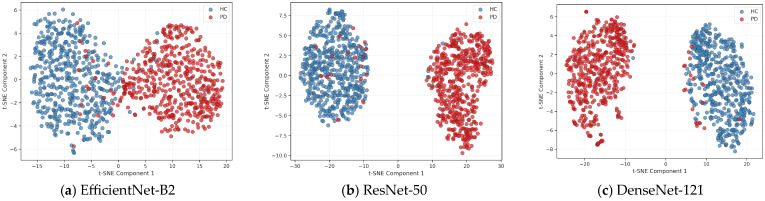 Figure 5
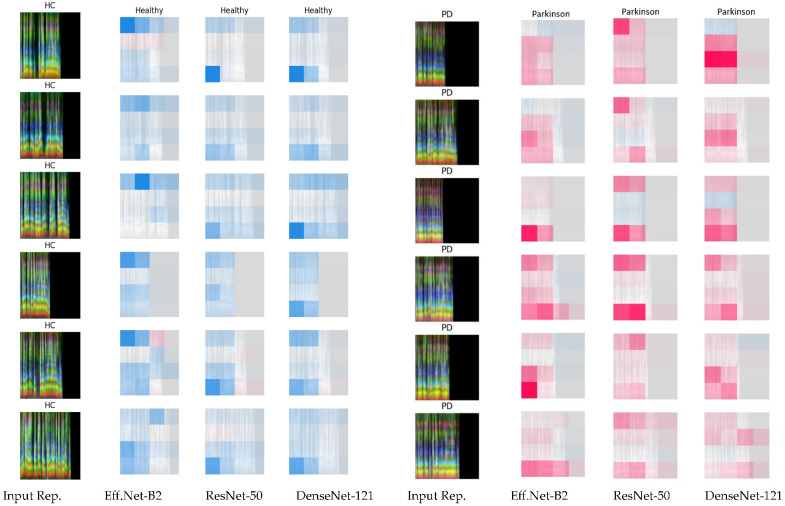 Figure 6
- —National Research Foundation of Korea (NRF)
- —Ministry of Science and ICT
Peer Reviews
No public reviews on file for this paper yet. If you reviewed it on a platform where reviews are public (OpenReview, ICLR, NeurIPS, ICML), you can paste yours below so the community can read it here.
Videos
No videos yet. Explain this paper in a talk, walkthrough, or lecture? Add one.
Taxonomy
TopicsVoice and Speech Disorders · Speech and Audio Processing · Music and Audio Processing
1. Introduction
Parkinson’s Disease (PD) is the second most common neurodegenerative disorder, affecting more than 10 million individuals worldwide [1,2]. While best known for its motor symptoms, such as tremor, rigidity, and bradykinesia, PD also commonly involves speech impairments, which occur in up to 90% of patients during the course of the disease [3]. These impairments typically manifest as reduced vocal intensity, monotonic pitch, imprecise articulation, and altered speech rhythm [4,5]. Notably, such vocal changes can appear in the early stages of PD, sometimes even before motor symptoms become clinically evident. This has led to a growing interest in speech analysis as a non-invasive, accessible, and cost-effective method for early diagnosis and continuous monitoring [5]. Unlike traditional diagnostic methods that rely on clinical evaluations, neuroimaging, or subjective scales such as the Unified Parkinson’s Disease Rating Scale (UPDRS) [6,7], voice-based analysis offers the potential for objective, remote, and scalable assessment [5].
Early efforts in speech-based PD detection primarily employed handcrafted acoustic features combined with classical machine-learning (ML) classifiers [2,8]. Govindu and Palwe [9] evaluated perturbation measures such as jitter and shimmer, along with spectral descriptors, to support early diagnosis using SVM and decision tree models. Wang et al. [10] introduced Mandarin speech datasets and highlighted the utility of phonation measures for population-specific modeling. Motin et al. [11] demonstrated the feasibility of smartphone-recorded phonemes by analyzing MFCCs and energy-based parameters, highlighting the potential for mobile health applications. Mamun et al. [12] investigated vocal feature-guided ML algorithms across multiple tasks. Similarly, Hireš et al. [13] examined cross-corpus generalization of MFCCs, prosodic descriptors, and perturbation measures, revealing the challenges of deploying models across different datasets. These studies confirmed the diagnostic value of handcrafted speech features but also exposed their limitations, including sensitivity to noise, dataset dependency, and reduced ability to capture higher-level temporal dynamics.
To address these limitations, recent efforts have turned to DL, which enables models to learn hierarchical feature representations directly from raw or preprocessed audio signals [14]. This approach reduces the reliance on domain-specific feature engineering and overcomes the limitations of traditional manual feature extraction used in conventional machine-learning (ML) methods [15,16]. Elumalai et al. [17] applied long short-term memory (LSTM) networks for non-invasive PD diagnosis and severity rating, demonstrating improved robustness over shallow classifiers. Hireš et al. [15] proposed a CNN ensemble trained on spectrograms derived from sustained vowels recordings, successfully capturing complex spectro-temporal patterns in PD speech. Quan et al. [16] proposed an end-to-end deep-learning framework that extracts time-series dynamic features using time-distributed 2D-CNNs applied to mel spectrogram inputs, followed by 1D-CNNs to capture temporal dependencies, eliminating the need for handcrafted feature descriptors. Rey Paredes et al. [18] showed that CNN-based and related deep models applied directly to raw voice waveforms, combined with an augmentation strategy, significantly improve the detection of PD in a large voice dataset. Moro-Velázquez et al. [19] provided a review on articulatory and phonatory aspects, highlighting the potential of DL to capture multidimensional vocal deficits. Costantini et al. [20] compared conventional ML and deep models, emphasizing the superiority of CNNs and transformers in modeling PD-related speech changes.
More recently, self-supervised and transformer-based models have gained prominence. Vaswani et al. [21] introduced the transformer architecture, which underpins modern speech representation learning. Tougui et al. [22] applied transformer-based transfer learning on self-reported recordings, demonstrating significant improvements in generalization. Klempir et al. [23] systematically ranked pretrained embeddings, showing that Wav2Vec 2.0 outperforms earlier models across languages and tasks. In another study, Klempíř and Krupička [24] investigated Wav2Vec 1.0 embeddings for cross-database detection, while Favaro et al. [25] compared interpretable speech features with deep embeddings, noting a trade-off between accuracy and interpretability. Hemmerling et al. [26] explored vision transformers (ViTs) applied to multilingual sustained vowels. Adnan et al. [27] recently proposed a fusion model that integrates semi-supervised speech embeddings, such as Wav2Vec 2.0, WavLM, and ImageBind, achieving strong performance across diverse populations and datasets.
Despite recent advances, much of the current literature continues to rely on raw audio or a single spectro-temporal representation, typically the mel spectrogram, for speech-based PD detection. However, integrating multiple spectro-temporal views, each capturing distinct aspects of the speech signal, remains a promising yet underexplored direction. Additionally, many studies focus primarily on sustained vowel phonations, which, while useful, may not fully capture the complexity of speech motor control affected in PD. Sentence-level speech tasks, which involve prosody, articulation, and respiratory coordination, offer a richer source of potential biomarkers but have received comparatively limited attention.
In this work, we propose a multi-channel spectro-temporal approach for speech-based PD detection, leveraging sentence-level speech to capture a broader range of motor and prosodic impairments. Our method fuses complementary time–frequency representations, mel spectrogram, constant-Q transform (CQT), and gammatone spectrogram, extracted from the same speech signal. To evaluate the effectiveness of the fused multi-channel input, we assess its performance across multiple DL architectures, including convolutional and transformer-based models. Beyond classification accuracy, interpretability is essential for clinical adoption. We therefore pair t-SNE (t-distributed stochastic neighbor embedding) [28] and SHapley Additive exPlanations (SHAP) [29] to provide complementary insights. t-SNE provides an overall view of the learned embedding space, and has been used in previous PD voice studies to explore how well classes are separated and how different datasets affect high-dimensional features [30]. In parallel, SHAP (SHapley Additive exPlanations) provides local, sample-wise attributions on our fused spectrogram inputs, highlighting time–frequency regions that most influence predictions. SHAP has been used to interpret PD voice models, rank salient acoustic features [31,32,33], and more broadly, in neurological speech applications [34,35]. Together, t-SNE (global structure) and SHAP (local attributions) offer a pragmatic interpretability toolkit for speech-based PD detection, helping to contextualize learned patterns while acknowledging that clinical validation of highlighted regions remains necessary.
Overall, our results indicate that the stacked multi-channel representation consistently enhances detection performance, highlighting its potential to capture a broader range of discriminative acoustic features relevant to PD.
2. Materials and Methods
2.1. Dataset
This study used the PC-GITA dataset [36], comprising voice recordings from 100 participants, 50 diagnosed with PD and 50 healthy controls (HC). The groups were balanced by gender (25 males and 25 females per group) and age-matched (mean ages: PD = 62.2 ± 11.2, HC = 61.2 ± 11.3, range 31–86 years). PD diagnoses were confirmed by neurologists, and control participants were screened to exclude neurodegenerative disorders. Recordings were acquired in a soundproof booth at Clínica Noel, Medellín, Colombia, sampled at 44.1 kHz with 16-bit resolution, then downsampled to 16 kHz for analysis. The dataset includes several speech tasks: sustained phonation of vowels (/a/, /e/, /i/, /o/, /u/), reading 25 Spanish words, reading a dialogue, reading sentences with emphasized words, and spontaneous speech. For this study, we focused on the sentence-reading task, where each participant produced 10 repetitions of a standardized set of Spanish sentences designed to assess articulation and prosody (see Supplementary Section S1), yielding a total of 1000 audio samples. Further dataset details are available in [36].
2.2. Data Preprocessing
To enhance model robustness and generalization despite the limited dataset size, we implemented a comprehensive preprocessing and augmentation pipeline. As illustrated in Figure S1, the original audio recordings varied in length. To standardize input across samples and enable batch processing, all clips were adjusted to a fixed duration of 5 s; shorter recordings were zero-padded to preserve their temporal structure, while longer ones were truncated only after initial silence removal to minimize loss of meaningful speech content. Preprocessing included resampling all recordings to 16 kHz to reduce computational cost while preserving speech quality, peak normalization for consistent volume levels, noise reduction, and trimming of leading and trailing silences based on a 30 dB energy threshold. To further enhance the model’s ability to generalize and prevent overfitting, data augmentation techniques were applied exclusively to the training set. This choice ensures that evaluation on validation sets reflects performance on unmodified audio data. Our on-the-fly augmentation pipeline dynamically applies transformations during training, including low-pass filtering (cutoff: 150–7500 Hz), frequency masking (≤30% of frequency bins), and time masking (≤30% of time steps), effectively expanding the training dataset without requiring additional storage (Figure 1e). These techniques introduce acoustic variations that encourage robust, invariant feature learning, rather than memorization of specific training examples.
2.3. Multi-Channel Feature Extraction
Following preprocessing, we extracted three complementary time–frequency representations from each audio clip to capture diverse spectral characteristics of speech, as illustrated in Figure 1. The first representation is the mel spectrogram (Figure 1a), computed using 64 mel filters with a 25 ms hamming window and a 10 ms hop length. This spectrogram was log-scaled and normalized to highlight perceptually important frequency components. The second representation is the gammatone spectrogram [37] (Figure 1b), which simulates cochlear filtering through a bank of 64 filters spaced according to the equivalent rectangular bandwidth (ERB) scale [38]. The spectrogram was computed with a 25 ms frame length and 10 ms hop size, then log-scaled and normalized. The third representation is the CQT [39] (Figure 1c), extracted using 84 bins spanning seven octaves with 12 bins per octave, providing fine-grained frequency resolution, particularly in the lower frequencies where PD speech deviations often occur [40].
These representations are commonly used in speech and audio signal processing to capture features like spectral characteristics. Each spectrogram was then resized to a common dimension of 224 × 224 pixels and then stacked along the channel dimension to form a three-channel tensor, analogous to an RGB image (Figure 1d). Although structured as a three-channel ‘image’, the inputs represent acoustically distinct representations rather than spatial color information, requiring models to learn cross-representation interactions. Moreover, the size was chosen to match the input requirements of ImageNet-pretrained architectures commonly used in computer vision, enabling effective transfer learning. This fused representation, integrates complementary spectral information from the three views, thereby enhancing the model’s ability to discriminate between PD and healthy speech samples.
2.4. Deep-Learning Models
For the classification task, we employed a diverse set of state-of-the-art DL architectures, primarily pretrained on the ImageNet [41] dataset. These included convolutional neural networks (CNNs) such as the ResNet family (ResNet-18, 50) [42], DenseNet models (DenseNet-121, 169) [43], EfficientNet variants (EfficientNet-B0, B2) [44], and lightweight models like ShuffleNet [45] designed for efficient inference. In addition, we included standard vision transformer [46] variants. Details of the specific model variants and pretrained weights are provided in the Data Availability Statement Section. All models received as input the three-channel spectro-temporal tensor (mel spectrogram, CQT, and gammatone spectrogram), structured to match the RGB image format expected by ImageNet-pretrained models. Although originally trained on natural images, prior work has shown that low-level features from such models generalize effectively to time–frequency audio representations [13,22,47,48]. During training, all models were fully fine-tuned from their ImageNet-pretrained weights. The original classification head was replaced with a binary classifier (single-output neuron with sigmoid activation).
2.5. Experimental Setup
To evaluate the effectiveness of our proposed multi-channel fusion approach, we conducted a comprehensive experimental study. Our primary strategy involved a direct performance comparison between individual baseline models and our fused-input model. We began by training and testing three separate baseline models, each utilizing a single spectro-temporal representation: one with mel spectrograms, one with CQT, and one with a gammatone spectrogram. The architectures for these models were kept consistent to ensure a fair comparison. Following the baseline evaluations, we trained and tested our main model, which takes as input the stacked multi-channel data. This approach allowed us to directly quantify the performance gains achieved by combining these diverse auditory features, demonstrating the clear advantage of our fusion method for PD detection from speech signals.
To ensure a robust and unbiased evaluation, we implemented a 10-fold cross-validation protocol with subject-independent partitioning. This methodology involved dividing the dataset into ten folds, where for each iteration, the model was trained on nine folds (90% of the data) and validated on the held-out tenth fold (10% of the data). To prevent overfitting to speaker-specific characteristics and promote generalization, we enforced a strict subject-independent split. This means all recordings from a single participant were kept together within the same fold, guaranteeing that no speaker’s data appeared in both the training and validation sets in any given fold.
The experimental framework was implemented in Python (3.10.10). We utilized PyTorch (2.7.1) [49] for building and training the DL models, while data manipulation and analysis were handled with Pandas (2.3.1) [50] and NumPy (2.2.6) [51]. Model evaluation metrics and visualizations were generated using Scikit-learn (1.7.0) [52] and Matplotlib (3.10.3) [53]. The SHAP [29] library (0.48.0) was employed to interpret model predictions. The implementation is available at https://github.com/slundberg/shap (accessed on 5 August 2025).
Model training was performed using the AdamW [54] optimizer, which minimizes a cross-entropy loss function. We set an initial learning rate of 3 × 10^−4^, which was dynamically adjusted by a scheduler throughout training. Additional hyperparameters, such as batch size and the number of training epochs, are detailed in Table 1. No hyperparameter tuning was conducted; all hyperparameter values were selected based on standard practices to ensure fair comparisons across models and input types. Our goal was to isolate the effect of multi-channel fusion, leaving tuning for future work.
All experiments were conducted on a high-performance computing system equipped with an Intel Core i7 13700K CPU, 128 GB of RAM, and an NVIDIA RTX 4090 GPU with 24 GB of VRAM.
2.6. Evaluation Metrics
The model’s predictive performance was quantified using a suite of five evaluation criteria: accuracy, F1-score, specificity, sensitivity, and precision. The definitions for these criteria are presented in Equations (1)–(5).
where TP, TN, FP, and FN represent the counts of true positives, true negatives, false positives, and false negatives, respectively. In addition to these metrics, we also utilized an area under the receiver operating characteristic curve (AUC) and a cumulative confusion matrix across all folds to provide a comprehensive evaluation of model performance and assess overall classification accuracy.
2.7. Interpreting Model Predictions with SHAP
To enhance the interpretability of our PD detection model, we employed SHAP, a unified framework for explaining DL model predictions through game-theoretic principles [29]. SHAP values assign pixel-level attribution scores that quantify each time–frequency bin’s contribution to the model’s PD classification decision, enabling us to visualize which spectral regions and temporal segments of the spectrogram most significantly influence the network’s diagnostic predictions. By computing SHAP values across our dataset, we generated interpretable heatmaps that highlight the most discriminative acoustic features and spectro-temporal patterns learned by the architecture for distinguishing between PD and healthy control speech samples. This time–frequency attribution approach offers critical insights into the model’s acoustic reasoning process, highlighting spectro-temporal regions that the model finds discriminative, which may correspond to known PD-related vocal impairments such as reduced pitch variation or irregular phonation. However, without expert annotation or alignment, the clinical relevance of these regions remains inferential.
3. Results and Discussion
This section presents a comprehensive analysis of the results and evaluates the performance of the models examined in this study.
3.1. Classification Performance
To assess how different architectures and input representations perform, we evaluated EfficientNet-B2, DenseNet-121, ResNet-50, ShuffleNet, and a vision transformer Tiny using four input types: CQT, mel spectrogram, gammatone spectrogram, and their fused combination. To ensure a fair and meaningful comparison, only the best-performing variant from each deep-learning architecture family is presented in the main results (Table 2). Model selection was based strictly on the highest mean accuracy achieved with the fused multi-channel input representation. For example, within the EfficientNet family, EfficientNet-B2 (accuracy: 84.39% ± 5.19%) was selected over EfficientNet-B0 (83.09% ± 4.15%) for its superior performance. Detailed results for all evaluated models and input representations are available in the Supplementary Materials (Table S1).
Our analysis revealed a distinct performance hierarchy among both model architectures and feature representations. Notably, fused feature representations consistently outperformed individual spectral features across all architectures. This consistent improvement indicates that integrating complementary time–frequency representations captures richer acoustic information and supports more robust classification decisions.
EfficientNet-B2 emerged as the top-performing architecture overall, achieving 84.39% ± 5.19% accuracy with fused features, the highest recorded in this study. Its superior performance extends across individual representations as well, particularly with mel spectrograms (82.80% ± 8.40%). DenseNet-121 followed closely with 84.22% ± 6.15% accuracy using fused features. ResNet-50 distinguished itself by achieving the highest precision (89.51% ± 6.74%) and specificity (90.83% ± 6.18%) with fused features, suggesting that residual connections effectively minimize false positives while maintaining strong overall performance (83.75% ± 6.49% accuracy). Lightweight architectures delivered more modest, yet still competitive, results. ShuffleNet, designed for computational efficiency, achieved 80.02% ± 7.94% accuracy with fused features, while vision transformer tiny reached 83.6% ± 7.37%, demonstrating the effectiveness of attention mechanisms even in smaller-scale implementations for audio classification tasks. Additionally, we performed a brief ablation study on data augmentation, as shown in Supplementary Table S2, which demonstrated modest yet consistent improvements in model performance across different architectures. Moreover, we note that some metrics exhibit high variance, reflecting performance instability across folds, likely due to the modest dataset size and speaker variability. Despite subject-independent CV and augmentation, this underscores the need for larger, more diverse datasets.
To visualize and further validate these performance differences, we generated a bar plot comparing AUC scores across models and representations. The bar plot (Figure 2) illustrates the AUC performance of different models across four input representations (CQT, gammatone, mel, and fused). Consistent with the tabular results, fused representations yielded the best performance across nearly all architectures, with ResNet-50 and DenseNet-121 achieving the highest mean AUC (≈0.90), indicating strong overall discriminative ability across decision thresholds. In contrast, models relying solely on CQT representations exhibited notably weaker performance, particularly with ShuffleNet and ViT (b16), where AUC values fell below 0.78. Overall, the visualization reinforces the advantage of feature fusion in enhancing classification performance and highlights the greater reliability of DenseNet, ResNet, and EfficientNet models when using fused inputs. Complementary analyses for the best-performing models (Figure 3), including cumulative confusion matrices and ROC curves, further corroborate these findings. Specifically, while EfficientNet-B2 achieves a balanced sensitivity–specificity profile, Dense-Net-121 and ResNet-50 attain comparable discriminative power (AUC ≈ 0.90), with marginally higher precision and specificity as noted earlier.
Moreover, to evaluate potential demographic bias, we conducted a fairness analysis across gender and age subgroups using our top three models (DenseNet-121, ResNet-50, and EfficientNet-B2). Evaluating 1000 samples evenly split by gender (500 female, 500 male) and age (≤62 vs. >62 years, based on median), we found no statistically significant performance differences (p > 0.05, independent t-test) in accuracy across groups (Table 3).
To explore how sentence content influences detection and to assess model performance across diverse contexts, we measured AUC scores for each of the 10 sentence types (Figure 4), encompassing both syntactically simple and complex utterances, as well as emotionally expressive sentences marked by emphasized prosody. The sentences were drawn from two task categories: Sentence Repetition (varying in syntactic complexity) and emphasized Sentence Reading (featuring stress on key words). The AUC values reflect each model’s ability to discriminate between PD and HC speech samples from these utterances.
The results reveal systematic variation in AUC performance across sentence types, suggesting that acoustic and linguistic characteristics modulate model discriminability. Notably, sentences with emotionally charged or prosodically emphasized content consistently achieved higher AUC values across all models. For example, “Triste” (Estoy muy triste…) and “Preocupado” (Estoy muy preocupado…), both expressing negative affect and featuring prominent intonational contours, yielded among the highest AUC scores (≥0.93), with minimal inter-model variance. Similarly, the prosodically marked sentences “Juan” (ROMPIÓ una PIERNA…) and “Viste” (GANAR la medalla…) demonstrated strong detection performance (AUC > 0.87), indicating that exaggerated stress patterns, particularly on verbs denoting physical events or outcomes, enhance signal detectability.
In contrast, syntactically simple and emotionally neutral utterances, such as “Mi casa” (Mi casa tiene tres cuartos), exhibited comparatively lower AUC scores (ranging from ~0.81 to 0.86), particularly in ResNet-50. This can suggest that minimal syntactic structure and low emotional valence may reduce the acoustic footprint of PD-related dysprosody, thereby diminishing model sensitivity. However, syntactic complexity alone does not fully explain performance differences. Sentences like “Omar”, “Laura”, and “Rosita”, which contain relative clauses (e.g., que vive cerca, que pinta bien), showed elevated AUC values despite moderate syntactic load, likely due to increased phonetic duration, pause placement, and contextual richness that provide additional temporal and spectral cues for classification. Interestingly, the sentence “Los libros” (Los libros nuevos no caben…), though syntactically simple, performed well, suggesting that lexical content and semantic context, such as negation and spatial constraints, may also contribute to discriminability. Furthermore, “Luisa” (compra el colchón duro que tanto le gusta), which combines syntactic embedding with a declarative tone, achieved high performance, reinforcing the role of structured discourse in enhancing acoustic variability.
These findings suggest that sentence-level acoustic characteristics, particularly those associated with prosodic emphasis and emotional expression, may enhance the detectability of speech impairments in PD. While syntactic structure appears to contribute, the most consistent performance gains were observed in utterances with increased acoustic prominence, which may amplify PD-related dysprosody. Nevertheless, this analysis remains exploratory, and further linguistic and clinical investigation is needed to disentangle the respective roles of syntax, prosody, and emotion on model performance.
To benchmark our method against prior work, we compared our results with recent studies utilizing the PC-GITA dataset’s sentence reading task. Prior research has applied both ML and DL approaches to this dataset, with particular emphasis on sentence reading due to its controlled and linguistically consistent speech samples across subjects. In this study, we further contextualize our performance by comparing it with these works, as summarized in Table 4. Using the sentence reading subset of PC-GITA and a multi-channel spectrogram representation with EfficientNet-B2, our approach achieves an F1-score of 84.35 ± 5.52%. The reported variability across folds is within the range typically seen in PD speech studies on this dataset (≈5–10%), reflecting differences in speaker partitions but still indicating stable and generalizable performance. This performance is competitive with the previous methods, including handcrafted acoustic features (e.g., MFCCs) combined with XGBoost classification (Favaro et al. [25], 57%), and foundation speech recognition models like Wav2Vec (82%), WavLM (81.99%), and HuBERT (80.84%) trained on raw audio [25,55,56,57]. While direct comparison is limited by differences in model architecture, pretraining strategy, and input representation, our results suggest that carefully engineered multi-channel spectro-temporal inputs can achieve competitive performance for PD detection without relying on large-scale audio pretraining.
3.2. SHAP and t-SNE Feature Visualization
To gain insights into the learned representations and decision-making processes of our models, we integrated global and local interpretability methods (t-SNE and SHAP) in this subsection. For consistency, both visualizations are based on the model trained on the first fold of cross-validation, ensuring directly comparable analyses. This approach ensures that both interpretability methods are based on the same learned representation, enabling a direct and comparable analysis of feature importance and embedding structure across different architectures. The t-SNE visualizations presented in Figure 5 illustrate the separation of high-dimensional feature representations learned by three deep convolutional neural networks that have shown better performance (EfficientNet-B2, ResNet-50, and DenseNet-121) when applied to a classification task distinguishing between HC (blue) and PD (red) subjects. Each plot projects the embedding into a two-dimensional space, revealing how each model captures the underlying structure of the data. EfficientNet-B2 exhibits a moderate degree of class separation with some overlap, suggesting that while it captures meaningful features, certain regions remain ambiguous. In contrast, ResNet-50 and DenseNet-121 demonstrate a clearer distinction between HC and PD clusters with minimal inter-class overlap, indicating stronger discriminative capabilities in the learned feature space. Since t-SNE is a nonlinear 2D projection, it may distort high-dimensional structure. EfficientNet-B2 might rely on more distributed features that appear less separable in this space yet still contribute to its higher accuracy. Meanwhile, the somewhat clearer clusters and slightly higher AUC observed for ResNet-50 and DenseNet-121 suggest these models may also serve as competitive alternatives. Importantly, visualizations here are based on Fold 1 for consistency with SHAP; projections for more folds are provided in Supplementary Figure S2 to assess stability. Nonetheless, all 2D projections should be interpreted with caution, as nonlinear dimensionality reduction can introduce artifacts.
To further investigate the features driving the classification decisions of these models, we applied SHAP, a game-theoretic approach that interprets individual predictions by attributing importance scores to input pixels. Unlike t-SNE, which provides a global view of the learned embedding structure, SHAP offers local interpretability, revealing which regions of the input image most influence the model’s decision for a given sample. Figure 6 presents SHAP heatmaps that depict the feature contributions of fused spectrograms in differentiating between healthy controls (HC) and patients with PD. Additional examples from different folds can be found in Supplementary Materials Figure S3. Each row corresponds to a sample: the leftmost column displays the input fused spectrogram, while the adjacent panels show SHAP attribution maps from three DL models, EfficientNet-B2, ResNet-50, and DenseNet-121, highlighting regions influential in classification decisions. The selected samples include the utterance “Viste,” which consistently achieved high classification performance across all models, as demonstrated in Figure 4. In the SHAP visualizations, negative values (displayed in blue) indicate regions that contribute to a prediction of HC, whereas positive values (shown in red) reflect features that support a PD classification.
For HC samples, the SHAP heatmaps predominantly exhibit blue regions across all models, indicating that specific spectral patterns contribute positively to “Healthy” predictions. These patterns demonstrate a consistent focus on specific time–frequency regions, particularly in the lower-frequency bands and temporal segments of the spectrogram. This aligns with clinical observations that PD affects fundamental frequency control and laryngeal stability, particularly in lower-frequency bands [40,58,59], though further validation with expert annotation is required. In contrast, PD samples are characterized by dominant red regions in the heatmaps, signifying features that drive “Parkinson” classifications. These red activations are more widespread and intense, especially in the lower- and upper-frequency ranges as well as in later time segments, suggesting that the models capture distinct temporal and spectral deviations associated with PD. EfficientNet-B2 demonstrates a more uniform and localized activation pattern, whereas ResNet-50 and DenseNet-121 generate broader but less consistent heatmaps.
Finally, while the SHAP heatmaps highlight discriminative acoustic regions, their clinical meaning remains uncertain without expert input. Future work should involve close collaboration with speech-language pathologists and neurologists to validate whether these highlighted patterns correspond to established clinical features of Parkinson’s-related speech impairments. Such integration would help ensure that explainability outcomes contribute meaningfully to clinical practice.
4. Conclusions
In conclusion, our multi-channel spectro-temporal approach, which fuses mel spectrogram, CQT, and gammatone representations, demonstrates improved performance in detecting PD from sentence-level speech. By integrating complementary acoustic features, the method enhances the ability of DL models to capture subtle speech impairments associated with PD. Results across multiple architectures, particularly EfficientNet-B2, consistently show gains from feature fusion, achieving up to 84.39% classification accuracy and outperforming both single-channel inputs and prior approaches on the same dataset. Interpretability analyses using SHAP suggest that models leverage frequency and temporal patterns, although the clinical relevance of these features remains to be validated. Complementary t-SNE visualizations tentatively show improved class separation in deeper CNN networks. While these findings are encouraging, validation on larger and more heterogeneous cohorts, including recordings from real-world, noisy environments, is needed to ensure generalizability and clinical viability. Future work should also involve clinical experts to assess the interpretability outputs, thereby strengthening the translational value of explainable AI in speech-based PD screening. Taken together, this study highlights the potential of integrating complementary spectro-temporal representations with DL for non-invasive, speech-based screening.
The reference list from the paper itself. Each links out to its DOI / PubMed record.
- 1Moustafa A.A. Chakravarthy S. Phillips J.R. Gupta A. Keri S. Polner B. Frank M.J. Jahanshahi M. Motor Symptoms in Parkinson’s Disease: A Unified Framework Neurosci. Biobehav. Rev.20166872774010.1016/j.neubiorev.2016.07.01027422450 · doi ↗ · pubmed ↗
- 2Mei J. Desrosiers C. Frasnelli J. Machine Learning for the Diagnosis of Parkinson’s Disease: A Review of Literature Front. Aging Neurosci.20211363375210.3389/fnagi.2021.63375234025389 PMC 8134676 · doi ↗ · pubmed ↗
- 3Ramig L.A. Fox C.M. Treatment of Dysarthria in Parkinson Disease Therapy of Movement Disorders Reich S.G. Factor S.A. Current Clinical Neurology Springer International Publishing Cham, Switzerland 20193739978-3-319-97896-3
- 4Rusz J. Cmejla R. Ruzickova H. Ruzicka E. Quantitative Acoustic Measurements for Characterization of Speech and Voice Disorders in Early Untreated Parkinson’s Disease J. Acoust. Soc. Am.201112935036710.1121/1.351438121303016 · doi ↗ · pubmed ↗
- 5Cao F. Vogel A.P. Gharahkhani P. Renteria M.E. Speech and Language Biomarkers for Parkinson’s Disease Prediction, Early Diagnosis and Progression NPJ Park. Dis.2025115710.1038/s 41531-025-00913-440128529 PMC 11933288 · doi ↗ · pubmed ↗
- 6Bridges B. Taylor J. Weber J.T. Evaluation of the Parkinson’s Remote Interactive Monitoring System in a Clinical Setting: Usability Study JMIR Hum. Factors 202411 e 5414510.2196/5414538787603 PMC 11161713 · doi ↗ · pubmed ↗
- 7Hssayeni M.D. Jimenez-Shahed J. Burack M.A. Ghoraani B. Symptom-Based, Dual-Channel LSTM Network for The Estimation of Unified Parkinson’s Disease Rating Scale III Proceedings of the 2019 IEEE EMBS International Conference on Biomedical & Health Informatics (BHI)Chicago, IL, USA 19–22 May 201914
- 8Ngo Q.C. Motin M.A. Pah N.D. Drotár P. Kempster P. Kumar D. Computerized Analysis of Speech and Voice for Parkinson’s Disease: A Systematic Review Comput. Methods Programs Biomed.202222610713310.1016/j.cmpb.2022.10713336183641 · doi ↗ · pubmed ↗