Changes in Body Composition Compartments After Kidney Transplantation: A One-Year Prospective Study
Emilia Ferrer-López, Raúl López-Blasco, Francisco Javier Rubio-Castañeda, Víctor Cantín-Lahoz, Juan José Aguilón-Leiva, María García-Magán, Carlos Navas-Ferrer, Isabel Blázquez-Ornat, María Teresa Fernández-Rodrigo, Isabel Antón-Solanas, Fernando Urcola-Pardo

TL;DR
This study tracks body composition changes in kidney transplant patients over one year and finds that factors like sex, age, and donor type influence weight and muscle/fat changes.
Contribution
The study provides new insights into how specific demographic and clinical factors influence body composition changes after kidney transplantation.
Findings
Mean weight gain at 12 months was 3.6 ± 6.5 kg, with greater increases in men, younger patients, and living donor recipients.
Muscle mass increased initially and stabilized, while fat mass decreased first and then increased, especially in women and younger recipients.
Visceral fat increased after three months, particularly in men and older patients, and total body water declined in women and younger recipients.
Abstract
Background/Objectives: Weight gain after kidney transplantation is frequent but heterogeneous, often accompanied by changes in body composition that influence long-term outcomes. This study analysed one-year changes in body compartments and their demographic and clinical determinants. Methods: A prospective cohort of 112 adult kidney recipients transplanted between September 2020 and June 2022 at a Spanish tertiary hospital was followed. Body weight, muscle mass, fat mass, visceral fat and total body water were assessed by multi-frequency bioelectrical impedance at discharge, and at 3, 6 and 12 months. Associations with sociodemographic, clinical and comorbidity variables were examined using repeated-measures ANOVA and comparative tests. Results: At 12 months, mean weight gain was 3.6 ± 6.5 kg (5.1%). Increases were greater in men, younger patients, non-dialysis candidates, those with…
Genes, proteins, chemicals, diseases, species, mutations and cell lines named across the full text — each resolved to its canonical identifier and authoritative record.
Click any figure to enlarge with its caption.
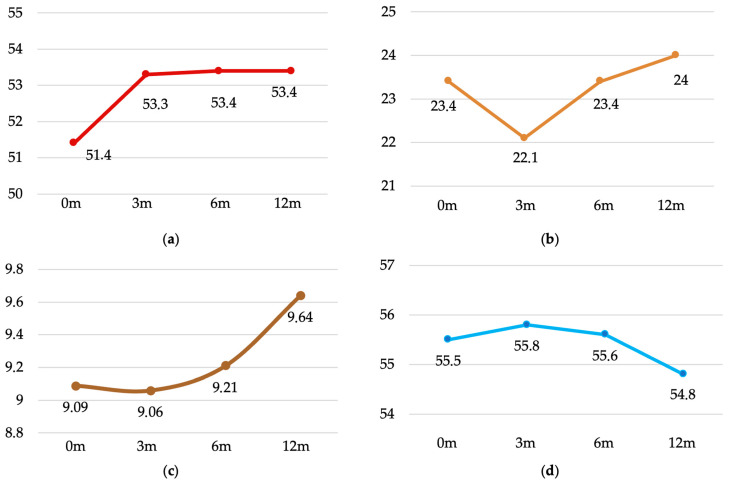 Figure 1
- —Government of Aragón (Spain)
- —Reference Team SAPIENF B53_23R (University of Zaragoza)
Peer Reviews
No public reviews on file for this paper yet. If you reviewed it on a platform where reviews are public (OpenReview, ICLR, NeurIPS, ICML), you can paste yours below so the community can read it here.
Videos
No videos yet. Explain this paper in a talk, walkthrough, or lecture? Add one.
Taxonomy
TopicsRenal Transplantation Outcomes and Treatments · Dialysis and Renal Disease Management · Organ Transplantation Techniques and Outcomes
1. Introduction
Weight gain after kidney transplantation is well documented in the literature [1,2,3,4]. Roughly half of all recipients gain weight during the first post-operative year, regardless of their pre-transplant nutritional status, and such weight gain can occasionally reflect recovery from pre-existing malnutrition [5,6,7]. While the prevalence of obesity before transplantation mirrors that of the Spanish general population (≈22%) [8,9], the figure rises to about 36% one year after graft implantation [10,11].
Unlike patients on haemodialysis—where a higher BMI appears to confer survival benefit—the same degree of adiposity is not protective in transplant recipients [12,13]. Excess fat mass, together with disturbances in glucose and lipid metabolism, volume overload and cardiac strain, contributes to a markedly elevated cardiovascular risk in this population [14,15,16]. In a retrospective UK cohort of 25,539 adult kidney-transplant recipients, a BMI > 25 kg m^−2^ independently predicted delayed graft function and primary non-function [17]. Growing evidence also links overall obesity and, more specifically, visceral adiposity with poorer graft and patient survival, even in individuals with an otherwise well-functioning transplant [2,18].
Background
Beyond metabolic disturbances, kidney transplant recipients face significant clinical and emotional challenges. Rejection, graft function and long-term survival are primary concerns, especially considering that some patients may require more than one transplant during their lifetime, making this a clinically complex and emotionally variable population [19]. This complexity is compounded by common pre-existing comorbidities, including hypertension (HT), diabetes mellitus (DM), dyslipidaemia (DLP) and cardiovascular disease (CVD), both coronary and peripheral, as well as polypharmacy and older age [20].
Immunosuppressive therapy, essential to prevent graft rejection, increases the risk of opportunistic infections, hypertension, hypercholesterolaemia and the development of post-transplant diabetes mellitus (PTDM). Similarly, corticosteroids—especially during the early post-operative period—exert metabolic effects and stimulate appetite, contributing to weight gain [20,21,22].
At the same time, kidney transplantation resolves the anorexic and hypercatabolic state associated with end-stage renal disease by eliminating protein losses due to dialysis, improving nutritional intake through the removal of dietary restrictions, and allowing for greater freedom in daily life. These changes typically lead to psychological improvement and better quality of life [23] but also make it more difficult to control food intake and body weight [4].
However, obesity in this population is not homogeneous. Some individuals with obesity remain metabolically healthy, while others develop significant cardiometabolic comorbidities despite similar levels of adiposity [24,25]. Moreover, after transplantation, significant changes occur in body composition, including variations in muscle mass, fat redistribution and fluid balance. These changes may be driven by surgical immobilisation, the catabolic effect of corticosteroids, reduced physical activity and liberalisation of the diet [26,27].
Accordingly, maintaining weight with a favourable body composition becomes a self-care priority after kidney transplantation. If weight gain is primarily due to increased fat mass, it may serve as a risk marker for reduced graft function and survival [15,16]. In contrast, restoring healthy body composition may enhance quality of life, reduce the risk of metabolic diseases and contribute to long-term graft preservation [28].
Given the clinical impact of post-transplant weight gain and the heterogeneity of obesity phenotypes, it is essential to go beyond body weight and examine specific changes in body composition compartments. We hypothesised that body composition changes during the first year after kidney transplantation would vary according to demographic and clinical factors, with greater fat accumulation expected among recipients with cardiovascular risk factors, and more favourable trajectories among younger patients and those receiving grafts from living donors. The aim of this study was to analyse one-year changes in weight and body composition in a prospective cohort of kidney transplant recipients, and to explore their associations with cardiovascular risk factors such as hypertension, diabetes mellitus, dyslipidaemia, overweight and obesity.
2. Materials and Methods
2.1. Study Design and Participants
A descriptive, longitudinal and prospective study was conducted in kidney transplant recipients. The study population included all individuals who received a kidney graft between 1 September 2020 and 30 June 2022 in our autonomous community.
Inclusion criteria were being aged 18 years or older and having provided informed consent to participate in the study. Exclusion criteria included refusal to participate and amputation of one or more limbs during the follow-up period.
A total of 117 patients received a kidney transplant during the study period. Four were excluded due to the inability to record weight at the first post-discharge consultation, and one additional patient was excluded due to a lower limb amputation three months after transplantation. The final sample consisted of 112 participants.
2.2. Variables, Data Collection and Measuring Instruments
Sociodemographic variables included age and sex. Clinical variables comprised anthropometric measurements (height and weight), presence of comorbidities (hypertension, diabetes mellitus, dyslipidaemia, cardiovascular disease, cardiorespiratory disease or stroke), smoking status, time on the transplant waiting list, and type of renal replacement therapy prior to transplantation (non-dialysis, peritoneal dialysis or haemodialysis). These data were obtained from the electronic medical records of the Spanish National Health System.
In our cohort, all kidney transplants were performed between donors and recipients of the same blood group, and patients received the standard care of our autonomous community, which includes the recommendation to follow a Mediterranean diet and to walk 30 min daily after complete wound healing.
Data collection was conducted from September 2020 to July 2023. Weight and body composition were assessed at outpatient visits scheduled 7 days after discharge (baseline), and at 3, 6 and 12 months post-transplantation. All measurements were taken at the hospital’s outpatient nursing unit during nephrology follow-up appointments.
Body composition was assessed using the Tanita BC-601F segmental body composition monitor, which employs multi-frequency bioelectrical impedance analysis (BIA) with five measurement pathways (foot-to-foot, hand-to-hand, left hand to right foot, right hand to left foot, and left hand to left foot). This system covers 100% of the body surface, in contrast to conventional BIA devices that typically reach only 75%, thus enhancing accuracy in individuals with non-standard body composition profiles, such as transplant recipients.
The variables analysed included weight (kg), body fat percentage, muscle mass percentage, visceral fat index, total body water and BMI. Other parameters (e.g., limb-specific measures, bone mass, metabolic age) were excluded from analysis. Measurements were performed following the manufacturer’s recommendations: patients stood barefoot with feet centred on the scale sensors, held the handgrip bar with both hands ensuring all ten fingers contacted the electrodes, and extended their arms without touching the body. Participant age, sex and height were entered into the scale prior to each measurement. Body sizing was performed during pre-surgical preparation using MeWa GmbH equipment (Schwerin M-3040-40-01).
2.3. Data Analisys
Statistical analyses were performed using IBM SPSS Statistics for Windows, Version 27.0 (IBM Corp., Armonk, NY, USA). Qualitative variables were summarised using absolute and relative frequencies (n, %). Quantitative variables were expressed as mean and standard deviation (SD) when normally distributed, or median and interquartile range (IQR: 25th–75th percentile) when not.
Comparisons between qualitative variables were conducted using the chi-square test or Fisher’s exact test. For quantitative variables, comparisons were made using parametric tests (Student’s t-test, paired t-test, one-way ANOVA and repeated-measures ANOVA with Bonferroni post hoc correction) when assumptions of normality and sphericity were met. In the absence of normal distribution, non-parametric tests were used (Mann–Whitney U, Kruskal–Wallis and Wilcoxon signed-rank test). Pearson’s or Spearman’s correlation coefficients were applied to assess associations between continuous variables. Statistical significance was established at p < 0.05, with 95% confidence intervals (CI) where applicable.
2.4. Ethical Considerations
Prior to data collection, all participants received verbal and written information about the study and provided informed consent. The study adhered to current ethical and legal standards regarding data protection and biomedical research, in accordance with Regulation (EU) 2018/1725 of the European Parliament and of the Council, and Spanish Organic Law 3/2018 on the Protection of Personal Data and Guarantee of Digital Rights. The principles outlined in the Declaration of Helsinki [29] were also followed. Patient names, initials, clinical record numbers and other identifying information were anonymised. The study protocol was approved by hospital management and by the Research Ethics Committee of Aragón (C.P.–C.I. PI20/278).
3. Results
3.1. Descriptive Analysis
A total of 112 kidney transplant recipients were included in the study. The cohort was predominantly male (70.5%), with a median age of 58 years (IQR: 19.3; range: 18–80). Most participants (70.5%) were under 65 years of age. The leading causes of chronic kidney disease (CKD) were glomerulopathies (27.7%), followed by unknown aetiologies (21.4%), polycystic kidney disease (12.5%) and diabetic nephropathy (12.5%) (Table 1).
Regarding pre-transplant renal replacement therapy (RRT), 65.2% of participants had received haemodialysis, while 8.0% were transplanted without prior dialysis. Almost half had an arteriovenous fistula (44.6%), and the majority underwent their first transplantation (88.4%) with a deceased donor graft (89.3%). Concerning comorbidities, hypertension was present in 90.2% of the sample, dyslipidaemia in 52.7% and diabetes mellitus in 19.6%. Cardiovascular disease affected 26.0% of participants, and 18.0% reported toxic habits. When categorised by BMI, 47.3% of participants had normal weight, 34.0% were overweight and 14.3% were classified as obese. Men presented significantly higher BMI values than women (p = 0.007) (Table 2).
Median waiting time was 326 days (IQR: 506), being significantly longer in those <65 years (387 vs. 194 days; p = 0.010). Biochemical markers at baseline revealed elevated ferritin, urea and creatinine, with improvements in renal function and haemoglobin levels at 12 months. Statistically significant sex differences in creatinine levels were observed at both baseline (p = 0.016) and follow-up (p = 0.001) (Table 3).
3.2. Body Composition Changes over Time
Significant changes were observed over the follow-up period in several anthropometric and body composition parameters. Repeated-measures analyses revealed statistically significant differences in body weight, muscle mass, fat mass, and visceral fat index (all p < 0.05), while no significant differences were found in total body water percentage. Body weight showed a progressive increase over time (F(1,94) = 18.15, p < 0.001, η^2^ = 0.141, power = 1). Bonferroni-adjusted post hoc comparisons indicated significant increases from baseline to 6 months (mean difference = −2.36 kg, p < 0.001, 95% CI −3.75 to −0.95) and to 12 months (−3.24 kg, p < 0.001, 95% CI −4.96 to −1.51). A smaller but significant change was also noted between 3 and 12 months (−2.01 kg, p < 0.001) (Table 4).
Muscle mass followed an initial increase at 3 months, stabilising thereafter. Differences were significant across all time points (F(2,62) = 13.56, p < 0.001, η^2^ = 0.109), with post hoc tests confirming changes from baseline to 3, 6 and 12 months (all p < 0.001) (Figure 1a). Fat mass decreased during the first three months and then slightly increased between months 6 and 12. Overall differences were significant (F(2,64) = 4.97, p = 0.004, η^2^ = 0.043), with post hoc comparisons revealing changes from 3 to 6 months (−1.32%, p = 0.013) and from 3 to 12 months (−1.97%, p = 0.001) (Figure 1b). Visceral fat decreased slightly at 3 months and then increased over the following months (F(2,71) = 3.38, p = 0.023, η^2^ = 0.013). Significant changes were observed between 3 and 12 months (−0.58, p = 0.024) (Figure 1c). Total body water showed a modest increase at 3 months, followed by a gradual decline to below baseline values by 12 months, although these differences did not reach statistical significance (F(2,69) = 1.61, p = 0.190) (Figure 1d).
3.2.1. Body Weight Changes over Time
Table 5 summarises the evolution of body weight according to the main clinical and demographic variables. Across all follow-up periods, men consistently showed higher body weight than women, with statistically significant differences at each time point (p < 0.001). Although men exhibited greater absolute weight gain, this difference is partly explained by their higher baseline weight.
Patients younger than 65 years also showed greater increases than older ones, with significant intra-group differences in the younger group (p < 0.001). According to previous kidney replacement therapy, non-dialysis patients gained more weight, while haemodialysis recipients showed smaller but still significant increases (p < 0.001). Regarding baseline BMI, individuals with underweight, normal weight or overweight showed significant increases, whereas those with obesity exhibited minimal changes. The most pronounced effect was observed in patients with a previous transplant, who gained on average 8.6 ± 4.6 kg compared with 2.5 ± 6.8 kg in first transplants (p = 0.008). Finally, recipients of a living donor kidney exhibited a higher early gain than those with a cadaveric donor (5.3 ± 4.0 vs. 3.0 ± 7.0 kg; p < 0.001).
3.2.2. Evolution of Muscle Mass (MM) According to Independent Variables
Men showed a greater increase in muscle mass compared with women, with statistically significant differences at all measurement points (p < 0.001). Age group did not reveal differences between patients ≤ 65 and ≥65 years, although both groups experienced a significant intra-group increase in muscle mass over time (p < 0.001). Regarding KRT, haemodialysis patients presented the greatest increase, with significant intra-group differences (p < 0.001), whereas non-dialysis patients also showed an increase (p = 0.018) and peritoneal dialysis patients remained stable. Patients with previous transplantation gained more muscle mass than those undergoing their first transplant, but between-group differences were not significant; however, intra-group increases were observed in both groups (p < 0.001 and p = 0.043, respectively). Finally, recipients of cadaveric donor kidneys showed a significant increase over follow-up (p < 0.001), while those receiving a living donor kidney did not show statistically significant changes (Table 6).
3.2.3. Evolution of Fat Mass (FM) According to Independent Variables
Women showed a significantly greater increase in FM compared to men, with differences already evident at 3 months (p = 0.018) and persisting at 6 and 12 months (p < 0.001). Intra-group analysis revealed significant changes only in men (p = 0.014). When stratified by age, patients under 65 years experienced an increase in FM (1.2%), while those aged 65 and older showed a slight decrease (−0.7%), with intra-group differences observed in the younger group (p = 0.018). According to KRT modality, FM changes were greater in non-dialysis and PD patients (2%) than in HD patients (0%), although no between-group or intra-group differences were identified. Previous transplantation was associated with a higher increase in FM (2.8%) compared with first transplantation (0.4%), without between-group differences; however, intra-group differences were significant only in patients without previous transplantation (p = 0.010). Finally, LDKT recipients showed a higher increase in FM (3.8%) compared to cadaveric donors (0.3%), with significant intra-group differences in both groups (Table 7).
3.2.4. Evolution of Visceral Fat (VF) According to Independent Variables
Women experienced a greater increase in VF than men, with statistically significant differences at 3 and 12 months (p = 0.024 and p = 0.031, respectively), although intra-group changes were only significant in men (p = 0.018). According to age, patients under 65 years showed a higher increase in VF, with intra-group significance (p = 0.002), while those over 65 years exhibited a more stable trend without significant differences. Regarding KRT, HD patients presented the highest VF increase, with significant intra-group changes (p < 0.001), while no significant changes were observed in non-dialysis or PD groups. Patients with a previous transplant also showed greater VF gain, but significant intra-group changes were observed only in those undergoing first transplantation (p < 0.001). With respect to donor type, recipients of a cadaveric kidney presented significant intra-group increases in VF (p < 0.001), whereas no significant changes were observed in LDKT recipients (Table 8).
3.2.5. Evolution of Total Body Water Percentage (%TBW) According to Independent Variables
In men, %TBW remained relatively stable throughout follow-up, with only minor intra-group variations, while women showed a progressive decrease, reaching statistically significant intra-group differences (p < 0.001). According to age, patients under 65 years showed a decrease in %TBW, significant in intra-group analysis (p < 0.001), whereas older patients maintained more stable values. By KRT modality, HD patients exhibited significant intra-group reductions in %TBW (p < 0.001), while no changes were detected in PD or non-dialysis patients. In patients with previous transplantation, %TBW remained relatively stable, while those with a first transplantation showed a significant intra-group reduction (p < 0.001). Regarding donor type, cadaveric transplant recipients presented significant intra-group decreases in %TBW (p < 0.001), whereas no relevant differences were observed in LDKT recipients (Table 9).
3.2.6. Weight Gain According to Comorbidities
The analysis of weight gains according to comorbidities revealed that hypertensive patients exhibited a higher increase in body weight compared with non-hypertensive individuals, although the difference did not reach statistical significance. Similarly, those with a history of ischaemic heart disease showed greater weight gain than those without, but no significant between-group differences were observed. In contrast, patients without a history of dyslipidaemia, diabetes mellitus, respiratory disease or cerebrovascular accident experienced greater weight gain than their counterparts, although none of these comparisons reached statistical significance. Of the patients with pre-transplant diabetes and those who developed de novo diabetes after transplantation (n = 44), 5 patients were taking sodium–glucose cotransporter 2 (SGLT2 inhibitors), and 4 patients were taking dipeptidyl peptidase-4 inhibitors at the end of the study. Notably, patients who developed New-Onset Diabetes After Transplantation (NODAT) gained less weight compared with those who maintained normoglycaemia, with statistically significant differences (p = 0.013), only 2 patients of this group were taking SGLT2 inhibitors.
Furthermore, smokers experienced a significantly higher weight gain than non-smokers (p = 0.011) (Table 10).
At the end of the study, the overall survival rate of kidney transplant patients was 96.4%, with four events occurring during the follow-up period due to various causes unrelated to the kidney transplant, establishing an average survival rate of 1202.14 ± 13.70 days, [95% CI: 1175.28–1230]. The overall survival rate of grafts was 93.8%, with an average survival time of 1177.79 ± 19.07 days [95% CI: 1140.40–1215.18].
4. Discussion
4.1. Sociodemographic Characteristics
In this cohort, nearly three quarters of the participants were male, a distribution consistent with most epidemiological studies on CKD [30,31]. Biological sex plays a well-recognised role in CKD onset and progression: men present a higher incidence of end-stage kidney disease and CKD-related mortality, whereas women typically show a slower decline in renal function [32,33]. These differences appear to be primarily biological rather than sociocultural, influenced by genetic, hormonal, and environmental mechanisms [34,35]. Despite this biological advantage, women face systemic inequities in access to renal replacement therapies: they are more likely to donate a kidney but less likely to be included on transplant waiting lists or to receive a graft, particularly from living donors [36,37]. Our findings reflect these trends, highlighting the intersection of biological sex and gender-related disparities in kidney transplantation.
The proportion of recipients aged ≥65 years was higher than typically reported in similar series, reflecting broader eligibility criteria and improved management of comorbidities in recent years [38]. Although advanced age increases the complexity of transplantation, it is no longer considered an exclusion factor, and favourable outcomes have been reported in carefully selected older candidates [39,40]. Glomerulopathies emerged as the leading cause of CKD in this cohort, in line with both national and international data [41,42]. Most transplants were from deceased donors, with a relatively low proportion of living donor procedures compared to other countries with comparable healthcare systems [43,44], suggesting potential areas for improvement in promoting living donation.
4.2. Cardiovascular Risk Factors
Hypertension was the most prevalent cardiovascular risk factor, followed by dyslipidaemia and established cardiovascular disease in nearly one quarter of the patients. These findings confirm the substantial burden of cardiovascular comorbidity in kidney transplant recipients, although the prevalence observed was slightly lower than previously reported in Spanish cohorts [30]. This may reflect regional variations in patient selection, perioperative management, or cardiovascular risk assessment strategies. Given the central role of cardiovascular disease in post-transplant morbidity and mortality, our data underscore the importance of structured cardiovascular monitoring both before and after transplantation.
4.3. Weight Evolution
At 12 months post-transplant, patients in this cohort gained on average 3.6 kg (5.1% of baseline weight). This increase is more modest than the 8–15% reported in previous national and international studies [1,3]. The wide variability in reported trajectories, ranging from significant weight gain to clinically relevant weight loss [45], highlights the heterogeneous metabolic responses to transplantation. Importantly, both marked weight gain and weight loss have been associated with higher mortality compared to weight-stable recipients [46], emphasising the need for close post-transplant monitoring.
In our sample, a subset of patients experienced weight loss during follow-up. This finding, though less frequently reported, may reflect increased metabolic demands, immunological adaptation, or nutritional imbalances. While moderate weight reduction could represent a favourable metabolic shift, unintended or excessive loss may compromise recovery and indicate subclinical complications [47]. These results reinforce the clinical importance of monitoring not only weight gain, but also unexpected reductions in body weight.
Weight trajectories also differed by sex. Male recipients exhibited greater weight gain, a trend aligned with studies documenting higher overweight and obesity rates among male kidney transplant recipients [48]. However, other reports have shown higher increases in female cohorts [49], suggesting that post-transplant weight change is shaped by both biological and behavioural determinants. Gender-specific differences in diet and physical activity behaviours may partly explain inconsistencies in post-transplant weight trajectories. In kidney transplant cohorts, adherence to healthy diets—such as the Mediterranean diet—is generally suboptimal, and nearly one-third of recipients report low levels of physical activity. Moreover, women often report better compliance with dietary recommendations and higher levels of physical activity than men, but the metabolic benefits may be attenuated by hormonal or genetic factors [50,51].
Age also emerged as a determinant of weight change, with younger recipients showing greater gains compared to older patients, in agreement with previous studies [52,53]. This pattern may be explained by a more cautious dietary approach among older patients—often motivated by comorbidities—whereas younger recipients are more likely to relax dietary restrictions and increase carbohydrate intake after transplantation [54]. Nonetheless, age-related metabolic and hormonal changes can also predispose to weight gain, suggesting that the relationship between age and post-transplant weight is complex and potentially bidirectional [55].
Overall, our findings suggest that weight trajectories after kidney transplantation are influenced by a combination of biological, behavioural, and age-related factors. These observations highlight the importance of personalised nutritional counselling and lifestyle interventions, particularly in younger and male recipients, who appear more prone to excessive post-transplant weight gain.
4.4. Body Composition Changes
Beyond changes in body weight, this study provides a detailed assessment of body composition, offering insights into the qualitative nature of post-transplant weight trajectories. The findings of this study evidenced an increase lean mass during the first three months post-transplant, which remained stable throughout the follow-up period. This contrasts with other study that reported an increase in total body weight without a corresponding increase in muscle mass [56]. Not having to go to hospital (65.2% of patients underwent haemodialysis) can result in patients enjoying more free time outside the home and the elimination of dietary restrictions. Together with cultural, environmental and social differences, this could explain the significant improvement in muscle mass in our patients. This phenomenon is particularly relevant as loss of muscle mass—sarcopenia—has been associated with impaired functional capacity, increased frailty, and worse survival outcomes in this population [57].
Differences in lean mass according to sex indicate a greater gain in males, a finding that is consistent with the results reported in the existing literature. These sex-specific trajectories may reflect differences in hormonal status, and behavioural adaptation., fat distribution. While men are more likely to accumulate visceral fat and lose muscle mass, women tend to maintain peripheral fat deposits [10,58]. Nonetheless, both patterns have important clinical implications: visceral adiposity is linked to cardiometabolic risk, whereas sarcopenia predisposes to frailty and physical dependence.
Age also emerged as a modifier of body composition. Older recipients displayed a relative preservation of fat-free mass compared with younger patients, who showed greater increases in fat accumulation. This may be explained by stricter adherence to dietary recommendations and more stable lifestyle behaviours among older adults, while younger recipients are more prone to overnutrition, and sedentary habits once dietary restrictions are relaxed post-transplant [54]. However, the combination of age-related anabolic resistance and immunosuppressive therapy can exacerbate sarcopenic changes, suggesting that older patients may still be at risk for progressive muscle decline despite stable weight [23].
The hydration status is consistent with previous findings reporting redistribution of fluid compartments following transplantation [59]. Changes in total body water and extracellular water may be influenced by immunosuppressive regimens, graft function, and concomitant comorbidities [60]. These shifts have prognostic significance, as fluid overload is a recognised predictor of cardiovascular morbidity and mortality in this population [61,62].
Taken together, these results reinforce the notion that body composition, rather than weight alone, provides a more accurate picture of the nutritional and functional status of kidney transplant recipients. Routine incorporation of body composition assessment in clinical practice could enable early identification of patients at risk of sarcopenia, adiposity-related complications, or fluid overload, allowing for tailored interventions.
4.5. Clinical Implications
The findings of this study underscore the need for a comprehensive and individualised approach to the nutritional and metabolic follow-up of kidney transplant recipients. While body weight monitoring remains routine, assessment of body composition provides additional insights into the qualitative nature of weight change and its impact on patient outcomes. Early detection of sarcopenia, excessive fat gain, or fluid overload may facilitate targeted interventions, such as personalised dietary counselling, structured physical activity programmes, and optimisation of immunosuppressive regimens. Incorporating body composition monitoring into post-transplant care could improve the long-term health, functionality, and survival of this vulnerable population.
From a preventive standpoint, identifying subgroups at higher risk—such as younger recipients, men, and patients with pre-existing cardiovascular risk factors—may allow for the development of tailored educational and lifestyle interventions. Moreover, the increasing proportion of older transplant recipients highlights the need to balance functional preservation with adequate nutritional support, avoiding both sarcopenia and excessive weight gain.
4.6. Strengths and Limitations
This study presents several limitations that should be considered when interpreting the findings. First, it was conducted in a single tertiary hospital, which may limit the generalisability of results to other regions with different clinical practices or sociodemographic characteristics. Second, lifestyle-related variables such as physical activity, employment or retirement status, and adherence to dietary recommendations were not assessed. Similarly, functional capacity metrics, immunosuppressive medication, risk of infections, hospitalizations, patient and graft survival and its relationship to changes in body composition were not assessed either, despite their recognised influence on post-transplant weight and body composition trajectories. Third, although body composition was measured using bioelectrical impedance analysis, a widely available and non-invasive method, this technique is less precise than gold-standard approaches such as dual-energy X-ray absorptiometry or magnetic resonance imaging and may be influenced by hydration status. Finally, the follow-up period was limited to 12 months, precluding the analysis of long-term changes and their association with graft survival and overall patient prognosis.
Despite these limitations, the study has several important strengths. Its prospective design allows for a temporal assessment of changes in body composition during the first year after kidney transplantation. Furthermore, the study included all transplant recipients in the reference autonomous community, ensuring that the cohort was highly representative of the target population. The relatively large sample size and the inclusion of a broad age spectrum, with nearly one third of participants over 65 years, enhance the applicability of the findings to contemporary clinical practice. Lastly, the use of body composition analysis provided a more accurate evaluation of fat, lean and fluid compartments compared to traditional measures such as body mass index, offering a more nuanced understanding of post-transplant nutritional and metabolic status.
5. Conclusions
The findings of this prospective cohort study indicate that post-transplant changes in body composition are strongly influenced by demographic and clinical variables. Differences were observed in all measures, including body weight, lean mass, fat mass and visceral adiposity. Both sex and baseline BMI emerged as key determinants, highlighting the importance of individualised monitoring strategies.
Older recipients (>65 years) exhibited greater overall increases in body weight and adiposity, whereas younger patients accumulated proportionally more visceral fat, a distribution pattern associated with higher metabolic risk. The development of new-onset diabetes after transplantation was paradoxically associated with less weight gain, suggesting complex metabolic adaptations that warrant further investigation. In addition, active smoking was linked to a greater increase in body weight, underscoring the need for targeted preventive counselling in this subgroup.
Overall, these findings emphasise the relevance of systematic and early assessment of body composition in kidney transplant recipients, beyond traditional reliance on BMI. Regular monitoring may facilitate the timely identification of patients at higher risk of adverse metabolic trajectories, allowing for the implementation of tailored dietary, lifestyle and pharmacological interventions. Future research should extend the follow-up to longer periods, evaluate the role of physical activity and nutritional adherence, and explore the impact of these changes on graft function, cardiovascular risk and long-term survival.
The reference list from the paper itself. Each links out to its DOI / PubMed record.
- 1Caamiña L. Pietropaolo A. Basile G. Dönmez M.I. Uleri A. Territo A. Fraile-Gómez P. Evaluación del impacto de la obesidad en los resultados del trasplante renal Actas Urológicas Españolas 20244812513310.1016/j.acuro.2023.07.00437604402 · doi ↗ · pubmed ↗
- 2Scheuermann U. Babel J. Pietsch U.C. Weimann A. Lyros O. Semmling K. Sucher R. Recipient obesity as a risk factor in kidney transplantation BMC Nephrol.2022233710.1186/s 12882-022-02668-z 35042452 PMC 8767742 · doi ↗ · pubmed ↗
- 3Moreau K. Desseix A. Germain C. Merville P. Couzi L. Thiébaut R. Chauveau P. Evolution of Body Composition Following Successful Kidney Transplantation Is Strongly Influenced by Physical Activity: Results of the CORPOS Study BMC Nephrol.2021223110.1186/s 12882-020-02214-933461513 PMC 7814641 · doi ↗ · pubmed ↗
- 4Ferreira T.D.S. Barreto Silva M.I. Costa M.S. Pontes K.S.D.S. Castro F.G. Antunes V.P. Klein M.R.S.T. High Abdominal Adiposity and Low Phase Angle in Overweight Renal Transplant Recipients Clin. Transplant.2019331365410.1111/ctr.1365431241791 · doi ↗ · pubmed ↗
- 5Wilkinson T.J. Clarke A.L. Nixon D.G.D. Hull K.L. Song Y. Burton J.O. Yates T. Smith A.C. Prevalence and Correlates of Physical Activity across Kidney Disease Stages: An Observational Multicentre Study Nephrol. Dial. Transplant.20213664164910.1093/ndt/gfz 23531725147 · doi ↗ · pubmed ↗
- 6Quero M. Montero N. Rama I. Codina S. Couceiro C. Cruzado J.M. Obesity in renal transplantation Nephron 202114561462310.1159/00051578633975320 · doi ↗ · pubmed ↗
- 7Quint E.E. Schopmeyer L. Banning L.B. Moers C. El Moumni M. Nieuwenhuijs-Moeke G.J. Pol R.A. Transiciones en estado de fragilidad después del trasplante de riñón Langenbeck’s Arch. Surg.202040584385010.1007/s 00423-020-01936-632691130 PMC 7471154 · doi ↗ · pubmed ↗
- 8Gómez-Ambrosi J. Catalán V. Prevalencia de diabesidad en España: Depende de cómo se defina la obesidad An. Del Sist. Sanit. De Navar.202245 e 099310.23938/ASSN.099335514127 PMC 10100597 · doi ↗ · pubmed ↗