CHEcking Diagnostic Differential Ability of Real Baseline Variables and Frailty Scores in Tolerance of Anti-Cancer Systemic Therapy in OldEr Patients (CHEDDAR-TOASTIE)
Helen H. L. Ng, Isa Mahmood, Francis Aggrey, Helen Dearden, Mark Baxter, Kieran Zucker

TL;DR
This study found that current models for predicting chemotherapy side effects in older patients are not accurate enough for clinical use, despite some promising results in identifying low-risk patients.
Contribution
The study evaluates the predictive performance of baseline variables and frailty scores for chemotherapy toxicity in older UK patients, revealing limitations in current models.
Findings
22% of 322 patients experienced severe toxicities from chemotherapy.
Logistic regression models achieved the highest balanced accuracy of 0.6382 for predicting toxicity.
Models showed low–moderate accuracy, insufficient for clinical implementation.
Abstract
Older adults are more prone to severe side effects (toxicities) from chemotherapy. The initial observational study found that scoring systems used to predict toxicities in a 65+ UK population receiving first-line chemotherapy performed poorly. This subsequent study aims to explore whether additional frailty and baseline health data can improve the performance of toxicity prediction models. Data from the observational study were used: factors such as age, sex, weight, a patient’s own assessment of health (AHQ), and number of comorbidities were analyzed for their predictive performance. Then, predictive models were built using various statistical and machine learning methods. Among 322 patients, 22% had toxicities. Ten factors were weakly linked to toxicities, including AHQ and a high baseline neutrophil count. The best performance predictive models had only low–moderate accuracies,…
Genes, proteins, chemicals, diseases, species, mutations and cell lines named across the full text — each resolved to its canonical identifier and authoritative record.
Click any figure to enlarge with its caption.
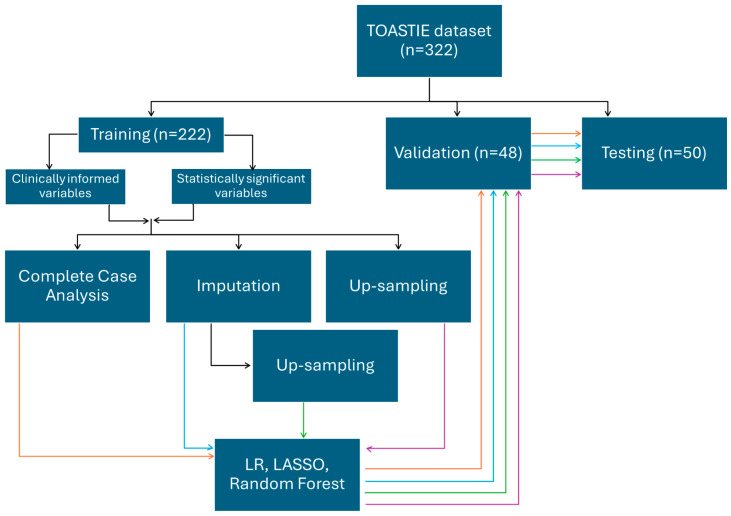 Figure 1
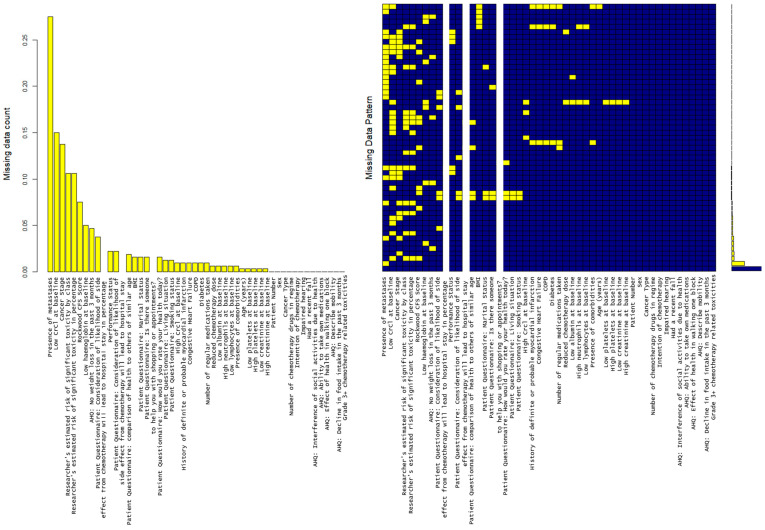 Figure 2
Peer Reviews
No public reviews on file for this paper yet. If you reviewed it on a platform where reviews are public (OpenReview, ICLR, NeurIPS, ICML), you can paste yours below so the community can read it here.
Videos
No videos yet. Explain this paper in a talk, walkthrough, or lecture? Add one.
Taxonomy
TopicsFrailty in Older Adults · Health Systems, Economic Evaluations, Quality of Life · Nutrition and Health in Aging
1. Introduction
The United Kingdom (UK) has an aging population, with the number of adults aged 65 years and older estimated to increase by a third to 10 million by 2040 [1]. This aging population, combined with better diagnostic pathways and treatment outcomes, is driving a growing percentage of the population within this age bracket to live with and beyond cancer [2]. Chemotherapy remains a core element of many curative and palliative treatments, but previous studies have demonstrated that older patients are more likely to experience treatment-related toxicities [3,4]. Despite this, robust mechanisms for the identification of older patients who will develop significant toxicity remain elusive [5]. This increased risk of significant toxicity has resulted in altered clinical practice in many settings, with older patients often receiving less intensive treatment either by reducing doses or limiting the number or types of systemic treatments offered [6,7]. This results in a situation where some patients who would have tolerated more aggressive treatment are undertreated, potentially limiting the benefits of their chemotherapeutic interventions. Other patients, however, will still develop significant toxicity, negatively impacting their quality of life to a greater extent, limiting or nullifying the benefits they gain from this treatment [8,9].
The evidence base for the management of older patients is lacking as many randomized controlled trials exclude older patients due to age, frailty or presence of comorbidities [2,6]. Results from younger, fitter patients are therefore extrapolated onto an older and often multimorbid population [10]. Providing tailored information to support clinician and patient decision making in older patients is therefore often a challenge, as outcomes in terms of therapeutic response or side effects can vary significantly [11]. Practice in how to manage older patients with cancer often varies across geographies and is often pointed to as a potential explanation for significant outcome differences in cancer when comparing the UK to other high-income countries [12]. A review from the International Society of Geriatric Oncology has found that there is a lack of representation of older adults across European guidelines [13]. This is a recognized issue in the UK, which the recent Royal College of Radiologists (RCR) guidelines aim to address by making assessment and management for patients’ frailty an essential part of cancer care [14].
Over the past decade, research around the concepts of multi-morbidity and frailty has had growing interest [15,16]. Within the oncology setting, several predictive tools have been developed to support the assessment of the risk of chemotherapy toxicity, including the Cancer and Aging Research Group (CARG) score [5] and the Chemotherapy Risk Assessment Scale for High-Age Patients (CRASH) Score [17]. Despite their use in some clinical settings, their evidence base is variable [12], and the level of accuracy has been shown within the TOASTIE study to be limited in a UK population of older patients receiving first-line chemotherapy [18].
Given the lack of consistent evidence, this raises the question of whether it is feasible to use baseline demographic data within a bespoke scoring system to predict toxicity to a clinically useful level. This study aims to answer this question by evaluating the baseline characteristics and frailty assessment information for predicting whether older individuals will develop high-grade toxicity when treated with chemotherapy.
2. Materials and Methods
2.1. Data Source
This study makes use of data previously collected within the TOASTIE study [18,19,20], a prospective observational study which included 339 patients recruited across 18 NHS institutions between 2021 and 2022. Included patients were over the age of 65 prior to commencing first-line chemotherapy for a solid-organ malignancy with any intent. Full information about the study protocol can be found within their published protocol paper [20].
Anonymized data from the TOASTIE study were used for analysis and predictive model building in this study.
2.2. Data Collection and Items
The TOASTIE dataset [20] included data items collected at baseline. These included demographics, tumor diagnostic information, treatment information, a questionnaire about the patient’s own health assessment, Rockwood Clinical Frailty Score (CFS) [21] as part of the Additional Health Questionnaire (AHQ) and researcher-estimated risks of toxicities (using the CARG score [5]). The outcome of interest was the occurrence of severe (grade 3+) chemotherapy-related toxicity in each case, as defined by the National Cancer Institute Common Terminology Criteria for Adverse Events v5 [22]. A list of all data items within the dataset can be found in Supplementary List S1.
2.3. Data Analysis
All data analysis was undertaken using R version 4.3.1 and standard packages available on CRAN. A list of the non-base R packages can be found in Supplementary List S2.
2.3.1. Inclusion/Exclusion Criteria
All patients meeting the initial TOASTIE study inclusion criteria were included. Patients for whom the outcome (grade 3–5 chemotherapy-related toxicities) was unavailable were excluded.
2.3.2. Internal Validation of Models
Prior to building the predictive models, patients were separated into train, validation and test cohorts in a 70:15:15 ratio. The cohorts were partitioned based on the ratio of presence and absence of the dependent (grade 3+ toxicities). An up-sampled training set was generated to address the class imbalance in the original dataset. Instances of patients with grade 3+ toxicities were oversampled until there was a balanced number of instances of “toxicity” and “no toxicity”. This was only performed for the training data, while the validation and test data were left unchanged.
2.3.3. Handling Missing Data
The patterns and scale of missingness were assessed for each variable within the dataset. For variables assumed missing at random, Multivariate Imputation by Chained Equations (MICE) imputation was implemented. MICE imputation was applied on both the original and up-sampled training sets. These were referred to as “imputed training sets”. Complete case analysis was also applied to the original and up-sampled training sets, these will be referred to as the “complete case training sets”.
2.3.4. Selecting Variables
Candidate Data Items
Data items included in the analysis were taken from the TOASTIE trial dataset. The original dataset included 40 demographics, self-assessment, and researcher’s assessment variables. A full list can be found in Supplementary List S1.
Variable Selection
Two approaches were applied to identify relevant variables for inclusion within the subsequent modeling strategies: by clinical knowledge and by using statistical associations.
Four medical doctors including one cancer specialist reviewed the data items available within the dataset. They developed a consensus of variables to be used based on their clinical knowledge and expertise.
A second numerical approach to variable selection was conducted where Spearman’s correlation was used to identify associations between continuous variables. Chi-square (χ^2^) or Fisher’s exact test was used for categorical variables depending on the number of samples. When a particular observation type is small (<5), Fisher’s exact test was applied. Variables were tested against presence of grade 3+ chemotherapy-related toxicities for associations. Statistical significance was considered at p < 0.05.
2.3.5. Building Predictive Models
Three methods were used, including logistic regression, LASSO and random forest. All three methods were applied on the eight training sets generated above (Figure 1).
Logistic Regression
Logistic regression was carried out with glm from the stats package with the binomial family. Two formulas were built: one based on the clinically informed variables and the other based on the statistically significant variables. The training dataset was used to build predictive models with each formula. The validation set was used to find the optimal cut point for classification. The method of cut point estimation was by maximizing the sum of sensitivity and specificity. The testing set applied the said cut point and produced the results. The model performance metrics will be reported from all sets for evaluation.
LASSO
Variables were treated as numeric for LASSO-logistic regression. LASSO-logistic regression models were trained by the training datasets for the clinically informed variables and separately for the statistically significant variables, as illustrated in Figure 1. To determine the optimal regularization parameter (“best lambda”), the validation dataset was used. This served to balance the trade-off between bias and variance, minimizing the overall error to optimize the model’s performance. Subsequently, the models were tested with the best lambda value on the test dataset to assess the predictive accuracy.
Random Forest
In order to develop the random forest models, the “ranger” package from R was used. To optimize the predictive performance of the random forest models that were developed, a systematic approach to hyperparameter tuning was employed. This involved first creating a tuning grid, which consisted of key hyperparameters, including the following:
- Mtry: This parameter determines the number of variables randomly sampled at each split in the decision trees of the random forest. Values of 2, 4, and 6 were tested to evaluate different feature subset sizes.
- splitrule: Two splitting rules, “gini” and “extratrees”, were evaluated to determine the optimal method for partitioning nodes in the decision trees.
- min.node.size: This parameter specifies the minimum number of observations required to create a terminal node in the tree. Values of 1, 3, and 5 were selected to assess model sensitivity to node size.
Following the establishment of the tuning grid, each model configuration was trained and evaluated using five-fold cross-validation. This was performed to reduce the risk of overfitting by helping to provide a reliable estimate of the model’s performance on unseen data.
Further tuning was then conducted using several combinations of tree numbers. Each model was built with 50 trees for consistency and to prevent overfitting due to the relatively small datasets.
After completing the tuning process, the optimal set of hyperparameters was identified based on maximizing accuracy across the cross-validated folds. Using the best-tuned hyperparameters for each data split, the final random forest models were constructed using the entire training dataset. These models were then tested on the “test” datasets.
2.3.6. Model Performance Evaluation
For logistical regression and LASSO, the performances of the models were optimized using the validation data, by finding the optimal cut point and best lambda values, respectively; holdout testing data was used to assess the model’s robustness and generalizability.
In the case of random forest, cross-validation was employed during the training process to tune the hyperparameters, and holdout testing data was then used to assess the model’s generalizability.
Performance metrics of each of the models, including accuracy with a 95% confidence interval, p-value, sensitivity (or recall), specificity, positive predictive value (PPV) (or precision), negative predictive value (NPV) and balanced accuracy were reported. Receiver Operating Characteristic (ROC) curves were plotted to visualize the trade-offs between sensitivity and specificity for different threshold values. The area under the curve (AUC) was then determined for each ROC curve to give a measure of overall performance.
3. Results
3.1. Demographic Results
A total of 322 (92.8% of TOASTIE data) patients were included. In total, 164 (50.9%) were males. The incidence of Grade 3+ toxicities was 22.0% (71/322). The baseline characteristics of the patients can be found in Table 1. Most (274, 85%) patients were of good Performance Status (WHO Performance Status 0 or 1), and similar numbers (276, 86%) lived with very mild frailty (Rockwood CFS ≤ 4).
Four variables were excluded at this stage, including patient number, as this was irrelevant to the analysis. Height and weight were removed as BMI (Body Mass Index) was included. There was a duplication and/or error in data collection for the number of comorbidities, as the number was not all 0 when it was stated as “no” in the “presence of comorbidities”. Only one column was kept with regard to comorbidities (yes/no). “Presence of psychological issues” was removed due to data quality issues.
Results of the partition of data into training, validation and test cohorts can be found in Supplementary Table S1. Each partition has 21–24% of patients with G3+ toxicities.
Missing data is analyzed with results shown in Figure 2. There are five variables where >15% of observations are missing (high creatinine clearance levels, low creatinine clearance levels, cancer stage, presence of metastases and Karnofsky performance score). 27.4% of data was missing with regard to the presence of metastasis. There is no identified pattern to missingness (Figure 2).
The selected clinically informed variables were age, sex, BMI, ECOG Performance Status, cancer type, number of chemotherapy drugs, presence of co-morbidities and number of regular medications.
Table 1 shows the ten variables from the baseline demographics and patient-reported factors that were statistically different between groups with and without toxicities. The variables include the WHO/ECOG Performance Status score; a high count of baseline neutrophils; six measures from the Assessment of Health Questionnaire (interference of social activities, ability to take own medication, effect of health in walking one block, weight loss in the past 3 months, general mobility and decline in food intake); Rockwood Clinical Frailty Score; and patient’s own measure of comparison of own health to others. The full table of demographics and patient factors can be found in Supplementary Table S2.
3.2. Statistical Associations of Variables
The results from univariate regression and multivariate regression analyses using the ten clinically informed variables can be found in Table 2. Univariable regression analysis independently analyzed each variable for any potential relationship with the dependent (grade 3+ chemotherapy-relatedtoxicities). From the univariable regression, only Rockwood CFS had a statistically significant (p < 0.05) coefficient. Multivariable regression analysis was performed with the ten clinically informed variables, of which Performance Status and the number of chemotherapy drugs were statistically significant. Furthermore, after multiple imputation was performed, another multivariable regression analysis with all variables was performed to observe for any complex relationships between all the available variables and the dependent. With a small effect (coefficient of 0.92), the researcher’s estimated risk of significant toxicity in percentage is the only statistically significant variable from the multivariable regression analysis.
3.3. Performance of Predictive Models
The model performance metrics on the test dataset can be found in Table 3. Across the different modeling methods, the models with clinically selected variables have a balanced accuracy between 0.4298 and 0.6075, with an AUC between 0.4298 and 0.636. As for the models using identified significant variables, the balanced accuracies range between 0.5724 and 0.6469, with an AUC between 0.5724 and 0.659. All performance metrics, including sensitivity, specificity, negative predictive value and positive predictive value, can be found in Supplementary Table S3. The full code for all analyses can be found via the link in Supplementary Link S1.
4. Discussion
Several models have been developed to predict chemotherapy toxicity, including the CRASH and CARG scores. Despite their common use in clinical settings, their evidence base varies. A study has shown that their predictive performances of overall toxicities were similar, with a ROC-AUC between 0.650 and 0.681 [11]. An Australian study has found that 58% of those classified by the CARG score as low risk, in fact, had severe toxicities [24]. The TOASTIE study also found limited accuracy for application in a UK population of older patients [17]. This prompts the question of whether using baseline frailty data in a precise scoring system is feasible for predicting toxicity. The tolerance of chemotherapy in older cancer patients is a concern, as predicting the risk of chemotherapy toxicity in advance can help clinicians identify vulnerable populations, allowing for more personalized treatment plans.
This current study has reused the data collected as part of a prospective UK multicenter study, with attempts to develop an objective predictive model based on an older cohort. Despite various model-building methods, results were at best only marginally better than chance, with the balanced accuracy of most models hovering around 60%. For example, a model built with logistic regression using complete cases, with variables determined by statistical associations, achieved a balanced accuracy of 64% and a negative predictive value (NPV) of 87%. While models with low balanced accuracy may still have clinical utility, such as reliably ruling out toxicity, this logistic regression model is particularly promising with its high accuracy in predicting no-toxicity. The model’s ability to accurately predict no toxicity allows clinicians to identify patients unlikely to experience adverse effects from standard dosing. This may support more confident decision making to avoid unnecessary dose reductions, which can compromise therapeutic efficacy, and allow patients to begin treatment at full dose. Furthermore, a high NPV model provides a strong basis for clinician–patient discussions regarding treatment safety. When used in combination with the Comprehensive Geriatric Assessment by the International Society of Geriatric Oncology (SIOG), patients can be reassured when the model predicts low risk and scores are low, potentially improving adherence and reducing anxiety [2]. It is interesting to note that the top predictors of the statistically identified variables used in this model include WHO Performance Status and patient-reported interference of social activities due to health—the clinical significance of this is unclear and requires further investigation. Furthermore, it would be prudent to collect larger cohorts to enable analysis of any differences between patients who had initial dose reductions and patients who subsequently had dose reductions.
Previously published research suggested that there is clinical utility with the use of baseline data in predicting high-grade toxicity in older patients receiving chemotherapy [25] or for the use of risk prediction for specific cancers [26]. The results of this study, however, provide insufficient evidence for this. Across the multiple combinations of variables and modeling strategies applied, no models were able to robustly predict adverse toxicity outcomes (Table 3). The performance of the models showed an imbalance between PPV and NPV. Even the statistical association between individual variables and outcomes was extremely limited. These results suggest that the baseline variables collected within the TOASTIE study do not explain enough of the variation around the mean to enable robust predictions. However, it is worth noting the results from the univariate analysis (Table 1) as the statistically significant variables do correlate with the previous literature [27,28,29,30]. Further research should also explore clinicians’ intuition, as measured by the “Researcher’s estimated risk of significant toxicity in percentage”, which may play a role in a prediction model (Table 2). It would also be interesting to investigate how clinicians’ length of experience affects their estimated risks of toxicities for a patient.
When considering the potential value of a clinical prediction tool, it is important to assess the threshold at which the performance enables the output to become clinically actionable. While patient data from different hospitals could potentially provide external validation, considering local patient sets or specific cancer types might yield better results. Additionally, the variability in chemotherapy regimens—such as dosage and drug combinations—may not be fully accounted for in the current models. These would be potential areas for further development in future research; however, they would require much larger datasets to represent these sub-cohorts at a sufficient scale for any patterns to emerge.
In our study, several limitations need consideration. First, the sample size was modest in size, and missing data posed challenges despite using imputation techniques like MICE. The incidence of grade 3–5 toxicities within our dataset was relatively low (just over 20%) in the whole cohort, which led to class imbalance issues that could impact model performance, especially in terms of sensitivity and specificity for the minority class. Although this was dealt with using methods such as up-sampling, this might have introduced bias or overfitting. Up-sampling is a technique that involves duplicating minority class samples, but it can mislead the model’s learning, resulting in poorer performance on unseen data. While up-sampling was employed to address class imbalance, it inherently carries the risk of overfitting, particularly when the model begins to memorize duplicated instances of the minority class rather than learning generalizable patterns. This can lead to inflated performance during training but poorer generalization to unseen data. To mitigate this, up-sampling was strictly confined to the training dataset, ensuring that the test data remained untouched and unbiased. Furthermore, model validation using separate test sets helped assess true predictive performance and reduce the likelihood of overfitting-induced optimism in reported metrics. Evaluation bias has been minimized in our methods as up-sampling is performed only on the training dataset, not the test dataset. This avoids inflated performance metrics due to data leakage. Further, our models were constructed using a specific set of variables, potentially excluding other important predictors of chemotherapy toxicity. Although two methods were applied, including using clinical knowledge and then with statistically significant data, there might be other combinations of variables, which could improve the model. A brute force approach involves systematically exploring all possible combinations of variables without any optimization or shortcuts, potentially identifying interactions and predictors that were otherwise overlooked. This method was considered the last option to theoretically be able to exhaust all other possible outcomes for a possible model. However, early in the study, it was apparent that there was insufficient computational power to complete this analysis and thus remains a limitation to the study. Despite this, our results (Table 3) remain supportive in that baseline frailty data are insufficient to provide clinical use in predicting risk of toxicity. Conversely, it is important to note that there is potential to design a no-toxicity prediction for identifying low-risk patients. As shown by the slightly higher NPV from one of the modeling strategies, it seems that data of this type is more suited to predictions of said class rather than the minority class. It is prudent to use larger datasets in the future to aim for a model with a clinically useful NPV.
5. Conclusions
Variables collected from CARG or at the patient’s baseline lack robust clinical utility to guide treatment direction based on the risk of chemotherapy-related toxicities. Several methods have been trialed, and none have yielded robust results. Clinicians should carefully reconsider the use of CARG or other variables when assessing a patient’s risk of developing severe chemotherapy-related toxicity. However, there is scope to enhance the prediction of no toxicity, which in turn can identify lower-risk patients who may not require dose reductions, potentially improving overall outcomes. Further research into other baseline variables is required for building a more robust predictive scoring system.
The reference list from the paper itself. Each links out to its DOI / PubMed record.
- 1Centre for Ageing Better Our Ageing Population: The State of Ageing 2023–20242023 Available online: https://ageing-better.org.uk/our-ageing-population-state-ageing-2023-4(accessed on 1 October 2025)
- 2Wildiers H. Heeren P. Puts M. Topinkova E. Janssen-Heijnen M.L.G. Extermann M. Falandry C. Artz A. Brain E. Colloca G. International Society of Geriatric Oncology Consensus on Geriatric Assessment in Older Patients With Cancer J. Clin. Oncol.2014322595260310.1200/JCO.2013.54.834725071125 PMC 4876338 · doi ↗ · pubmed ↗
- 3Kalsi T. Babic-Illman G. Ross P.J. Maisey N.R. Hughes S. Fields P. Martin F.C. Wang Y. Harari D. The Impact of Comprehensive Geriatric Assessment Interventions on Tolerance to Chemotherapy in Older People Br. J. Cancer 20151121435144410.1038/bjc.2015.12025871332 PMC 4453673 · doi ↗ · pubmed ↗
- 4Bhatt V.R. Cancer in Older Adults: Understanding Cause and Effects of Chemotherapy-Related Toxicities Future Oncol.2019152557256010.2217/fon-2019-015931339058 PMC 7857338 · doi ↗ · pubmed ↗
- 5Hurria A. Togawa K. Mohile S.G. Owusu C. Klepin H.D. Gross C.P. Lichtman S.M. Gajra A. Bhatia S. Katheria V. Predicting Chemotherapy Toxicity in Older Adults With Cancer: A Prospective Multicenter Study J. Clin. Oncol.2011293457346510.1200/jco.2011.34.762521810685 PMC 3624700 · doi ↗ · pubmed ↗
- 6Hurria A. Levit L.A. Dale W. Mohile S.G. Muss H.B. Fehrenbacher L. Magnuson A. Lichtman S.M. Bruinooge S.S. Soto-Perez-de-Celis E. Improving the Evidence Base for Treating Older Adults With Cancer: American Society of Clinical Oncology Statement J. Clin. Oncol.2015333826383310.1200/JCO.2015.63.031926195697 · doi ↗ · pubmed ↗
- 7Scher K.S. Hurria A. Under-Representation of Older Adults in Cancer Registration Trials: Known Problem, Little Progress J. Clin. Oncol.2012302036203810.1200/JCO.2012.41.672722547597 · doi ↗ · pubmed ↗
- 8Hamaker M. Lund C. te Molder M. Soubeyran P. Wildiers H. van Huis L. Rostoft S. Geriatric Assessment in the Management of Older Patients with Cancer—A Systematic Review (Update)J. Geriatr. Oncol.20221376177710.1016/j.jgo.2022.04.00835545495 · doi ↗ · pubmed ↗