GhTGA2, a Potential Key Regulator of Salt Stress Response: Insights from Genome-Wide Identification of TGA Family Genes Across Ten Cotton Species
Lu Meng, Jiliang Fan, Shandang Shi, Faren Zhu, Ganggang Zhang, Junwei Wang, Zihan Li, Fei Wang, Hongbin Li

TL;DR
This study identifies and characterizes TGA genes in cotton, revealing GhTGA2 as a key regulator of salt stress tolerance, offering insights for breeding salt-resistant cotton.
Contribution
The first genome-wide identification and functional analysis of TGA genes in ten cotton species, highlighting GhTGA2's role in salt stress response.
Findings
74 TGA homologous genes were identified across ten cotton species, showing conserved domains and five distinct evolutionary branches.
GhTGA2 was found to be significantly upregulated under salt stress and its silencing reduced salt tolerance in cotton.
TGA genes are implicated in growth regulation and stress adaptation through hormone-mediated signaling pathways in cotton.
Abstract
Background: The TGACG-BINDING FACTORS (TGA) gene family, a key subgroup of bZIP transcription factors, mediates plant stress responses and developmental processes by binding to the as-1 cis-element in target gene promoters to regulate transcriptional activation or repression. Despite its functional significance, systematic characterization of TGA genes in cotton (Gossypium spp.) remains insufficient. Methods: In this study, we performed a comprehensive genome-wide identification and phylogenetic analysis of TGA members across 10 Gossypium species and verified the functions of candidate genes using VIGS technology. Results: A total of 74 TGA homologous genes with conserved DOG1 and bZIP domains were identified. Evolutionary analysis revealed that the cotton TGA gene family can be classified into five distinct branches, suggesting functional diversification. Functional prediction analyses…
Genes, proteins, chemicals, diseases, species, mutations and cell lines named across the full text — each resolved to its canonical identifier and authoritative record.
Click any figure to enlarge with its caption.
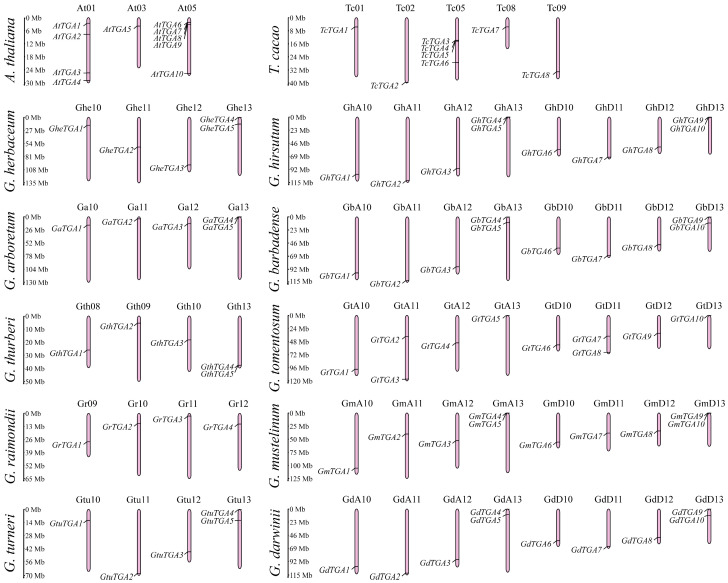 Figure 1
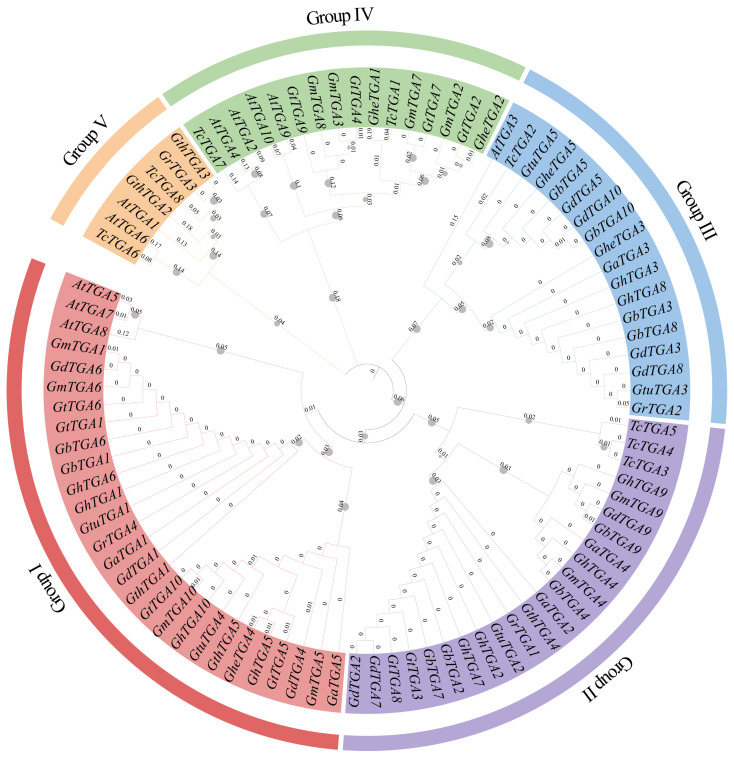 Figure 2
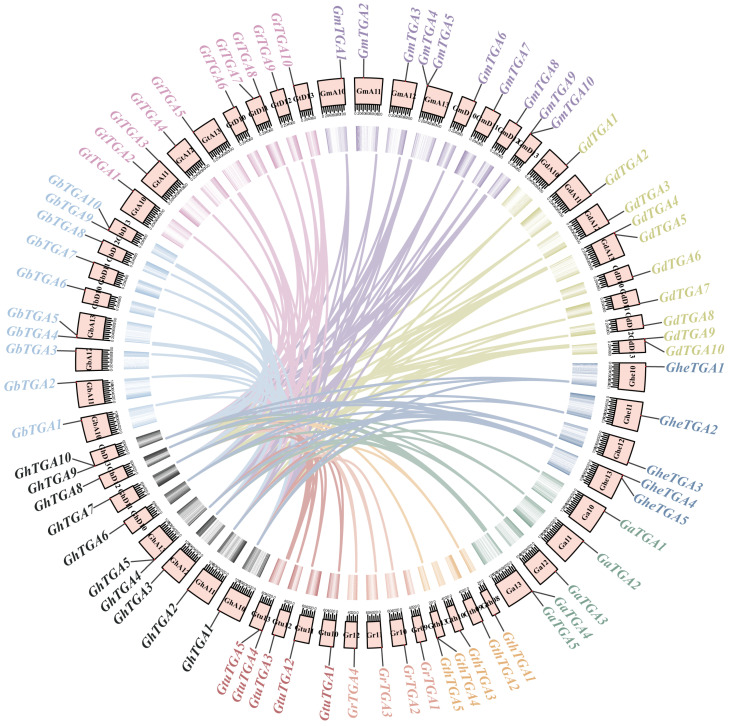 Figure 3
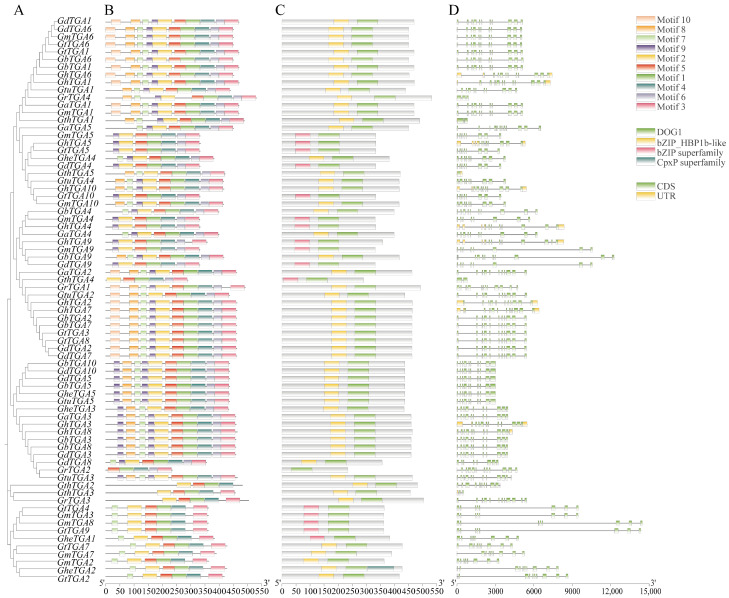 Figure 4
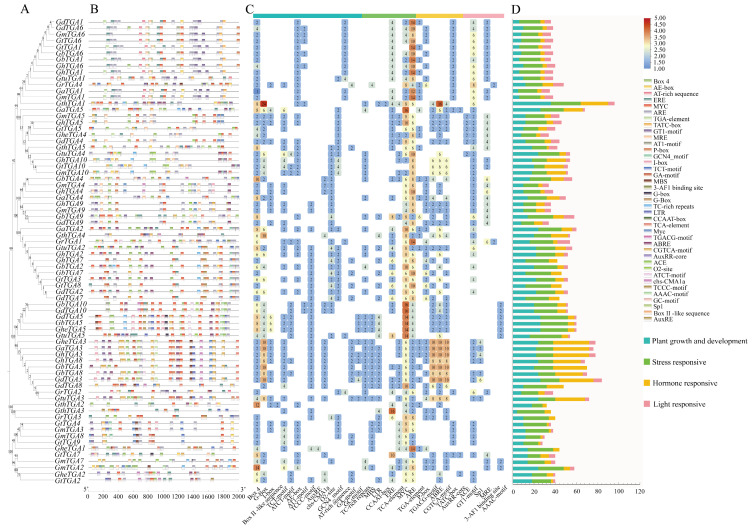 Figure 5
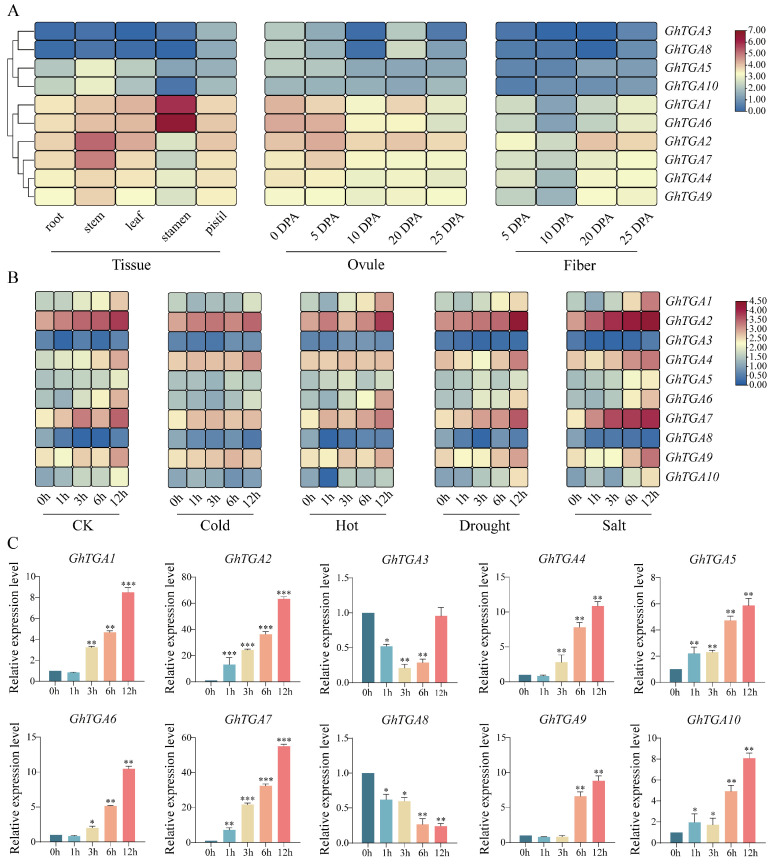 Figure 6
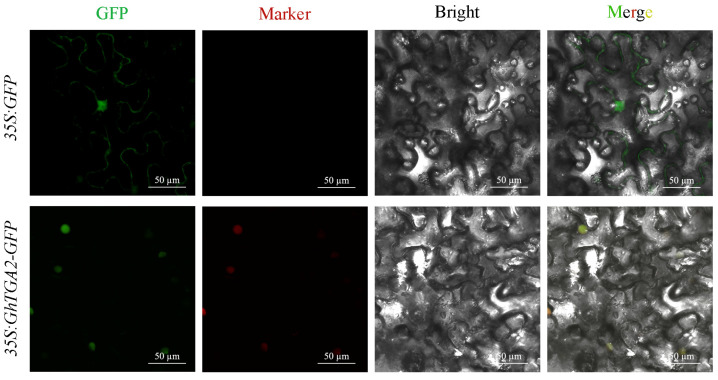 Figure 7
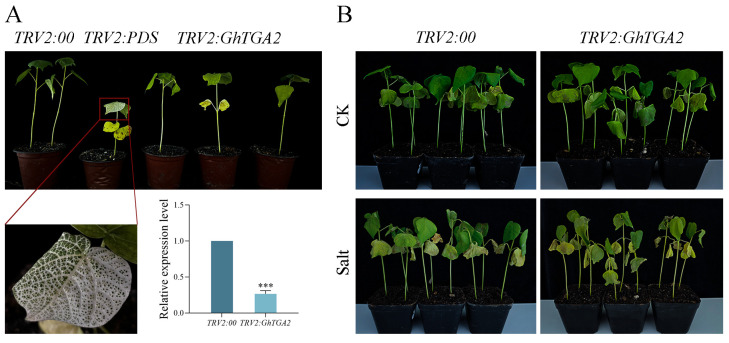 Figure 8
- —the projects sponsored by Science and Technology Project of Xinjiang
- —Science and Technology Project of Bingtuan
- —Tianshan Talent Project of Xinjiang
- —the development fund for Xinjiang talents XL
- —Science and Technology Project of Shihezi University
Peer Reviews
No public reviews on file for this paper yet. If you reviewed it on a platform where reviews are public (OpenReview, ICLR, NeurIPS, ICML), you can paste yours below so the community can read it here.
Videos
No videos yet. Explain this paper in a talk, walkthrough, or lecture? Add one.
Taxonomy
TopicsResearch in Cotton Cultivation
1. Introduction
Cotton is a significant economic crop cultivated extensively across the globe. As arable land continues to diminish, optimizing the use of saline-alkali land for cotton cultivation becomes crucial for ensuring the sustainable development of cotton production [1]. Cotton exhibits moderate salt tolerance, with sensitivity varying across growth stages; notably, the seed germination and seedling phases are particularly sensitive to salt stress [2]. The salt tolerance in cotton is a complex quantitative trait controlled by multiple genes and can be significantly influenced by environmental factors [3]. G. hirsutum represents the most widely grown variety worldwide, accounting for approximately 95% of global cotton planting area. However, current commercial G. hirsutum cultivars exhibit limited salt tolerance, rendering them inadequate for cultivation in saline-alkali environments [4]. Furthermore, soil salinization poses a global ecological challenge that hampers sustainable agricultural development and has resulted in substantial yield reductions on nearly one-third of irrigated lands worldwide [5]. Salt stress induces multifaceted damage in plants, primarily including osmotic stress, ion toxicity, and subsequent oxidative stress among others [6]. Consequently, identifying salt-tolerant genes within G. hirsutum and elucidating its salt-adaptation mechanisms are essential steps toward breeding resilient cotton varieties capable of enhancing yields in saline-alkali conditions.
The bZIP (basic region/leucine zipper) transcription factor family is a prevalent class of transcription factors in plants, characterized by its conserved bZIP domain [7]. This bZIP domain consists of 60–80 amino acid residues and comprises a highly conserved basic amino acid region (basic region, BR) as well as a leucine zipper region (Leucine zipper region, LZ) [8]. By interacting with the core sequence ACGT located in the promoter regions of target genes, these factors regulate the expression of downstream genes, thereby executing their biological functions [9]. Based on structural characteristics and variations in the cis-acting elements they recognize, the bZIP transcription factor family can be categorized into ten subfamilies (A–I and S) [10]. These subfamilies exhibit evolutionary conservation throughout evolution while each possesses distinct functional attributes. These proteins regulate critical biological processes during various stages of plant growth and development, and also contribute to adaptive responses to biotic pathogens and abiotic environmental challenges [11]. Notably, members of the D subfamily are capable of binding to the activating sequence 1 element (as-1, 5′-TGACGTC-3′) within the promoter region of the Nicotiana tabacum pathogenesis-related protein gene PR-1a; consequently, they are also designation TGACG-BINDING FACTORS (TGA) [12,13].
TGACG-binding (TGA) transcription factors are among the earliest studied plant transcription factors, first identified and characterized in N. tabacum in 1989 [14]. Currently, members of the TGA gene family have been identified and extensively studied across various model plants, including A. thaliana, N. tabacum, Zea mays, Cucumis melo, Helianthus annuus, Citrus sinensis, Brassica napus, Arachis hypogaea, Carica papaya, and Musa acuminata [15,16,17,18,19,20,21,22,23,24]. In dicotyledonous plants specifically, ten A. thaliana TGA gene family members—AtTGA1–7, AtPAN and AtTGA9–10—have been investigated most comprehensively [25]. In A. thaliana based on amino acid sequence similarity; TGA transcription factor family members can be categorized into five distinct groups: group I comprises AtTGA1 and AtTGA4; group II includes AtTGA2 as well as AtTGA5 and AtTGA6; group III consists of AtTGA3 and AtTGA7; group IV encompasses both AtTGA9 and AtTGA10; while group V is represented solely by AtPAN (PERIANTHIA) [26]. Notably, TGA transcription factors from different groups exhibit specific structural and functional differences. Groups I through III contain typical bZIP domains that enable interaction with NONEXPRESSOR OF PATHOGENESIS-RELATED GENES 1 (NPR1), thereby participating in the plant’s disease resistance response [27]; conversely groups IV and V possess relatively unique structures that play crucial roles in regulating flower organ development among other functions [28]. The TGA gene family exhibits a similar classification method across various plant species. In Z. mays, the ZmTGA gene family can be categorized into five distinct groups [17]. The MaTGA gene family in M. acuminata is divided into four subgroups [18]. Additionally, seven CsTGAs genes have been identified within the C. sinensis genome and classified into five subgroups [21]. In Oryza sativa, there are ten members of the TGA transcription factor family, which can also be organized into five groups and exhibit a high degree of homology with the A. thaliana TGA transcription factor family [29]. The TGA gene family represents a crucial component of the bZIP transcription factor family, playing significant roles in plant growth and development as well as responses to both biotic and abiotic stresses. This is achieved through their involvement in hormone response pathways that regulate plant resistance or flower organ development [30]. Research has demonstrated that overexpression of the GmTGA26 gene in G. max can alleviate membrane oxidative damage to cell membranes caused by salt stress in soybean leaves while significantly enhancing salt tolerance in G. max plants [31].
Currently, there is a paucity of studies focusing on the TGA transcription factor family in cotton. To date, only one GhTGA2.2 gene has been cloned in research pertaining to cotton’s response to Verticillium dahliae [32]. Furthermore, the genome-wide characteristics of the TGA transcription factor family in Gossypium and its regulatory mechanisms under salt stress remain largely unexplored. In this study, we performed a comprehensive genome-wide analysis of the TGA transcription factor family across ten cotton varieties—comprising five diploid (A/D genomes) and five allotetraploid (AD genomes) species—for the first time. Utilizing whole-genome data, we successfully identified members of the TGA gene family within each Gossypium variety. Phylogenetic analysis elucidated evolutionary relationships between cotton TGA factors and their orthologs in A. thaliana (AtTGAs) and Theobroma cacao (TcTGAs). Additionally, detailed information regarding chromosomal locations, gene structures, conserved motifs, promoter cis-acting elements, and physicochemical properties of the TGA gene family in cotton were thoroughly examined. Subsequently, we investigated tissue-specific expression patterns and expression profiles of the TGA gene family in G. hirsutum subjected to various stress conditions through transcriptome data analysis. GhTGA2 was ultimately selected as a candidate gene for further investigation. To validate its function under salt stress conditions in cotton, we employed VIGS technology to silence the GhTGA2 gene in G. hirsutum. This study aims to elucidate the regulatory signaling pathways involved in the response of TGA transcription factors to salt stress in cotton, ultimately identifying key genomic regions that can be targeted for developing stress-tolerant varieties via molecular breeding strategies.
2. Materials and Methods
2.1. Identification of TGA Gene Families
The gene annotation files, gene sequences, and protein sequence data for both diploid and tetraploid cotton species were obtained from the Cottongen database [33]. Additionally, biological information for the cotton-related species T. cacao was obtained from NCBI. The genome annotation and sequence data of A. thaliana utilized in this study were sourced from the TAIR database [34]. Blastp alignment was conducted using TBtools software (v2.210) [35] to identify candidate members of the TGA family in cocoa and ten cotton varieties. Furthermore, conserved protein domains were analyzed using NCBI’s CD-Search function to ensure that identified protein sequences contained DOG1 and bZIP domains. The number of TGA family members was determined accordingly.
2.2. Chromosomal Localization and Properties of Proteins of the TGA Family
Based on the TGA family genome annotation file, identify the seat numbers of TGA genes and utilize TBtools (v2.210) to extract the chromosome lengths for A. thaliana, T. cacao, and 10 Gossypium species. Next, utilize the online tool MG2C_v2.1 to map the exact chromosomal positions of the TGA gene family members [36].
2.3. Phylogenetic and Collinearity Analysis of TGA Gene Families
In this study, we conducted phylogenetic analyses of the protein sequences encoded by the TGA gene family in Gossypium, A. thaliana, and T. cacao. The data analysis was conducted through multidimensional alignment of protein sequences employing the ClustalW alignment tool integrated within the MEGA7.0 (v7.0.26) software suite. Phylogenetic relationships were reconstructed utilizing the Neighbor-Joining algorithm, with 1000 bootstrap iterations implemented for node support evaluation [37]. The generated phylogenetic tree was visualized using TBtools (v2.210) software and plotted utilizing the online mapping site iTOL [38]. Furthermore, we prepared a genomic annotation file for the cotton TGA gene family and utilized TBtools (v2.210) software to analyze collinearity relationships among members of this gene family throughout evolution [39].
2.4. Genomic Architecture, Evolutionarily Conserved Motifs, and Structurally Preserved Domains in Cotton TGA Family
The exon–intron architecture was graphically represented using the Gene Structure Visualization module within TBtools (v2.210), based on annotated genomic sequences derived from the Gossypium TGA transcription factor group [35]. The MEME Suite [40], Pfam, PROSITE, and Motif Scan were utilized for predicting conserved protein sequences and analyzing domain structures. Additionally, ProtParam online tools were employed to assess the physical and chemical properties of cotton TGAs [17].
2.5. Identification of cis-Regulatory Motifs in Gossypium TGA Transcription Factor Promoters
The 2000 bp region upstream of the cotton TGAs sequence was selected as the promoter region for the Gossypium TGAs gene. This sequence was uploaded from PlantCare for analysis of promoter cis-elements. The results of this analysis were visualized using TBtools (v2.210) [41].
2.6. Expression Patterns of the TGA Gene Family in G. hirsutum and Their Responses to Stress
In order to investigate the tissue-specific expression of TGA family genes in G. hirsutum and their distinct response patterns to various stressors, we analyzed and processed published transcriptome data under different conditions. Transcriptome data for G. hirsutum tissues and abiotic stress were downloaded from the NCBI SRA website, and the genome sequencing project with accession number PRJNA248163 [42]. This investigation allowed us to determine the expression patterns of TGA transcription factors in distinct tissues and organs of G. hirsutum, while also elucidating their regulatory dynamics under various abiotic stress conditions, including low temperature, thermal stress, water deprivation, and salinity exposure. Heat maps illustrating these expression profiles were generated using TBtools (v2.210).
Download the coding sequence (CDS) information for the TGA gene of G. hirsutum from the Cotton MD database. Subsequently, design specific fluorescence quantitative PCR primers related to this gene using Prime 5.0 software (Table S2). Revised version: Total RNA isolation was performed with the RNAprep Pure Polyphenol-Polysaccharide RNA Extraction Kit, followed by complementary DNA synthesis using reverse transcriptase. GhUBQ6 served as the constitutive control for normalization. Four-week-old G. hirsutum plants underwent sodium chloride (NaCl) treatment (200 mM) with subsequent sampling at 60, 180, 360, and 720 min intervals post-exposure [43]. Subsequent to experimental interventions, RNA specimens underwent reverse transcription to generate cDNA templates for real-time quantitative PCR (qPCR) profiling. The amplification protocol comprised (1) preliminary denaturation at 95 °C (5 min); (2) 40 repetitive cycles incorporating 95 °C denaturing phase (30 s), and 60 °C primer hybridization/elongation stage (60 s). Transcript quantification was executed via the 2^−ΔΔCt^ algorithm with triplicate experimental replicates ensuring analytical reproducibility.
2.7. Subcellular Localization of the Candidate Gene GhTGA2
Primer design was conducted using Primer 5.0 software (Table S2), incorporating Kpn Ⅰ (GGTACC) and Xba Ⅰ (TCTAGA) restriction sites at the 5′ ends of the upstream and downstream primers, respectively. The target fragment, approximately 1390 bp in length, was PCR amplified utilizing cDNA from GhTGA2 as a template. Following sequencing verification of the amplified gene, the GhTGA2 gene fragment was inserted into the expression vector pCAMBIA1300-eGFP. The recombinant vector pCAMBIA1300-eGFP:GhTGA2 was subsequently obtained after digestion verification. The constructed pCAMBIA1300-eGFP:GhTGA2 vector was transformed into A. rhizogenes GV3101 and infiltrated into the leaves of four-week-old N. tabacum plants (N. benthamiana). The plants were then incubated in darkness for 48 h to facilitate transformation. Epidermal fluorescence emission patterns in N. benthamiana foliar specimens were acquired through laser-scanning confocal imaging (Nikon A1R HD25, Tokyo, Japan) under standardized excitation/emission parameters [44]. Agrobacterium tumefaciens cultures carrying engineered plasmid constructs were propagated in Luria–Bertani (LB) broth under selective pressure. The pCAMBIA1300-35S-mCherry-NLS vector (Puint Biotech, Taiyuan, China) was employed as a nuclear-targeted fluorescence reporter system throughout the experimental workflow.
2.8. Functional Validation of GhTGA2
To functionally characterize the saline stress resilience conferred by GhTGA2, a N. tabacum rattle virus (TRV)-mediated gene silencing platform was implemented to achieve targeted transcriptional knockdown of GhTGA2 in G. hirsutum cultivars. Primer 5.0 software was used for primer design (Table S2), and EcoR Ⅰ (GAATTC) and Xma Ⅰ (CCCGGG) restriction sites were added to the 5′ ends of the upstream and downstream primers, respectively. The VIGS-specific fragment (about 325 bp) was amplified. After sequencing verification of the amplified gene, the gene fragment was inserted into the silencing vector TRV2, and the recombinant vector TRV2:GhTGA2 was obtained after enzyme digestion verification. Meanwhile, the TRV2:GhPDS vector was constructed as a positive control. The correctly constructed silencing vectors were introduced into Agrobacterium LBA4404 by electroporation. The transformed Agrobacterium was cultured to the logarithmic growth phase, and the appropriate infection concentration was adjusted (OD 600 = 1.2). TRV1, along with TRV2 empty vectors and positive controls and TRV2:GhTGA2, were mixed in a 1:1 ratio and subsequently used to infect cotton leaves via injection. The infected cotton was dark-cultured overnight and then placed in a 25 °C cotton growth chamber with a light–dark cycle of 16 h:8 h.
Most studies have indicated that the optimal screening concentration for assessing salt tolerance in cotton is between 100 and 300 mM [43]. To mitigate the impact of soil matrix on salt concentration, we irrigated both the experimental plants and control plants with a 200 mM NaCl solution as a whole. In contrast, the control group received an equal volume of distilled water. Subsequently, they were cultured under standard conditions, and phenotypic changes were monitored after a treatment period of 15 days.
2.9. Statistical Analysis
Biological datasets were subjected to parametric analysis using SPSS 29 (IBM, Armonk, NY, USA). Inter-group variance across temporal intervals and experimental conditions was determined through Duncan’s multi-comparison procedure. Statistical thresholds were operationalized as p < 0.05 (significant), p < 0.01 (highly significant), and p > 0.05 (non-significant), maintaining family-wise error rate control.
3. Results
3.1. Identification and Chromosomal Localization of the TGA Gene Family
In this study, the AtTGA protein sequence was utilized as a reference to screen for TGA homologous sequences within the cotton database through homology comparison. The results of protein conserved domain predictions were also integrated into this analysis. Following the screening of genomic sequences and the removal of redundant entries, a total of 74 members of the TGA gene family were identified in the cotton genome. Among these, 5 TGA genes were detected in each diploid Gossypium species, including Gossypium herbaceum, Gossypium arboreum, Gossypium thurberi, Gossypium raimondii, and Gossypium turneri. In contrast, each tetraploid Gossypium species—namely G. hirsutum, Gossypium barbadense, Gossypium tomentosum, Gossypium mustelinum, and Gossypium darwinii—harbored ten TGA genes. The naming convention for the TGA family genes was based on their chromosomal locations; they were designated as AtTGA1–10 for A. thaliana (At), TcTGA1–8 for T. cacao (Tc), GheTGA1–5 for G. herbaceum (Ghe), GaTGA1–5 for G. arboreum (Ga), GthTGA1–5 for G. thurberi (Gth), GrTGA1–4 for G. raimondii (Gr), and so forth, with corresponding designations such as GhTGA1–10 and GbTGA1–10 representing other species within this classification system. Based on the results of chromosome mapping, it can be concluded that A. thaliana TGA gene family is distributed across chromosomes 01, 03, and 05, with the most significant concentration found on chromosome 05. In contrast, the T. cacao TGA gene family is primarily located on chromosomes 01, 02, 05, 08, and 09, also exhibiting the highest number of genes on chromosome 05. The TGA family genes in Gossypium are predominantly clustered on chromosomes 10, 11, 12, and 13 across various Gossypium species. G. thurberi possesses one gene each on chromosomes 08 and 09 but lacks a gene on chromosome 11; similarly, G. raimondii has a gene situated on chromosome 09 but none present on chromosome 13. Notably, except for G. tomentosum, which contains two TGA family members located on chromosomes A11 and D11, the remaining seven cotton varieties exhibit two genes positioned on chromosome 13 while having only one gene each located on chromosomes 10, 11, and 12 (Figure 1).
The physicochemical properties of the TGA gene family, which includes A. thaliana, T. cacao, and Gossypium, were analyzed using TBtools (v2.210) software (Table S1). Biochemical profiling demonstrated a molecular mass spectrum spanning 26,271.35 to 59,078.52 Da across TGA transcription factors. Concomitantly, gene products derived from TGA homologs exhibited polypeptide chain length polymorphisms ranging between 235 and 532 residues. The predicted theoretical isoelectric points (PI) ranged from 5.34 to 9.62, while the instability index exceeded 40 for all members except AtTGA10, which had an index of 37.3; this suggests that most TGA family proteins are unstable. Furthermore, the Grand Average of Hydropathicity (GRAVY) values were negative across all members of the TGA family proteins, indicating their hydrophilic nature.
3.2. Evolutionary Relationship Analysis of TGA Gene Family
To delineate evolutionary divergence patterns within the TGA transcription factor family, we conducted maximum likelihood phylogenetic reconstruction using protein orthologs from A. thaliana (n = 10), T. cacao (n = 8), and Gossypium species (n = 74), with branch topology detailed in Figure 2. Based on the phylogenetic analysis, the TGA gene family can be categorized into five subfamilies: Group I through Group V. Phylogenetic analysis of Gossypium and T. cacao TGA genes reveals a similar clustering pattern and high sequence homology with A. thaliana. The number of TGA proteins present in cotton remains remarkably stable: diploid cotton species possess five TGA proteins whereas tetraploid species contain approximately ten. This distribution corresponds well with established evolutionary patterns within cotton species. All genes demonstrate one-to-one homology between genomes or subgenomes—indicating that these genes may serve analogous functions across different varieties of Gossypium.
3.3. Chromosomal Collinearity Analysis of the TGA Gene Family in Gossypium
During evolution, chromosomal segment duplication across various genomes through fragment replication, tandem duplication, and whole-genome duplication (WGD) contributes to the expansion of gene families. While duplicated genes may initially exhibit functional redundancy, they frequently undergo subfunctionalization or neofunctionalization during divergence. To investigate the evolutionary relationships among gene families, we employed the TBtools (v2.210) with default parameters (blast E-value ≤ 1 × 10^−5^, window size = 10 genes) to perform a collinearity analysis between G. hirsutum and nine other Gossypium species. Syntenic analysis revealed significant lineage-specific divergence in orthologous TGA distributions: allotetraploid Gossypium species (e.g., G. hirsutum–G. barbadense) retained 24–30 inter-subgenomic (AD) ortholog pairs, compared to only 5–13 intra-genomic (A/D) pairs in diploids (e.g., G. herbaceum–G. arboreum), with >92% of syntenic TGA loci mapping to non-homologous chromosomes (Figure 3)—a genomic architecture signature strongly implicating segmental duplications, rather than whole-genome doubling, as the primary driver of TGA family expansion in Gossypium. The prevalence of interchromosomal synteny blocks, coupled with Ks divergence peaks corresponding to ancestral polyploidization events (~1.5 MYA for AD genomes; ~5 MYA for A/D diploid divergence), indicates that segmental duplications—potentially linked to transposon-mediated genome reshuffling—were pivotal for TGA diversification. Intriguingly, 68% of duplicated TGA genes showed conserved expression patterns (FPKM > 1), suggesting selective retention of functionally essential copies.
3.4. Analysis of the Gene Structure, Conserved Motifs, and Conserved Domains of the TGA Gene Family in Gossypium
Conserved gene sequences serve as fundamental markers in the study of molecular evolution. By examining the similarities and differences among these gene sequences and their corresponding structures, researchers can accurately infer phylogenetic relationships and evolutionary histories among species, identify homologous genes, and trace the expansion and functional differentiation of gene families [19]. In this study, we analyzed the gene structures, conserved motifs, and domains of the TGA gene families in 10 Gossypium species (Figure 4). The analysis revealed that most TGA genes consist of 8–12 exons; notably, 83.78% of these genes lack 5′/3′–untranslated regions (UTRs). Furthermore, genes within the same group exhibit similar exon–intron architectures. All ten TGA genes were found to contain non-coding introns. Amino acid sequence alignment analysis of conserved TGA gene domains in cotton indicated that all TGA proteins possess one bZIP_HBP1b-like domain along with one DOG1 domain. Additionally, some TGA proteins also include a bZIP superfamily domain and a CpxP superfamily domain. This suggests that they may have distinct functions compared to other family members. Application of the MEME algorithm (Multiple Expectation Maximization for Motif Elicitation) enabled systematic detection of 10 evolutionarily preserved sequence signatures. Phylogenetic analysis revealed that TGA homologs clustered within identical clades exhibited pronounced structural conservation patterns, suggesting biological role convergence. Notably, all 74 Gossypium TGA homologs maintained five core modular architectures (Motif 1–Motif 5) across taxonomic boundaries. Based on our constructed evolutionary tree for TGA family in Gossypium, it is evident that these proteins can be categorized into five subfamilies. Notably, Motif 10 is specific to subfamilies I and II in Gossypium; conversely, most members belonging to subfamily III harbor two instances of Motif 9—this distinction may significantly contribute to varying physiological roles exhibited by different subgroups within Gossypium TGAs.
3.5. Prediction of cis-Acting Elements in the Promoter Region of the TGA Gene Family of Cotton
To delineate transcriptional regulatory mechanisms governing Gossypium TGA factors, we performed computational screening of promoter architectures using the PlantCARE database, revealing four phylogenetically conserved cis-regulatory element categories associated with hormonal response and abiotic stress adaptation as shown in Figure 5. Previous studies demonstrate that TGA transcription factors regulate diverse biological processes in plants, including developmental programming, hormonal signaling (jasmonic acid, salicylic acid), and stress adaptation (biotic challenges, abiotic stresses) [20]. Our cis-element annotation categorized conserved motifs into four functional clusters: growth regulation (17 elements, e.g., auxin-responsive elements), light sensing (7 elements, e.g., Box4), stress adaptation (12 elements, e.g., AREs), and hormonal signaling (9 elements, e.g., GARE-motifs) (Figure 5). Notable differences exist regarding both the types and quantities of elements contained within the gene promoters of the Gossypium TGA family members. However, it was observed that members belonging to the same evolutionary branch generally share similar cis-acting elements. All members’ promoters—except for GaTGA5—contain AREs (Antioxidant Response Elements), which are implicated in plant antioxidation processes. Furthermore, nearly all members of the cotton TGA family possess photoresponse-related elements (such as Box4) within their promoters, suggesting that expression of these genes is induced by light exposure. Additionally, most members contain gibberellin response elements (including P-boxes and GARE motifs), indicating their involvement in gibberellin signaling pathways. Moreover, many members’ promoters include JA and SA response elements along with abscisic acid and auxin response elements. This suggests that TGA genes broadly function to regulate cotton growth and development while also playing roles in resisting biotic and abiotic stresses as well as participating in signal transduction processes within Gossypium.
3.6. Expression Analysis of TGA Gene Family in G. hirsutum
To comprehensively decipher the spatiotemporal expression dynamics and functional characteristics of TGA transcription factors in G. hirsutum, we established a multidimensional expression atlas through systematic integration of publicly available RNA-seq datasets spanning multiple organ-specific contexts. Expression patterns of GhTGA homologous genes were analyzed in key tissues, including vegetative (roots, stems, leaves) and reproductive organs (stamens, pistils), ovules at 0, 5, 10, 20, and 25 days post-anthesis, and fiber development from 5 to 25 DPA at 5-day intervals (Figure 6A). Based on the expression profiles observed: GhTGA3 and GhTGA8 showed low expression levels (mean FPKM < 1) across all tissues; GhTGA5 and GhTGA10 demonstrated higher expression levels specifically in the stem; both GhTGA1 and GhTGA6 were predominantly expressed in stamens while also showing high expression in other tissues. Notably, GhTGA2 was found to be expressed across all tissues—characterizing it as a broad-spectrum gene—particularly prominent during the development stages of cotton fibers at both 20 DPA and 25 DPA. Furthermore, GhTGA7, GhTGA4, and GhTGA9 were primarily expressed in stems but also detected in cotton fibers albeit at lower levels.
According to the transcriptome data obtained under various stress conditions, including cold stress, heat stress, drought stress, and salt stress (Figure 6B), it was observed that GhTGA2, GhTGA7, GhTGA4, and GhTGA9 were generally expressed at high levels across all types of stress. Furthermore, the expression levels of these genes exhibited a gradual increase with prolonged exposure to each type of stress. The expression profile indicates that the TGA gene family in G. hirsutum plays a significant role in conferring resistance to salt stress, with the GhTGA2 gene demonstrating the highest expression level specifically under salt-stress conditions. Consequently, we selected GhTGA2 as the candidate gene for RT-qPCR expression verification at time points of 1 h, 3 h, 6 h, and 12 h during salt stress; notably, our results aligned well with those derived from transcriptome analysis (Figure 6C).
3.7. Subcellular Localization of GhTGA2
To investigate the expression pattern of the GhTGA2 in cells, we performed transient expression assays using GhTGA2-GFP fusion constructs in Nicotiana benthamiana epidermal cells. As illustrated in Figure 7, the empty vector exhibits green fluorescence both at the cell membrane and within the nucleus of N. benthamiana leaves. In contrast, the GhTGA2 is primarily localized to the nucleus, aligning with predictions regarding its function and subcellular localization as a transcription factor. This finding suggests that the GhTGA2 may play a significant role within the nuclear environment.
3.8. GhTGA2-Silenced Cotton Plants Showed High Sensitivity to Salt Stress
To further investigate the biological function of the GhTGA2 under salt stress in G. hirsutum, we constructed a VIGS vector for GhTGA2 and silenced this gene to induce specific phenotypes in plants, thereby elucidating the role of GhTGA2. The TRV2:GhTGA2 construct was introduced into Agrobacterium tumefaciens strain LBA4404 and subsequently used to infect G. hirsutum. Both TRV2:GhTGA2 and TRV2:GhPDS vectors were transformed into cotton, and the development of cotton leaves was monitored for two weeks post-infection. The results indicated that cotton plants infected with TRV2:GhPDS exhibited albinism in the veins and margins of their leaves by day 7 post-infection; this albinism progressed to encompass the entire leaf by day 14, achieving a silencing efficiency exceeding 85% (Figure 8A). The expression levels of TRV2:00 and TRV2:GhTGA2 were assessed using qRT-PCR, revealing a significant suppression of GhTGA2 gene expression. This finding confirms the successful establishment of a VIGS system targeting cotton. The gene-silenced plants were then cultured for subsequent functional verification experiments.
Subsequently, we subjected cotton seedlings with GhTGA2 gene silencing and control seedlings to a salt stress treatment using a 200 mM NaCl solution. An equal volume of water was used for irrigation in the control group, and phenotypic observations were made after 15 days of treatment. Results: As illustrated in Figure 8B, following 15 days of growth under normal conditions, both the control plants and those with GhTGA2 gene silencing exhibited reduced leaf area under salt stress conditions. The leaves displayed significant chlorosis and yellowing, accompanied by brown spots or patches. Additionally, the plants showed signs of wilting and drooping. Notably, the adverse effects of salt stress were more pronounced in the GhTGA2 gene-silenced plants compared to the negative control group. Silencing the GhTGA2 gene in G. hirsutum increased its sensitivity to salt stress.
4. Discussion
As a distinct phylogenetic clade within the basic leucine zipper (bZIP) transcription factor superfamily, TGA proteins orchestrate indispensable regulatory cascades governing plant developmental and stress adaptation pathways. Studies have demonstrated that members of the TGA gene family are typically categorized based on their gene sequences, with different groups fulfilling distinct functions in plants while exhibiting relative conservation. Numerous TGA transcription factors across plant species, particularly AtTGA clades I–III, mediate abiotic stress tolerance through coordinated modulation of osmolyte biosynthesis, redox homeostasis mechanisms, and phytohormone signaling networks in response to diverse environmental challenges including water deficit, ionic toxicity, and thermal extremes [45,46]. Their multi-level regulatory mechanisms ensure that plants maintain growth balance under varying environmental conditions and support survival and reproduction. AtPAN is involved in the early development of A. thaliana flowers by controlling stem cell formation and floral meristem termination. In contrast, AtTGA9 and AtTGA10 from group IV regulate later stages of flower development [28,46]. Additionally, some studies indicate that AtTGA7 plays a significant role in controlling flowering time; loss-of-function mutations in AtTGA7 result in delayed flowering in A. thaliana [47]. Although there has been some exploration into the TGA gene family across various plant species, research within the cotton genus remains insufficiently developed—particularly concerning salt stress responses. In this study, we utilized AtTGAs from A. thaliana as query sequences alongside conserved gene sequence analysis and CDD conserved domain analysis to identify a total of 74 members of the TGA gene family across ten cotton varieties. Furthermore, eight TGA genes were identified within T. cacao—a closely related species. The physicochemical properties of these proteins were subsequently analyzed (Table S1). Their instability and hydrophilicity align with the functional role of TGA as a transcription factor. The members of the TGA gene family were designated based on their chromosomal locations, leading to the renaming of 10 A. thaliana genes to facilitate subsequent research (Figure 1).
An evolutionary tree was constructed using the TGA protein sequences from A. thaliana, T. cacao, and Gossypium, resulting in five distinct branches. The TGA gene family of A. thaliana was distributed across four branches: Groups I, III, IV, and V. This family can be further categorized into five specific groups: group 1 includes AtTGA1 and AtTGA6; group 2 comprises AtTGA5, AtTGA7, and AtTGA8; group 3 consists of AtTGA2 and AtTGA4; group 4 encompasses AtTGA9 and AtTGA10; while AtTGA3 is classified under group 5. These findings are consistent with previous studies on the TGA family in A. thaliana [8]. Evolutionary analysis showed that the five TGA gene branches in Gossypium contained 25, 20, 16, 10, and 3 members, respectively. Notably, GhTGA1/6, GhTGA2/7, and GhTGA4/9 in G. hirsutum were closely related to AtTGA5/7/8 (Group II) from A. thaliana, suggesting a role in plant stress responses (Figure 2). Through collinearity analysis it was determined that G. hirsutum exhibited collinearity relationships with nine other Gossypium species. This finding indicates a conservation of genetic information as well as a co-evolutionary process among different Gossypium species—providing an essential foundation for studying gene functions (Figure 3). Members of the TGA family residing within the same evolutionary branch in cotton displayed highly conserved gene sequences and protein domains. This suggests that members from different branches may participate in distinct regulatory pathways to fulfill their respective functions (Figure 4). Phylogenetic comparisons of TGA transcription factor orthologs in angiosperms (A. thaliana and N. tabacum) revealed that the basic leucine zipper (bZIP) domain is highly conserved, with identical tertiary structures maintained across lineages separated by 150 million years. The bZIP domain is critical for determining DNA binding specificity while also serving as a nuclear localization signal [24,46]. Subcellular localization experiments conducted in N. benthamiana cells indicated that the GhTCA2 gene predominantly resides within the nucleus (Figure 7). The functional significance of the bZIP structural module manifests through its mediation of abscisic acid-dependent signal transduction cascades during plant adaptation to hydric deficits and ionic imbalances, with members such as ABA-responsive element binding factors (ABFs) serving as canonical regulators of osmotic stress acclimatization [48]. All TGA proteins identified in cotton possess the DOG1 domain. Previous research has demonstrated that, in rice, the DOG1 domain of OsDOG1L2 can interact with the salt stress-related transcription factor OsDREB2A, thereby enhancing its activation of downstream salt-tolerant genes such as OsLEA3 and improving the plant’s overall salt tolerance [19].
Systematic exploration of cis-regulatory architectures in the Gossypium TGA transcription factor family revealed predominant functional associations with phytohormone signaling networks, environmental stress adaptation, photomorphogenic regulation, and developmental programming modules. The transcriptional activation mechanism mediated by the basic leucine zipper (bZIP) structural motif in TGA factors involves sequence-specific binding to the activating sequence-1 (as-1) cis-regulatory element of pathogenesis-related gene 1a (PR-1a), orchestrating SA-dependent defense signaling transduction in plant immune systems [49,50]. Mechanistic studies further demonstrate that TGA transcriptional regulators engage in dynamic protein partnerships with the NPR1 signaling hub, which coordinates SA-mediated defense signal integration and modulates the transcriptional crosstalk between SA and JA hormonal pathway [51]. Furthermore, TGA transcription factors can also engage with ROXY19/GRX480 to negatively regulate the expression of defense genes induced by JA and ethylene (ET) [52]. Functional characterization of the AaTGA6 transcriptional regulator in A. annua demonstrates its dual modulation of SA-mediated sesquiterpene biosynthesis, with molecular interaction studies revealing NPR1 co-activator-mediated enhancement and TGA3-mediated suppression of its promoter binding competence at the AaERF1 regulatory locus [53]. Therefore, it can be speculated that members of the Gossypium TGA gene family may modulate stress responses in cotton through their involvement in hormone signaling pathways. Subsequently, we examined the expression profiles of this gene family in upland cotton and discovered that GhTGAs exhibited peak expression levels under salt stress (Figure 6). Molecular analysis via reverse transcription-quantitative PCR (RT-qPCR) demonstrated a significant increase in GhTGA2 mRNA accumulation under salt stress conditions. Furthermore, its expression level was markedly higher compared to other members of the GhTGAs gene family, thereby establishing GhTGA2 as a central regulator of salt adaptation in the Gossypium. Parallel functional genomic investigations showed that Agrobacterium-mediated ectopic expression of GmTGA26 in Glycine max root cultures triggered pronounced activation of abiotic stress-associated transcripts under ionic stress challenges [31]. We selected GhTGA2—characterized by broad expression patterns and high inducibility—as a candidate gene and confirmed its resistance function against salt stress using VIGS gene silencing technology (Figure 8). Under salt stress, the plants with silenced GhTGA2 genes exhibited significant growth retardation, leaf yellowing and curling, as well as the presence of brownish scars when compared to the control group.
This study presents a comprehensive and systematic analysis of the Gossypium TGA gene family, exploring its gene structure, protein characteristics, and the features of cis-acting elements within the promoter region. Comparative transcriptomic analyses among G. hirsutum varieties identified GhTGA2 as a key regulatory hub within the TGA gene family co-expression modules, displaying significant evolutionary conservation and salt-induced transcriptional prominence under conditions of ionic stress. The function of GhTGA2 was subsequently validated using VIGS technology. However, the molecular mechanisms by which GhTGA2 modulates salt stress responses in cotton warrant further investigation.
5. Conclusions
In this study, a total of 74 homologous TGA sequences were identified in the cotton genome through comprehensive genome-wide analysis, which can be categorized into five distinct groups. Among these, 30 pairs of genes from the TGA family members of G. hirsutum and G. barbadense exhibited collinearity during evolution, indicating a closer evolutionary relationship. Expression profiling and functional validation using VIGS technology confirmed that GhTGA2 plays a crucial role in salt stress tolerance, showing significant transcriptional regulation under salinity conditions. These results yield innovative perspectives regarding the transcriptional regulation of salinity adaptation mechanisms in cotton while simultaneously positioning GhTGA2 as a prime candidate for marker-assisted selection in genomic-assisted crop enhancement strategies.
The reference list from the paper itself. Each links out to its DOI / PubMed record.
- 1Ahmad I. Zhu G. Zhou G. Song X. Hussein Ibrahim M.E. Ibrahim Salih E.G. Hussain S. Younas M.U. Pivotal Role of Phytohormones and Their Responsive Genes in Plant Growth and Their Signaling and Transduction Pathway under Salt Stress in Cotton Int. J. Mol. Sci.202223733910.3390/ijms 2313733935806344 PMC 9266544 · doi ↗ · pubmed ↗
- 2Dong Y. Hu G. Grover C.E. Miller E.R. Zhu S. Wendel J.F. Parental legacy versus regulatory innovation in salt stress responsiveness of allopolyploid cotton (Gossypium) species Plant J.202211187288710.1111/tpj.1586335686631 PMC 9540634 · doi ↗ · pubmed ↗
- 3Wang Y. Yu Y. Wan H. Tang J. Ni Z. The sea-island cotton Gb TCP 4 transcription factor positively regulates drought and salt stress responses Plant Sci.202232211132910.1016/j.plantsci.2022.11132935667469 · doi ↗ · pubmed ↗
- 4Xu P. Guo Q. Meng S. Zhang X. Xu Z. Guo W. Shen X. Genome-wide association analysis reveals genetic variations and candidate genes associated with salt tolerance related traits in Gossypium hirsutum BMC Genom.2021222610.1186/s 12864-020-07321-3PMC 778957833407102 · doi ↗ · pubmed ↗
- 5Yu Z. Duan X. Luo L. Dai S. Ding Z. Xia G. How Plant Hormones Mediate Salt Stress Responses Trends Plant Sci.2020251117113010.1016/j.tplants.2020.06.00832675014 · doi ↗ · pubmed ↗
- 6Zhao S. Zhang Q. Liu M. Zhou H. Ma C. Wang P. Regulation of Plant Responses to Salt Stress Int. J. Mol. Sci.202122460910.3390/ijms 2209460933924753 PMC 8125386 · doi ↗ · pubmed ↗
- 7Jakoby M. Weisshaar B. Dröge-Laser W. Vicente-Carbajosa J. Tiedemann J. Kroj T. Parcy F. b ZIP transcription factors in Arabidopsis Trends Plant Sci.2002710611110.1016/S 1360-1385(01)02223-311906833 · doi ↗ · pubmed ↗
- 8Alves M.S. Dadalto S.P. Gonçalves A.B. De Souza G.B. Barros V.A. Fietto L.G. Plant b ZIP transcription factors responsive to pathogens: A review Int. J. Mol. Sci.2013147815782810.3390/ijms 1404781523574941 PMC 3645718 · doi ↗ · pubmed ↗