Comparative Prognostic Roles of β-Catenin Expression and Tumor–Stroma Ratio in Pancreatic Cancer: Neoadjuvant Chemotherapy vs. Upfront Surgery
Shu Oikawa, Hiroyuki Mitomi, So Murai, Akihiro Nakayama, Seiya Chiba, Shigetoshi Nishihara, Yu Ishii, Toshiko Yamochi, Hitoshi Yoshida

TL;DR
This study finds that measuring β-catenin levels and tumor–stroma ratio in pancreatic cancer can predict cancer recurrence and treatment response, helping guide personalized treatment decisions.
Contribution
The study identifies β-catenin/m-CK index and tumor–stroma ratio as novel prognostic biomarkers in pancreatic cancer.
Findings
Low β-catenin levels predict shorter relapse-free survival in both chemotherapy and surgery subgroups.
High tumor–stroma ratio is associated with shorter cancer-specific survival in pancreatic cancer patients.
Neoadjuvant chemotherapy reduces tumor budding, suggesting a modulation of invasive growth.
Abstract
Pancreatic cancer is one of the most aggressive cancers, and doctors need better ways to estimate which patients may relapse after surgery. In this study, we analyzed tissue samples from 84 patients, some who received chemotherapy before surgery and some who went straight to surgery. Using computer-based imaging, we looked at several microscopic features. First, we measured β-catenin, a protein that helps cells stick together, and found that patients with low levels were more likely to experience cancer recurrence. We also examined the tumor–stroma ratio (TSR), the balance between cancer cells and surrounding supportive tissue, which showed important links with treatment response and survival. Finally, we evaluated tumor budding, small groups of cells that indicate invasive growth, and found that chemotherapy before surgery reduced this feature. These results suggest that simple…
Genes, proteins, chemicals, diseases, species, mutations and cell lines named across the full text — each resolved to its canonical identifier and authoritative record.
Click any figure to enlarge with its caption.
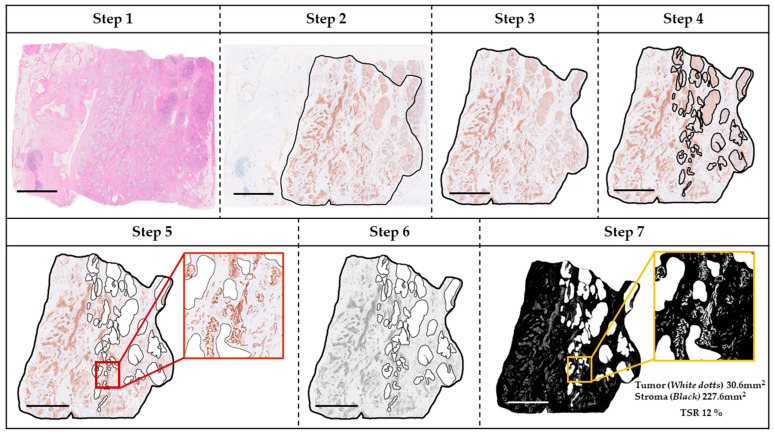 Figure 1
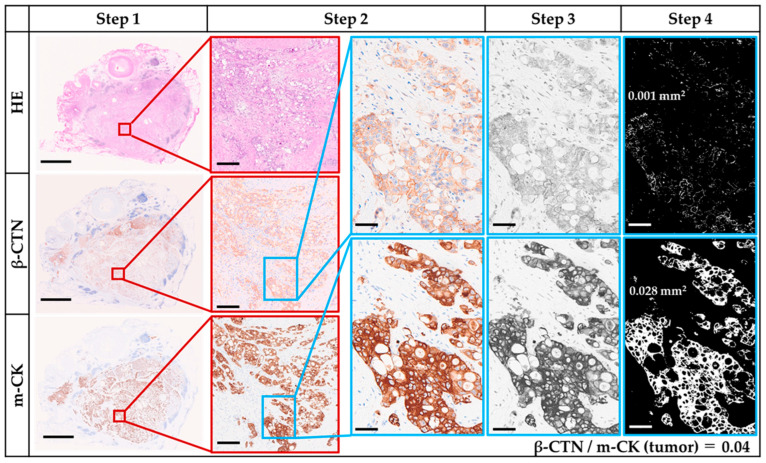 Figure 2
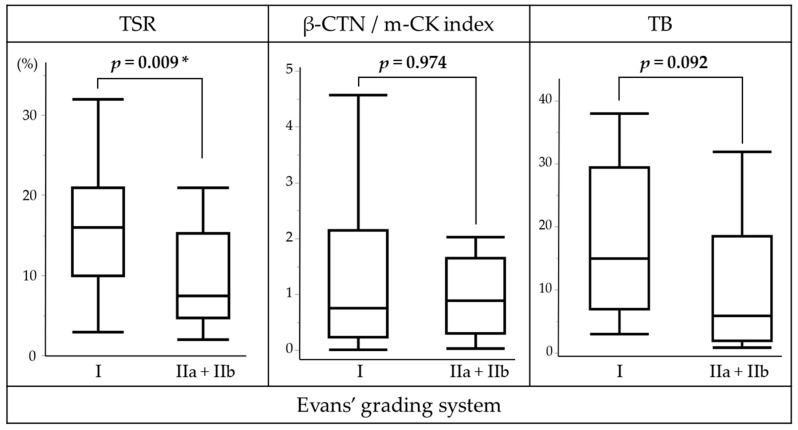 Figure 3
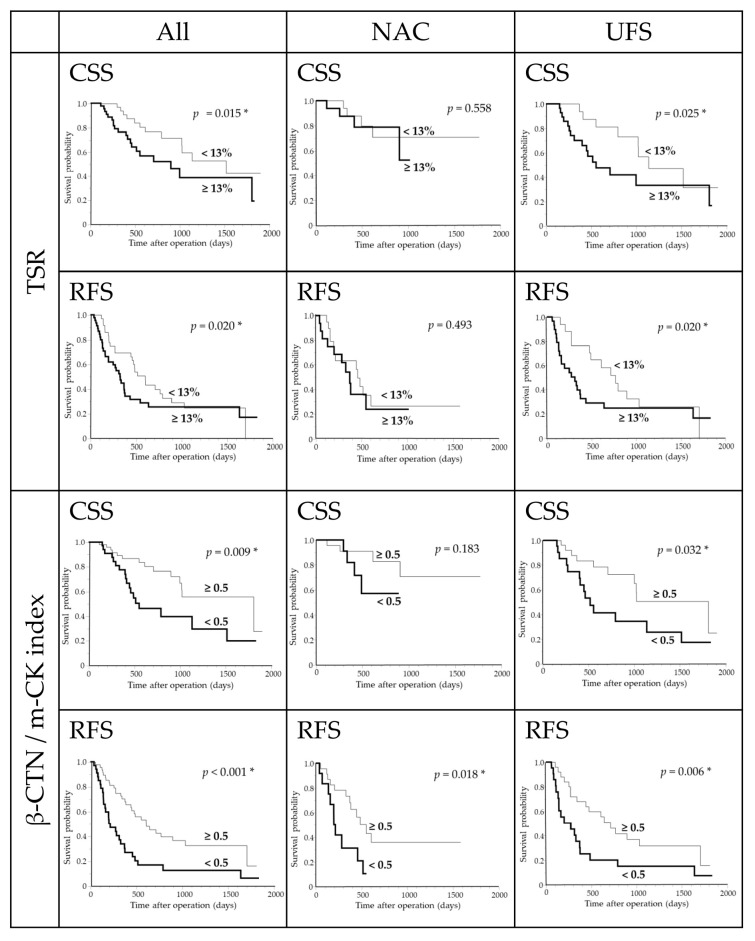 Figure 4
Peer Reviews
No public reviews on file for this paper yet. If you reviewed it on a platform where reviews are public (OpenReview, ICLR, NeurIPS, ICML), you can paste yours below so the community can read it here.
Videos
No videos yet. Explain this paper in a talk, walkthrough, or lecture? Add one.
Taxonomy
TopicsPancreatic and Hepatic Oncology Research · Cancer Genomics and Diagnostics · Cancer Diagnosis and Treatment
1. Introduction
The incidence of pancreatic cancer (PC) has increased over the past few decades, accounting for 2–3% of all cancers [1,2], and is highest in North America and Europe, followed by East Asia [3]. PC causes about 5% of cancer deaths worldwide [2,3], with an extremely poor 5-year survival rate of 2–13% [1,2]. For localized disease, surgical resection remains the main curative option [1,2,3]. The 5-year survival after surgery has improved to ~15–25% [3], up from 1.5% to 17.4% between 1975 and 2011 [2].
Neoadjuvant chemotherapy (NAC) may enhance outcomes by eradicating occult metastases and increasing resection rates [1,2], though its survival benefit remains debated [4]. A meta-analysis of 11 studies reported similar survival between resectable PC with or without NAC [5], while a retrospective study of 1175 NAC and 4041 upfront surgery (UFS) cases showed improved survival with multiagent NAC [6]. Phase III trials in Japan established S-1, an oral prodrug of 5-fluorouracil, as an effective and convenient alternative to infusion therapy [7]. In PC, S-1 demonstrated comparable or superior efficacy to gemcitabine (GEM) in advanced and adjuvant settings [4]. The Japanese multicenter PREP-02/JSAP-05 trial showed that NAC with S-1 plus GEM significantly improved survival in resectable PC [8], and this regimen is now recommended by the Japan Pancreas Society [9]. Although S-1 has shown promising efficacy in Caucasian populations [10], its use in Western countries is limited by lower tolerated doses due to gastrointestinal toxicity [4,7]. While NAC is integral to domestic treatment, interest is increasing in histopathological assessment of residual tumor aggressiveness as prognostic markers.
Pancreatic ductal adenocarcinoma (PDAC) is the predominant subtype [1,3], characterized by marked heterogeneity and a dense stroma comprising up to ~80–90% of tumor volume, which influences tumor progression and drug delivery [11,12]. PDAC generally exhibits a lower tumor–stroma ratio (TSR) than other cancers [13]. The prognostic value of TSR has been demonstrated across malignancies [13] and validated in PDAC [14,15,16,17,18,19,20,21,22]. Computer-aided image analysis has enabled more objective TSR quantification [15,17,18,19,20,21,22,23,24,25]. Evidence suggests that the stromal compartment mediates chemoresistance in PC [26,27,28,29]. Experimental models show that stromal depletion enhances drug delivery [28,29], and S-1–based regimens reduce stroma and induce apoptosis [29,30]. However, the prognostic relevance of TSR in PDAC treated with NAC remains poorly defined [18,20].
β-catenin (β-CTN) anchors cadherin complexes and mediates Wnt signaling [31]. Loss of β-CTN disrupts adhesion and promotes invasion, with lower expression in poorly differentiated tumors [32]. Cytoplasmic localization of β-CTN correlates with advanced disease and poor prognosis [33,34,35,36], while overexpression may promote chemoresistance [37]. Despite its importance, only limited histological parameters, such as encapsulating fibrosis [20], β-CTN/PROX1 co-expression [34], podocalyxin [38], and GATA6 [39], have been systematically investigated.
Tumor budding (TB), defined as single cells or small clusters of ≤4 cells at the invasive front, reflects epithelial–mesenchymal transition [40,41,42] and is associated with stromal and immune components [43]. Although TB is an independent prognostic factor in PDAC [42,44,45,46,47,48], its significance after NAC remains underexplored [44,45].
Against this background, we investigated TSR, β-CTN expression, and TB in resectable PDAC, analyzed their clinicopathological associations, and evaluated their prognostic relevance, particularly in NAC versus UFS cohorts.
2. Materials and Methods
2.1. Patients and Materials
This retrospective study included 84 consecutive Japanese patients with PDAC who underwent curative-intent resection at Showa Medical University Hospital between January 2018 and December 2023. Patients with other histologies (e.g., acinar cell carcinoma, neuroendocrine neoplasms) were excluded. Patients with borderline-resectable PDAC and those undergoing conversion surgery, as previously defined [49,50], were also excluded. Of the 84 resectable cases, 35 received NAC consisting of two courses of S-1 (body-surface area < 1.25 m^2^, 80 mg/day; 1.25–1.4 m^2^, 100 mg/day; ≥1.5 m^2^, 120 mg/day) for 14 consecutive days followed by a 1-week rest, plus GEM (1000 mg/m^2^ on days 1 and 8 followed by a 2-week rest), and then underwent pancreatectomy (NAC group). The remaining 49 underwent UFS with no preoperative therapy (UFS group). A flow diagram illustrating patient selection is provided in Supplementary Figure S1. Adjuvant S-1 (four 28-day courses with a 2-week rest) was administered to 48/84 patients. The mean follow-up among survivors at last visit (n = 48) was 732 days (range, 59–1899). Clinicopathological data are summarized in Supplementary Table S1. Written informed consent was obtained from all patients. The study was approved by the Showa Medical University Ethics Committee (No. 2024-233-B) and conducted in accordance with the Declaration of Helsinki.
2.2. Histological Analysis
Resected specimens were fixed in 10% neutral-buffered formalin, sliced at 5 mm intervals, and embedded in paraffin. Tissue sections, 4 µm in thickness, were stained with hematoxylin and eosin (H&E). Two pathologists (H.M., S.M.), blinded to clinical data, reviewed all H&E slides. Pathological T and N categories and overall stage were assigned according to the UICC TNM classification (9th edition). The histological effect of NAC was graded by the Evans system [51], as follows: Grade I, little or no tumor cell destruction (<10%); Grade IIa, 10–50%; Grade IIb, 51–90%; Grade III, >90% with only single cells or small clusters remaining; Grade IV, no viable tumor cells. For IHC, one representative block from the largest tumor slice including adjacent pancreatic tissue was selected.
2.3. Immunohistochemstry (IHC)
From each representative block, serial sections (4 μm) were cut and placed on three slides; two for IHC and one for H&E. After heat-induced epitope retrieval (BOND Epitope Retrieval Solution 1, Leica Biosystems), slides were immunostained on an automated stainer (BOND-III, Leica Biosystems, Newcastle upon Tyne, UK) with mouse monoclonal multi-cytokeratin (m-CK) (clone AE1/AE3, 1:200; Leica Biosystems, Newcastle upon Tyne, UK) and monoclonal β-CTN (clone 17C2, prediluted; Leica). Detection used a horseradish peroxidase-labeled polymer (BOND compact polymer system). Immunoreactivity was visualized with 3, 3′-diaminobenzidine and counterstained with hematoxylin.
2.4. TSR
Whole slide images (WSIs) of H&E and m-CK IHC were acquired at ×40 using the NanoZoomer S60 (Hamamatsu Photonics, Hamamatsu, Japan) and saved as non-layered JPEGs. Using ImageJ 1.54g (National Institutes of Health, Bethesda, MD, USA), tumor areas were annotated on m-CK WSIs with reference to serial H&E WSIs and reviewed in NDP.view2 (v2.9.29). Briefly, the tumor area on the m-CK WSI (corresponding to H&E) was outlined; non-tumorous surrounding tissue and intra-tumoral non-neoplastic parenchyma were removed; images were converted to 8-bit grayscale and then to binary. Annotation was performed by one observer (S.O.) and reviewed by a pathologist (H.M.). The lower threshold was set to zero and the upper threshold fixed at 140 across cases to suppress background while preserving true immunoreactivity. In the final binary image, m-CK-positive tumor area (white) and m-CK-negative stromal area (black) were quantified, and TSR (%) was calculated as:
The workflow is illustrated in Figure 1; ImageJ settings are detailed in the Supplementary Methods.
2.5. Assessment of β-CTN IHC
Nuclear/cytoplasmic and membranous β-CTN stainings were assessed separately. Distinct nuclear and/or cytoplasmic staining was considered positive regardless of intensity and dichotomized as negative (<1% positive cells) or positive (≥1%). Slides were assessed concurrently by two authors (S.O., H.M.) using a multi-head microscope, blinded to outcomes; disagreements (<10% of cases) were resolved by joint review.
2.6. β-CTN/m-CK Index
WSIs of serial H&E, β-CTN, and m-CK stained slides were scanned, and five representative images of tumor and adjacent intralobular ducts were captured per case at ×5–10 magnification and saved as non-layered JPEGs. Using ImageJ, β-CTN and m-CK images were converted to 8-bit grayscale, and thresholds for binary conversion (black and white) were determined by two observers, including a pathologist (S.O. and H.M.). The maximum threshold was fixed at 140 across all analyses. In the resulting binary images, white areas corresponded to β-CTN-positive or m-CK-positive regions. The β-CTN/m-CK index was calculated as the ratio of β-CTN/m-CK in the tumor normalized to the corresponding ratio in intralobular ducts:
Stepwise analysis for a representative case with β-CTN/m-CK index < 0.5 is illustrated in Figure 2. Step 1: Tumor regions were scanned on β-CTN and m-CK WSIs corresponding to serial H&E sections. Step 2: Five representative tumor images were captured at ×10 magnification. Step 3: Grayscale (8-bit) images were generated. Step 4: Binary images were created, in which white areas represent β-CTN- or m-CK-positive tumor regions. Step 5: The β-CTN/m-CK ratio was calculated for each tumor image. The same procedure was applied to non-neoplastic intralobular ducts (Supplementary Figure S2). Representative analysis of a case with β-CTN/m-CK index ≥ 0.5 is shown in Supplementary Figure S3.
2.7. TB
TB was assessed on m-CK IHC slides to improve detectability. Following the consensus definition [41], TB was defined as single tumor cells or clusters of up to four cells without connection to the main tumor mass. Two authors (S.O., H.M.) screened the entire slide at low magnification to identify the hot spot (densest TB area), irrespective of location. TBs within the hot spot were counted at ×20 objective (field area 0.785 mm^2^). TB was dichotomized as low (<10 buds) or high (≥10 buds). TB was dichotomized as low (<10 buds) or high (≥10 buds), with the cutoff determined using the Contal–O’Quigley/maxstat method described below. Representative examples are provided in Supplementary Figure S4.
2.8. Statistical Analysis
Categorical variables were compared with the χ^2^ test or Fisher’s exact test; continuous variables with the Mann–Whitney U test. Spearman’s rho was used to assess non-parametric correlations. Cancer-specific survival (CSS) was measured from surgery to death from PDAC or last follow-up; deaths from other causes were censored. Relapse-free survival (RFS) was measured from surgery to the first event of locoregional recurrence, distant metastasis, or death from any cause. Kaplan–Meier curves were generated and compared using the log-rank test (and, where indicated, Wilcoxon). Multivariate analyses used Cox proportional hazards models with stepwise selection; candidate variables entered if univariate p < 0.10. For threshold determination, the maximally selected log-rank method (Contal–O’Quigley/maxstat) was applied to identify the cutoff yielding the smallest log-rank p-value around the median while maintaining balanced group sizes. Hazard ratios (HRs) with 95% confidence intervals (CIs) were reported. Two-sided p < 0.05 was considered statistically significant. Analyses were performed using JMP pro version 16 (SAS Institute, Cary, NC, USA).
3. Results
3.1. Clinicopathological Differences Between NAC and UFS
Patients in the UFS group were significantly older than those in the NAC group (p = 0.040). The distribution of pT category approached significance (p = 0.060); the NAC cohort included more pT1 and fewer pT2, with a modest excess of pT3 (NAC: pT1 13/35, 37.1%; pT2 13/35, 37.1%; pT3 9/35, 25.7% vs. UFS: pT1 10/49, 20.4%; pT2 31/49, 63.3%; pT3 8/49, 16.3%). Margin status likewise showed a borderline difference (p = 0.067), with margin-negative resections being more frequent after NAC (33/35, 94.3%) than UFS (39/49, 79.6%) and margin-positive resections correspondingly less frequent (NAC 2/35, 5.7% vs. UFS 10/49, 20.4%). In contrast, TSR and the β-CTN/m-CK index did not differ between groups (Table 1). Kaplan–Meier analysis revealed no significant difference in CSS or RFS between NAC and UFS.
3.2. β-CTN and m-CK IHC
In non-neoplastic pancreas, β-CTN was distinctly membranous in intralobular ducts but weak in acinar cells. In PDAC, tumors largely retained membranous expression, yet loss of membranous staining became evident with poor differentiation. Nuclear and cytoplasmic staining was uniformly absent (<1% of tumor cells). In contrast, m-CK showed uniformly strong staining across tumor and non-neoplastic components, largely preserved irrespective of differentiation.
3.3. Baseline Values of TSR, β-CTN/m-CK Index, and TB
The median TSR was 14% (range, 2–53) in the entire cohort, with similar values in the NAC (12%, range 2–51) and UFS groups (14%, range 2–53). The β-CTN/m-CK index showed a median of 0.5 (range, 0–12.3) overall, tending to be higher in the NAC group (0.8, range 0–12.3) compared with the UFS group (0.5, range 0–5.2). The median TB count per hotspot (×20, 0.785 mm^2^) was 15.5 (range, 1–250) overall, 10 (range, 1–250) in the NAC group, and 17 (range, 4–90) in the UFS group. Low TB was observed in 27% of cases (46% in NAC vs. 14% in UFS), while high TB (73% of cases) predominated (54% in NAC vs. 86% in UFS).
3.4. Association of TSR with Clinicopathological Features
Patients were dichotomized by TSR at 13% (pre-specified and approximating the cohort median) into <13% and ≥13% groups. The cutoff was determined using the Contal–O’Quigley/maxstat method. Resection margin status showed a marginal trend with TSR in the overall cohort (p = 0.058): margin-negative resections were 35/37 (94.6%) in the TSR < 13% group versus 37/47 (78.7%) in the TSR ≥13% group. A similar pattern was observed in the UFS subgroup (p = 0.070), with margin-negative resections 17/18 (94.4%) for TSR < 13% compared with 22/31 (71.0%) for TSR ≥13% (Supplementary Table S2).
3.5. Association of β-CTN/m-CK Index with Clinicopathological Features
Patients were categorized into two groups according to the β-CTN/m-CK index (<0.5 vs. ≥0.5). This cutoff was likewise defined using the Contal–O’Quigley/maxstat method. Overall, the index showed no significant associations with clinicopathological variables. Within the NAC subgroup, however, high index (≥0.5) was more frequent in younger (<75 years) than in older patients (younger 17/22, 77.3% vs. older 6/13, 46.2%; p = 0.079) (Supplementary Table S3). Although this dichotomization was not associated with tumor differentiation, stratified analysis showed significantly lower index values in poorly compared with well-differentiated tumors (median 0.3 vs. 0.9; p = 0.046).
3.6. Association of TB with Clinicopathological Features
In the overall cohort, peripancreatic fat invasion was more frequent with high vs. low TB (53/61, 86.9% vs. 14/23, 60.9%; p = 0.014); perineural invasion and moderate/poor differentiation showed similar trends (50/61, 82.0% vs. 14/23, 60.9%; p = 0.082; 38/61, 62.3% vs. 9/23, 39.1%; p = 0.084). In the NAC subgroup, no association reached significance, though moderately/poorly differentiated tumors tended to show higher TB (14/19, 73.7% vs. 7/16, 43.8%; p = 0.094). In the UFS subgroup, age ≥ 75 years and peripancreatic fat invasion were enriched in the high-TB group (25/42, 59.5% vs. 0/7, 0.0%; p = 0.004; 38/42, 90.5% vs. 3/7, 42.9%; p = 0.009). No other variables showed significant or marginal associations (Supplementary Table S4).
3.7. Interrelationships Among β-CTN/m-CK Index, TSR, and TB in PDAC
By Spearman’s rank correlation, the β-CTN/m-CK index showed a weak inverse association with TB in the overall cohort (rho = –0.320, p = 0.003), which was consistently recapitulated in the UFS subgroup (rho = –0.304, p = 0.034). In contrast, TSR displayed a weak positive correlation with TB, evident in the overall cohort (rho = 0.279, p = 0.010) and in the NAC subgroup (rho = 0.341, p = 0.045) (Supplementary Figure S5).
3.8. NAC Response in Relation to TSR, β-CTN/m-CK Index, and TB
In the NAC cohort, low TSR was significantly associated with a more favorable histological response. Tumors attaining Evans IIa/IIb grades (n = 18) exhibited a lower median TSR of 7% (interquartile range [IQR], 5–15), compared with 16% (IQR, 3–19) in Evans grade I (n = 17; p = 0.009). TB showed a marginal trend toward reduction in Evans IIa/IIb tumors (median 6; IQR, 2.5–16.5) relative to Evans I (median 15; IQR, 3–29; p = 0.092). By contrast, the β-CTN/m-CK index did not vary by Evans grade (Evans I: median 0.8, IQR 0.01–2.1; Evans IIa/IIb: median 0.9, IQR 0.3–1.6; p = 0.974) (Figure 3).
3.9. Survival Analysis in the Overall Cohort
The set of candidate prognostic variables encompassed patient factors (age, sex), treatment variables (NAC and adjuvant chemotherapy), tumor-related parameters (location, pT and pN categories, tumor differentiation, and lymphovascular, perineural, and peripancreatic fat invasion, margin status), and histopathological biomarkers (TSR, β-CTN/m-CK index, and TB). On univariate analysis, TSR ≥13% (p = 0.015), β-CTN/m-CK index < 0.5 (p = 0.009), and high TB (p = 0.022), together with conventional factors such as age ≥ 75 (p = 0.033), nodal involvement (pN1/2) (p = 0.022), moderate/poor differentiation (p < 0.001), peripancreatic fat invasion (p = 0.015), and absence of adjuvant chemotherapy (p < 0.001), were associated with worse CSS. For RFS, β-CTN/m-CK index < 0.5 (p < 0.001) and TSR ≥ 13% (p = 0.020), along with conventional variables including absence of adjuvant chemotherapy (p = 0.001), pT3 stage (p = 0.046), nodal involvement (p = 0.001), moderate/poor differentiation (p < 0.001), lymphovascular invasion (p = 0.004), and peripancreatic fat invasion (p = 0.017), were significantly associated with worse outcomes (supplementary Table S5). Multivariate models identified TSR ≥13% (HR 2.414, 95% CI 1.072–5.439; p = 0.034) and β-CTN/m-CK index <0.5 (HR 2.028, 95% CI 1.120–3.670, p = 0.020) as independent predictors of shorter CSS and RFS, respectively, together with all other conventional clinicopathological factors assessed (Table 2).
3.10. Survival Analysis in the NAC Subgroup
Univariate analysis identified high TB (p = 0.022), male sex (p = 0.022), moderate/poor differentiation (p = 0.014), and positive resection margin (p < 0.001) as factors associated with worse CSS, while β-CTN/m-CK index < 0.5 (p = 0.018) and positive margin (p = 0.017) were significantly related to worse RFS (Supplementary Table S6). Multivariate analysis showed positive margin (HR 63.446, 95% CI 2.871–1402.272; p = 0.009) and male sex (HR 18.054, 95% CI 1.614–201.926; p = 0.019) as independent adverse factors for CSS, with high TB also demonstrating a marginal association (HR 6.008, 95% CI 0.847–42.627; p = 0.073). For RFS, β-CTN/m-CK index < 0.5 (HR 2.516, 95% CI 1.031–6.138; p = 0.043) was the only independent adverse factor (Table 3).
3.11. Survival Analysis in the UFS Subgroup
On univariate analysis, both TSR ≥ 13% (CSS: p = 0.025; RFS: p = 0.020) and β-CTN/m-CK index < 0.5 (CSS: p = 0.032; RFS: p = 0.006) were significantly associated with adverse outcomes. In addition, conventional prognostic factors including moderate/poor differentiation (CSS and RFS: both p < 0.001), absence of adjuvant chemotherapy (CSS: p < 0.001; RFS: p = 0.009), nodal involvement (RFS: p = 0.004), and lymphovascular invasion (RFS: p = 0.036) were also significant (Supplementary Table S7). In multivariate models, β-CTN/m-CK index < 0.5 (HR 2.230, 95% CI 1.106–4.500; p = 0.025) was the independent predictor of shorter RFS, and TSR ≥ 13% showed marginal significance for CSS (HR 2.536, 95% CI 0.947–6.790; p = 0.064). In addition, conventional prognostic factors including moderate/poor differentiation (CSS: HR 7.632, 95% CI 2.471–23.575; p < 0.001; RFS: HR 5.006, 95% CI 2.178–11.508; p < 0.001), peripancreatic fat invasion (CSS: HR 4.933, 95% CI 1.104–22.033; p = 0.037), and absence of adjuvant chemotherapy (CSS: HR 5.539, 95% CI 1.882–16.306; p = 0.002) were also identified (Table 4).
Kaplan–Meier curves for the overall PDAC cohort, NAC, and UFS subgroups stratified by TSR and β-CTN/m-CK index are shown in Figure 4. In the overall cohort, both TSR ≥ 13% and β-CTN/m-CK < 0.5 were associated with shorter CSS and RFS (both p < 0.05, log-rank). In the NAC subgroup, only β-CTN/m-CK < 0.5 was associated with shorter RFS (p = 0.018), whereas TSR showed no significant separation for either endpoint. In the UFS subgroup, TSR ≥ 13% predicted shorter CSS (p = 0.025) and RFS (p = 0.020), and β-CTN/m-CK < 0.5 likewise predicted shorter CSS (p = 0.032) and RFS (p = 0.006).
4. Discussion
Resection remains the standard treatment for PC, with studies suggesting potential survival benefits of NAC even in resectable disease [4,6,8,9], although others reported no clear advantage over UFS [4,5]. Although the S-1–based regimen used in Japan is less common in Western countries due to ethnic differences in tolerability, the clinical concept and benefits of NAC remain broadly applicable across chemotherapy protocols. In our cohort, survival did not differ significantly between NAC and UFS, but NAC patients tended to have lower pT stage and more frequent margin-negative resections. Further studies likewise noted lower pT stages in post-NAC specimens, particularly with stronger histological response [38,39]. These trends are consistent with prior multicenter findings using S-1 plus GEM [6,8] and reinforce the notion that NAC enhances resectability, even if survival benefits are not universally evident. The lack of statistical significance likely reflects the limited sample size and follow-up in our series.
To ensure reproducible TSR estimation, we applied a two-stage pipeline to m-CK–immunostained WSIs, combining epithelial segmentation and H&E-based tumor delineation. This approach reduces observer bias and enables objective quantification compared with conventional assessment [15,17,19,23]. High TSR (≥13%) tended to associate with margin-positive resections, consistent with prior findings that epithelial predominance correlates with invasive growth and margin involvement [14,16,19,20]. These data suggest that high TSR reflects a more aggressive invasive phenotype rather than sampling bias.
Across the entire cohort, TSR ≥ 13% independently predicted shorter CSS, with a similar trend in the UFS subgroup. This aligns with previous reports linking epithelial predominance to poor survival in PDAC [14,16,17,19]. Importantly, our study adds that digitally derived TSR preserves prognostic value even under standardized image analysis, supporting its potential as a reproducible biomarker. While abundant stroma has been associated with better outcomes [22,25], the present findings highlight that epithelial-rich tumors retain an adverse prognosis even when quantified objectively. From a clinical perspective, integrating TSR and β-catenin assessment into routine pathological workflows could enhance prognostic stratification. Digital image analysis may facilitate such implementation by providing standardized and reproducible quantification across institutions.
Within our NAC subgroup, TSR had no significant prognostic impact. Prior reports have shown that NAC modifies stromal composition, often decreasing stromal ratio or inducing encapsulating fibrosis [18,20]. Our data showed that lower TSR correlated with favorable histological response (Evans IIa/IIb), suggesting that TSR may reflect treatment efficacy rather than intrinsic biology after chemotherapy. This supports the concept that therapy-induced stromal remodeling alters the prognostic meaning of TSR. Indeed, experimental studies indicate that chemotherapy suppresses myofibroblasts and modifies stromal–epithelial interactions [26,27,52,53]. The dual nature of the stroma, which acts both as a physical barrier to drug delivery [27,53] and as a potential tumor-suppressive matrix [54], emphasizes that its biological role depends on the treatment context.
Aberrant β-CTN redistribution has been described in subsets of PDAC, but reported patterns vary across studies [31,32,33,34,35,36,37]. Discrepant nuclear staining reported previously may reflect artifacts related to antibody specificity, epitope recognition, or pre-analytical procedures [55]. Such signals should be interpreted cautiously, as they may not represent true nuclear translocation but rather nonspecific immunohistochemical artifacts. In our cohort, membranous β-CTN expression was largely preserved, with reduction mainly in poorly differentiated tumors. Stratified analysis confirmed significantly lower β-CTN/m-CK index values in these cases, supporting that de-differentiation weakens cell–cell adhesion and promotes invasion [31,32]. Unlike tumors with Wnt pathway activation, such as solid-pseudopapillary neoplasms, we found no nuclear accumulation of β-CTN, consistent with the rarity of CTNNB1 mutations in PDAC [31,56]. These findings indicate that β-CTN alterations in PDAC are primarily membranous rather than nuclear, reflecting differentiation rather than canonical Wnt activation.
To minimize variability, β-CTN was normalized to m-CK on serial sections, producing a β-CTN/m-CK index that provides internal control for staining intensity [57]. Using this metric, we compared PDACs treated with NAC or UFS and found that a low β-CTN/m-CK index (<0.5) predicted shorter RFS across all subgroups. Prior reports have shown inconsistent associations between β-CTN localization and survival [33,35,36,37], but our analysis demonstrates that decreased membranous β-CTN relative to epithelial content consistently indicates poorer outcomes, particularly after NAC. This suggests that β-CTN evaluation provides complementary information beyond histological response grading and may reflect therapy-resistant cellular phenotypes.
TB represents a well-established morphological marker of epithelial–mesenchymal transition and aggressiveness [40,41,42,43]. High TB was significantly correlated with peripancreatic fat invasion and marginally with perineural invasion, consistent with prior data [43,46,47]. In our NAC subgroup, TB was lower in Evans IIa/IIb than in Evans I tumors and correlated modestly with TSR, indicating that NAC may suppress budding activity through stromal remodeling. These observations suggest that therapeutic response reduces epithelial plasticity at the invasive front [12,20,58], supporting the potential of TSR, β-CTN/m-CK index. As TB reflects epithelial–mesenchymal transition [42,43], it may serve as a complementary morphological indicator of post-NAC tumor biology.
Conventional clinicopathological parameters also retained prognostic significance. In the NAC subgroup, margin positivity and male sex were independent adverse factors for CSS, consistent with prior reports [5,6,24]. In our UFS subgroup, moderate/poor differentiation, peripancreatic fat invasion and the absence of adjuvant chemotherapy predicted worse outcomes, consistent with previous and registry data [4,8,19]. The benefit of adjuvant therapy appeared limited to UFS patients, as NAC already selects responders, echoing findings from conversion surgery studies [49]. Future directions should include prospective validation of these findings in larger, multi-institutional and ethnically diverse cohorts, as well as evaluation of regimen-specific predictive value, particularly comparing S-1 and FOLFIRINOX (a combination of 5-fluorouracil, leucovorin, irinotecan, and oxaliplatin)-based NAC protocols. Such studies could clarify whether the observed associations between TSR, β-CTN/m-CK index, and TB remain consistent across different treatment contexts.
This study has limitations. It was a single-institution retrospective analysis with a small cohort, which may restrict generalizability. All analyses were based on resected specimens, and applicability to preoperative biopsies remains uncertain. Nevertheless, the use of standardized digital quantification enhances reproducibility and mitigates observer bias. Longer-term, multicenter validation will be needed to confirm these findings and to define how histomorphological indices such as TSR, β-CTN/m-CK, and TB can be integrated into prognostic modeling after NAC for PDAC.
5. Conclusions
The β-CTN/m-CK index consistently served as an independent prognostic factor across NAC-treated and UFS PDAC. TSR was associated with histological response to NAC, and TB was also evidently reduced following NAC. TSR additionally predicted cancer-specific survival in the overall cohort. Few studies have examined biomarkers capturing both prognostic relevance and therapeutic response in NAC-treated PDAC, underscoring the novelty of our findings and suggesting that integrated biomarker assessment may improve risk stratification and guide personalized treatment strategies. In UFS, adjuvant chemotherapy improved survival, and these pathological indices may help identify patients most likely to benefit from it, with deep learning-based WSI analysis offering further refinement.
The reference list from the paper itself. Each links out to its DOI / PubMed record.
- 1Zhao Z. Liu W. Pancreatic cancer: A review of risk factors, diagnosis, and treatment Technol. Cancer Res. Treat.202019153303382096211710.1177/153303382096211733357065 PMC 7768873 · doi ↗ · pubmed ↗
- 2Zottl J. Sebesta C.G. Tomosel E. Sebesta M.C. Sebesta C. Unraveling the burden of pancreatic cancer in the 21st century: Trends in incidence, mortality, survival, and key contributing factors Cancers 202517160710.3390/cancers 1710160740427106 PMC 12110279 · doi ↗ · pubmed ↗
- 3Klein A.P. Pancreatic cancer epidemiology: Understanding the role of lifestyle and inherited risk factors Nat. Rev. Gastroenterol. Hepatol.20211849350210.1038/s 41575-021-00457-x 34002083 PMC 9265847 · doi ↗ · pubmed ↗
- 4Ei S. Takahashi S. Ogasawara T. Mashiko T. Masuoka Y. Nakagohri T. Neoadjuvant and adjuvant treatments for resectable and borderline resectable pancreatic ductal adenocarcinoma: The current status of pancreatic ductal adenocarcinoma treatment in Japan Gut Liver 20231769871010.5009/gnl 22031136843421 PMC 10502496 · doi ↗ · pubmed ↗
- 5Ye M. Zhang Q. Chen Y. Fu Q. Li X. Bai X. Liang T. Neoadjuvant chemotherapy for primary resectable pancreatic cancer: A systematic review and meta-analysis HPB 20202282183210.1016/j.hpb.2020.01.00132001139 · doi ↗ · pubmed ↗
- 6Sugawara T. Rodriguez Franco S. Sherman S. Torphy R.J. Colborn K. Franklin O. Ishida J. Grandi S. Al-Musawi M.H. Gleisner A. Neoadjuvant chemotherapy versus upfront surgery for resectable pancreatic adenocarcinoma: An updated nationwide study Ann. Surg.202427933133910.1097/SLA.000000000000592537226812 · doi ↗ · pubmed ↗
- 7Sudo K. Nakamura K. Yamaguchi T. S-1 in the treatment of pancreatic cancer World J. Gastroenterol.201420151101511810.3748/wjg.v 20.i 41.1511025386059 PMC 4223244 · doi ↗ · pubmed ↗
- 8Unno M. Motoi F. Matsuyama Y. Satoi S. Toyama H. Matsumoto I. Aosasa S. Shirakawa H. Wada K. Fujii T. Neoadjuvant chemotherapy with gemcitabine and S-1 versus upfront surgery for resectable pancreatic cancer: Results of the randomized phase II/III Prep-02/JSAP 05 trial Ann. Surg.2025 online ahead of print 10.1097/SLA.0000000000006730 PMC 1269529440235447 · doi ↗ · pubmed ↗