Impact of Response Assessment Intervals on Survival and Economic Burden in Long-Term Responders to Immunotherapy for Advanced Non-Small-Cell Lung Cancer
Min Wang, Vannhong Soth, Xingzhu Liu, Yuxi Li, Xianyan Chen, Jianxin Xue, Youling Gong

TL;DR
This study shows that extending the time between check-ups for lung cancer patients on immunotherapy from 2 to 3 months does not harm survival and saves healthcare costs.
Contribution
The study provides the first statistical evidence that less frequent monitoring is safe and cost-effective for long-term immunotherapy responders.
Findings
Extending response assessment intervals from 2 to 3 months did not significantly affect survival outcomes.
A 3-month assessment strategy could save nearly USD 6 million annually in the US.
Patients with positive PD-L1 expression and those on immunotherapy alone had better survival benefits.
Abstract
Immunotherapy has emerged as a breakthrough for the treatment of advanced non-small-cell lung cancer (NSCLC), significantly improving patient survival. However, it has also led to an increase in the costs associated with response assessment. This study supports that extending the response assessment interval from 2 to 3 months maintains overall survival without compromising advanced NSCLC long-term responders to immunotherapy. This approach using less frequent monitoring may substantially reduce annual healthcare expenditure in the US by nearly USD 6 million. Background: Immunotherapy has emerged as a breakthrough for the treatment of advanced non-small-cell lung cancer (NSCLC), significantly improving patients’ progression-free survival (PFS) and overall survival (OS). However, the medical burden of response assessment has worsened for long-term maintenance therapy. It remains unclear…
Genes, proteins, chemicals, diseases, species, mutations and cell lines named across the full text — each resolved to its canonical identifier and authoritative record.
Click any figure to enlarge with its caption.
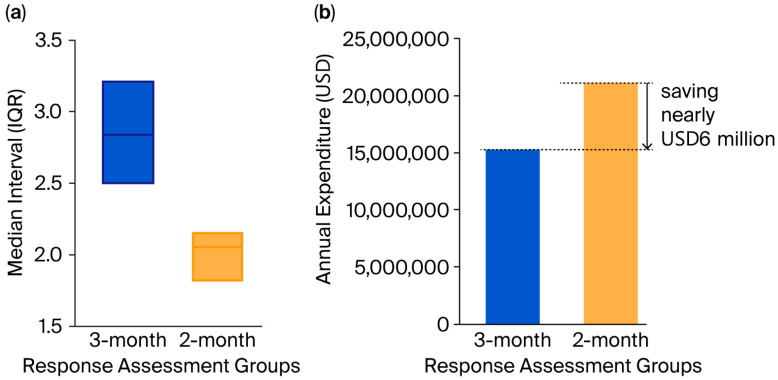 Figure 1
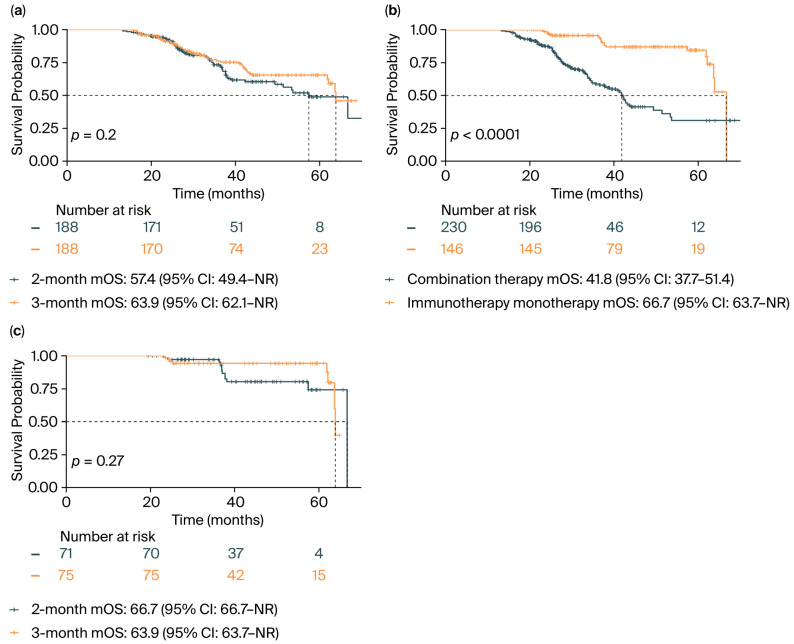 Figure 2
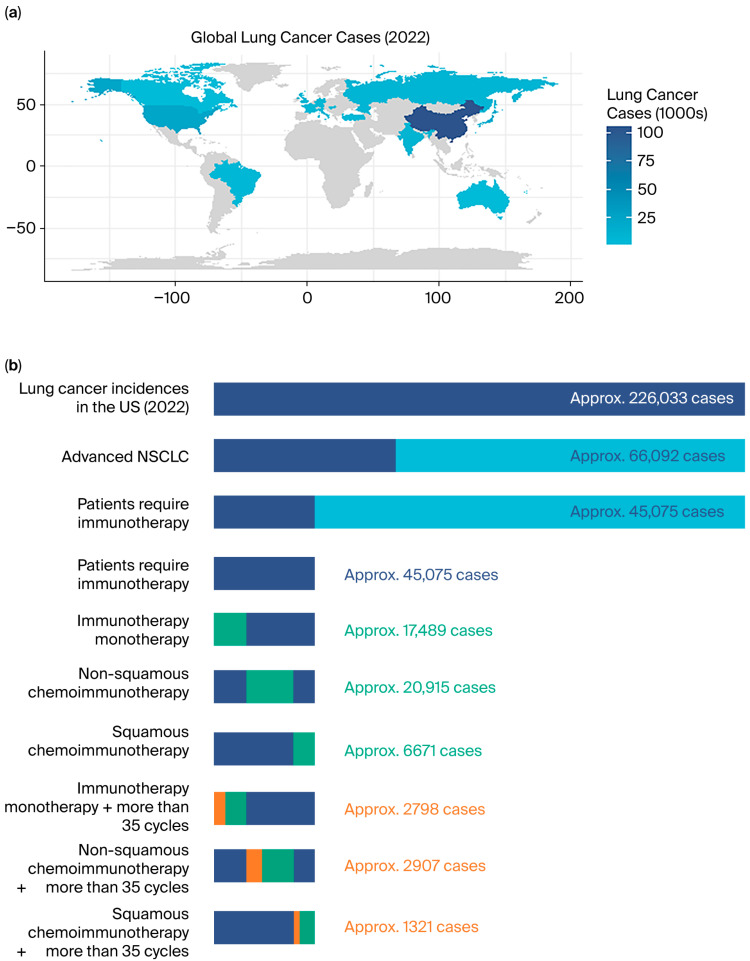 Figure 3
Peer Reviews
No public reviews on file for this paper yet. If you reviewed it on a platform where reviews are public (OpenReview, ICLR, NeurIPS, ICML), you can paste yours below so the community can read it here.
Videos
No videos yet. Explain this paper in a talk, walkthrough, or lecture? Add one.
Taxonomy
TopicsLung Cancer Treatments and Mutations · Cancer Immunotherapy and Biomarkers · Lung Cancer Diagnosis and Treatment
1. Introduction
Lung cancer is the most common cancer and the leading cause of death from cancer globally [1]. Non-small-cell lung cancer (NSCLC) is the most common type of lung cancer; it accounts for about 85% of lung cancers [2], with nearly 70% of patients presenting with locally advanced or metastatic disease at diagnosis [3,4].
Regarding advanced NSCLC, a large number of randomized clinical trials have confirmed immunotherapy to be a breakthrough and a new standard of care, substantially extending both progression-free survival (PFS) and overall survival (OS) [5,6,7,8]. Immune checkpoint inhibitors (ICIs) mainly targeting programmed death-1 (PD-1)/programmed death ligand 1 (PD-L1) activate antitumor immunity and provide a durable survival benefit [9], particularly in PD-L1-high NSCLC [10]. The KEYNOTE-024 [11] trial reported that 25.8% (39/151) advanced cancer patients received 35 cycles of pembrolizumab monotherapy for 2 years. Among these 39 patients, 32 were still alive 5 years after random assignment. Similarly, in trials investigating the administration of pembrolizumab plus chemotherapy, KEYNOTE-189 [12] and KEYNOTE-407 [13] indicated that more than one-tenth of patients (13.9% and 19.8%, respectively) underwent the 2-year maintenance therapy. For these patients, the 3-year OS rates from the time of completing therapy were 71.9% and 69.5%, respectively.
However, while immunotherapy greatly improves patients’ PFS and OS, it imposes a significant financial burden on patients and healthcare systems. An Italian study reported an average financial burden of EUR 25,859 per NSCLC patient over 16.4 months of follow-up [14]. Although pharmacological costs still account for the majority of expenses, the high frequency of medical visits and response assessment expenditure should also be of concern. The National Comprehensive Cancer Network (NCCN) [15] guidelines recommended that patients with advanced NSCLC should undergo response assessments every 6 to 12 weeks during maintenance therapy. In the clinical trial setting, patients are typically assessed every two cycles (42 ± 7 days). In routine clinical practice, however, the frequency is more variable, and assessments may occur every two to three cycles. A recent study suggested that reduced surveillance for metastases could benefit patients who have received radical treatment [16]; it highlighted that the potential harms of surveillance included not only the financial costs but also the surveillance-related anxiety, reduction in asymptomatic time during which quality of life could be higher, and radiation exposure. However, for advanced-stage patients who have achieved long-term survival with a sustained response, optimal surveillance strategies remain undefined due to a lack of evidence.
To the best of our knowledge, no studies have yet systematically elucidated the impact of response assessment intervals on survival and economic burden for long-term responders to immunotherapy who have advanced NSCLC. This retrospective study aimed to determine the applicable assessment interval to facilitate clinical practice and consider the economic benefits concerned.
2. Materials and Methods
2.1. Target Population
Our study cohort was derived from West China Hospital, Sichuan University, from 2018 to 2023. The inclusion criteria were as follows: age ≥ 18 years; pathologically confirmed NSCLC; AJCC 8th edition stage IV; underwent first-line immunotherapy and maintenance therapy; Eastern Cooperative Oncology Group Performance Status (ECOG-PS) 0–1; PFS > 12 months. Patients were excluded if they lacked accessible assessment records within our hospital’s Health Information System (HIS) or from external facilities where they underwent subsequent examinations. The study protocol was approved by the institutional research ethics committee of West China Hospital of Sichuan University, and the need for written informed consent was waived because the data were retrospective and unidentifiable.
2.2. Collection of Variables
We collected patient demographics (age, gender, smoking history), histological type, PD-L1 expression (<1%, 1–49%, ≥50%), ECOG-PS, immunotherapy drugs, immunotherapy monotherapy (yes/no), radiotherapy history (yes/no), as well as all medical imaging, laboratory tests, and response assessment records. Tumor response evaluation was measured by The Response Evaluation Criteria In Solid Tumors (RECIST Version 1.1) by two oncologists. The primary endpoint was OS, defined as the time from diagnosis to death, or the follow-up deadline (30 April 2024).
2.3. Classification of Response Assessment Strategy
In clinical practice, there is variability in imaging intervals due to scheduling conflicts from holidays, treatment-related interruptions, and personal reasons. Therefore, we established a dual-metric validation to classify the response assessment group using the median value (9 weeks) of 6–12 weeks as the stratification threshold. This approach combined the (1) mean interval (total observation duration divided by number of imaging assessment scans) and (2) median scan interval. Successful group classification occurred when both of the metrics aligned. For discordant cases, we manually reviewed the patient’s clinical records to identify the reasons for discrepancies. Cases with unexplainable deviations were excluded from this study.
2.4. PFS Stratification
Methodologically, patients were stratified into two groups based on PFS, using the median value of 21.08 months as the cutoff. This stratification was necessary because, in clinical practice, patients with longer PFS often undergo a gradual reduction in the frequency of their response assessments. This practice naturally leads to a larger proportion of long-PFS patients being followed-up at 3-month intervals, creating a significant imbalance between the comparison groups. To mitigate this confounding effect, we employed both PFS stratification and propensity score matching (PSM).
2.5. Economic Analysis and Modeling Process
CMA was used for economic evaluation. Based on the World Health Organization’s (WHO) epidemiologic statistics and data from the KEYNOTE-042 [8], 189 [12], and 407 [13] clinical trials, an extrapolation model was developed. The modeling process was as follows: NSCLC constitutes approximately 85% of all lung cancer cases [17], with 34.4% of these being advanced cases [18]. After excluding patients eligible for targeted therapy (EGFR mutation: 24.4% [19]; ALK: 4.4% [20]; ROS1 fusion: 2.59% [21]), approximately 68.2% of the advanced patients were estimated to be candidates for immunotherapy. According to our study, the distribution of first-line immunotherapy regimens was as follows: 38.8% received immunotherapy monotherapy, 46.4% received chemoimmunotherapy for non-squamous NSCLC, and 14.8% received chemoimmunotherapy for squamous NSCLC. Based on 5-year data from KEYNOTE-042 (immunotherapy monotherapy), KEYNOTE-189 (non-squamous chemoimmunotherapy), and KEYNOTE-407 (squamous chemoimmunotherapy), 16.0%, 13.9%, and 19.8% of patients, respectively, completed 35 cycles of maintenance immunotherapy (PFS > 24 months). Using this model, the proportion of patients receiving immunotherapy who achieve long-term responses can be estimated.
The NCCN guidelines for the management of immune-related adverse events (irAEs) [22] recommended that patients undergoing immunotherapy should receive complete blood count (CBC) and comprehensive metabolic panel (CMP), prior to each treatment or every 4 weeks during immunotherapy, and thyroid-stimulating hormone (TSH) and free thyroxine (FT4) every 4 to 6 weeks during immunotherapy. CT with or without contrast every 6 to 12 weeks was also suggested during maintenance therapy for those with known or high-risk sites of disease. Based on these recommendations, we defined the following tests as essential for response assessment in our extrapolation model: Chest CT (with and without contrast), Abdomen CT (with and without contrast), CBC, CMP, TSH, and FT4.
U.S. News has ranked the best cancer hospitals for treatment, and we evaluated the price transparency files of the Top 10. Hospital standard charges are often much higher than the actual payments, and these charges vary for each individual. Significant variations arise from a patient’s specific medical condition, care setting, and the negotiated rates established with their health insurance company. Therefore, our analysis employs the minimum standard charges (USD) from the price transparency files as the base cost (obtained from these hospitals’ websites). We then calculated the mean price across hospitals as the final estimated price for each test.
2.6. Statistical Analysis
Survival benefits were evaluated using Kaplan–Meier estimators (median overall survival [mOS] in months with 95% confidence intervals [CIs] was derived) and Cox proportional hazard models. Categorical variables were compared using Pearson’s chi-square test. Continuous variables were compared using Student’s t-test or the Mann–Whitney U test, as appropriate. All analyses were performed using R (version 4.3.2), and all statistical tests were two-sided with a significance threshold of p < 0.05. To control for potential confounding factors due to imbalances in the baseline characteristics, PSM was performed using the “MatchIt” package in R. Factors were matched in a 1:1 ratio with a caliper width of 0.1.
3. Results
3.1. Patient Features
In this retrospective study, 7942 immunotherapy cases were retrieved from the database, and 588 NSCLC cases were selected for the PSM. The cohort consisted of 476 (81.0%) males and 112 (19.0%) females, with a median age of 63 years. Most patients (71.9%) had non-squamous cell carcinoma, while 28.1% had squamous cell carcinoma. A total of 229 patients followed a 2-month response assessment strategy, and 359 followed a 3-month strategy. The median follow-up was 28.7 [95% CI: 27.0–32.7] months. In total, 177 deaths were recorded.
Before the PSM, significant differences existed in terms of PD-L1 expression, PFS stratification, immunotherapy drugs, and radiation history. The baseline characteristics of the patients before the PSM are detailed in Table 1. After the PSM, the analysis yielded a well-balanced final cohort of 376 patients (188 in each group; Table 1). The median interval of response assessments in the 2-month group (n = 188) was 2.05 months (interquartile range [IQR]: 1.81–2.17), whereas in the 3-month group (n = 188), it was 2.84 months (IQR: 2.50–3.22, Figure 1a).
3.2. Survival Analysis
As shown in Figure 2a, there was no significant difference in overall survival between the two groups (mOS: 57.4 months [95% CI: 49.4–not reached (NR)] for the 2-month group vs. 63.9 months [95% CI: 62.1-NR] for the 3-month group; p = 0.200). Consistent with this, the Cox regression analysis revealed a nonsignificant hazard ratio (HR) of 0.78 [95% CI: 0.53–1.14] for the 3-month group (Table 2).
In the multivariate analysis, age ≥ 63 years was significantly associated with a higher risk of death (HR: 2.03 [95% CI: 1.35–3.06]; p = 0.001). In contrast, patients who received immunotherapy monotherapy had a significantly lower HR (0.24 [95% CI: 0.14–0.40]; p < 0.001). Significant survival benefits were also observed in patients with positive PD-L1 expression compared with those with <1% expression (for expression ≥ 50%: HR: 0.26 [95% CI: 0.10–0.69]; p = 0.007). The multivariate model also included gender, smoking history, histological type, radiotherapy history, and immunotherapy drugs; however, none of these variables showed a statistically significant association with overall survival.
We found some significant baseline differences between the immunotherapy monotherapy and combination therapy groups (Table S2). Patients receiving immunotherapy monotherapy were significantly more likely to be ≥63 years old (56.2% vs. 38.3%), have PFS exceeding the median (65.8% vs. 42.2%), and exhibit PD-L1 expression ≥ 50% (43.8% vs. 30.9%). No significant differences were observed in terms of gender distribution, histological type, smoking history, radiotherapy history, or response assessment strategies between groups (p > 0.05). The Kaplan–Meier curve (Figure 2b) showed a significant survival benefit for patients receiving immunotherapy monotherapy (mOS: 66.7 [95% CI: 63.7-NR]) compared with those in the combination therapy group (mOS: 41.8 [95% CI: 37.7–51.4]; p < 0.001). Among patients receiving immunotherapy monotherapy (Figure 2c), no statistically significant difference in overall survival was observed between the 2-month and 3-month response assessment groups (2-month group mOS: 66.7 [95% CI: 66.7-NR] vs. 3-month group mOS: 63.9 [95% CI: 63.7-NR]; p = 0.270).
3.3. Economic Cost Analysis and the Extrapolation Model
Based on the estimated 226,033 lung cancer cases in the United States (2022), we estimated that there would approximately be 7026 new long-term responders to immunotherapy (defined as PFS > 24 months after 35 immunotherapy cycles). The extrapolation model flowchart is shown in Figure 3. Details from five hospitals, where both minimum and maximum standard charge ranges were available, are summarized in Table 3. The minimum standard charge for a single response assessment was USD 514.24, and the maximum standard charge was USD 7073.79. If, for these new cases, the 3-month strategy was followed, this could reduce annual response assessment expenditure by a conservative estimate of USD 5,883,310.34 (2-month group: USD 21,150,128.32 vs. 3-month group: USD 15,266,817.97, Figure 1b), without compromising patients’ overall survival. This suggests that the less-intensive response assessment represents a cost-minimization strategy relative to the more intensive one. Moreover, it is important to note that since we used the minimum standard charges, our model may underestimate the actual cost savings.
4. Discussion
This retrospective study evaluated the impact of response assessment intervals on survival and economic burden in advanced NSCLC patients with long PFS following immunotherapy. For the first time, with a statistically rigorous analysis, we revealed a more rational response assessment interval for long-term responders to improve health economics. Furthermore, an extrapolation model was developed to evaluate the potential economic benefits within the US healthcare system.
Tumor response assessments are pivotal in the tumor treatment process. The NCCN guidelines recommended that patients receive a response assessment every 6–12 weeks during their maintenance [15]; however, there is a lack of evidence regarding the optimal interval for survival outcomes and associated economic implications. Our study compared the two most common response assessment strategies in clinical practice: the 2-month strategy and the 3-month strategy. No significant difference in overall survival was observed between these two groups; however, the annual costs were lower in the 3-month group compared with those in the 2-month group. We suggest that, for advanced NSCLC patients receiving immunotherapy with PFS exceeding 12 months, clinicians may consider extending these patients’ response assessment intervals, thus alleviating the financial burden without compromising survival outcomes.
While immunotherapy enables durable remission in advanced NSCLC, the molecular mechanisms underlying sustained response remain incompletely characterized. A recent study by Joan et al. [23] identified that a unique immune microenvironment profile, characterized by high tumor mutational burden (TMB)/PD-L1 expression and low burden of somatic copy number alterations (SCNAs), can predict long PFS (>18 months). This provides a mechanistic basis for disease stabilization in sustained responders. Notably, our study also exhibited a higher survival benefit for PD-L1-positive patients. For specific favorable subgroups, such as PD-L1-positive patients or those receiving immunotherapy monotherapy, a precision-guided extension of assessment intervals may be cost-effective.
Response assessment primarily integrates clinical evaluation (history and physical examination), laboratory tests, and tumor burden quantification via medical imaging. Laboratory tests facilitate the critical surveillance of irAEs. According to the American Society of Clinical Oncology (ASCO) and NCCN guidelines [22], the testing interval for thyroid abnormalities is 4–6 weeks. For myocarditis, the most life-threatening irAE [24,25], the baseline myocardial assessment is performed one week after the first ICI and, if normal, is followed by a 3-month cycle guided by clinical symptoms and electrocardiograms. While this comprehensive monitoring protocol effectively optimizes irAE management, current evidence lacks rigorous cost–benefit analyses of such surveillance strategies. A strict cardiac reassessment strategy for high-risk patients is considered necessary due to its safety implications. However, the clinical necessity of 4–6-week thyroid monitoring may warrant reconsideration, as most abnormalities (e.g., subclinical hypothyroidism) are relatively controllable and seldom mandate treatment cessation. Additionally, imaging monitoring is essential for response assessment; however, its radiation-related harm requires careful risk–benefit evaluation. A recent multinational research [26] demonstrated a significant dose–response relationship between CT radiation exposure and glioma incidence. Furthermore, cumulative CT radiation has been associated with elevated risks of multiple malignancies, including skin cancer, breast cancer, and hematologic neoplasms [27,28]. Epidemiological evidence has indicated that two to three standard CT scans (30–90 mSv) can significantly increase the risk of radiation-induced cancer [29,30]. Therefore, clinical imaging strategies should be personalized to minimize exposure to radiation while maintaining diagnostic accuracy.
The present study investigated the correlation between response assessment strategies and survival outcomes in long-PFS patients receiving immunotherapy while simultaneously conducting a pioneering economic analysis of these strategies’ associated burden. However, several limitations of this study must be acknowledged. Firstly, based on its retrospective nature, observational bias was unavoidable when interpreting these results. The absence of patient-reported utility values and quality-adjusted life years (QALYs) precluded a cost–utility analysis (CUA), which is the preferred pharmaco-economic method for evaluating interventions that exhibit substantial differences in terms of both clinical benefit and cost between treatment groups. Instead, we employed CMA due to the absence of significant differences in OS and the unavailability of utility data. Secondly, although clinical guidelines recommend more frequent laboratory testing than imaging, our study considered one laboratory test plus one imaging test as a single response assessment event. This approach may have led to an underestimation of potential cost savings. Furthermore, only direct medical costs were included, omitting direct non-medical costs (e.g., transportation) and indirect economic burdens (e.g., productivity loss) [31,32]. This also resulted in an underestimation of the annual expenditure. Moreover, the model was based on data from the U.S. healthcare system, and the variation in response assessment costs across hospitals and regions may limit the generalizability of our findings. Finally, the limited sample size and the absence of an external validation cohort may have introduced selection and information bias. To enhance the reliability of future findings, prospective multicenter studies with larger cohorts and independent validation datasets are warranted.
5. Conclusions
This study presented the first statistical evidence supporting a refined response assessment strategy for long-term responders to immunotherapy with advanced NSCLC. A 3-month assessment interval did not significantly compromise patient survival outcomes and may also reduce annual US healthcare expenditure substantially. These findings support the adoption of a less frequent, yet equally effective, monitoring approach to make tumor surveillance more precise and cost-effective.
The reference list from the paper itself. Each links out to its DOI / PubMed record.
- 1Bray F. Laversanne M. Sung H. Ferlay J. Siegel R.L. Soerjomataram I. Jemal A. Global Cancer Statistics 2022: GLOBOCAN Estimates of Incidence and Mortality Worldwide for 36 Cancers in 185 Countries CA A Cancer J Clin.20247422926310.3322/caac.2183438572751 · doi ↗ · pubmed ↗
- 2Sung H. Ferlay J. Siegel R.L. Laversanne M. Soerjomataram I. Jemal A. Bray F. Global Cancer Statistics 2020: GLOBOCAN Estimates of Incidence and Mortality Worldwide for 36 Cancers in 185 Countries CA A Cancer J Clin.20217120924910.3322/caac.2166033538338 · doi ↗ · pubmed ↗
- 3Cagle P.T. Allen T.C. Olsen R.J. Lung Cancer Biomarkers: Present Status and Future Developments Arch. Pathol. Lab. Med.20131371191119810.5858/arpa.2013-0319-CR 23991729 · doi ↗ · pubmed ↗
- 4Molina J.R. Yang P. Cassivi S.D. Schild S.E. Adjei A.A. Non-Small Cell Lung Cancer: Epidemiology, Risk Factors, Treatment, and Survivorship Mayo Clin. Proc.20088358459410.1016/S 0025-6196(11)60735-018452692 PMC 2718421 · doi ↗ · pubmed ↗
- 5Brahmer J.R. Lee J.-S. Ciuleanu T.-E. Bernabe Caro R. Nishio M. Urban L. Audigier-Valette C. Lupinacci L. Sangha R. Pluzanski A. Five-Year Survival Outcomes with Nivolumab Plus Ipilimumab Versus Chemotherapy as First-Line Treatment for Metastatic Non–Small-Cell Lung Cancer in Check Mate 227J. Clin. Oncol.2023411200121210.1200/JCO.22.0150336223558 PMC 9937094 · doi ↗ · pubmed ↗
- 6Socinski M.A. Jotte R.M. Cappuzzo F. Orlandi F. Stroyakovskiy D. Nogami N. Rodríguez-Abreu D. Moro-Sibilot D. Thomas C.A. Barlesi F. Atezolizumab for First-Line Treatment of Metastatic Nonsquamous NSCLCN. Engl. J. Med.20183782288230110.1056/NEJ Moa 171694829863955 · doi ↗ · pubmed ↗
- 7Gandhi L. Rodríguez-Abreu D. Gadgeel S. Esteban E. Felip E. De Angelis F. Domine M. Clingan P. Hochmair M.J. Powell S.F. Pembrolizumab plus Chemotherapy in Metastatic Non–Small-Cell Lung Cancer N. Engl. J. Med.20183782078209210.1056/NEJ Moa 180100529658856 · doi ↗ · pubmed ↗
- 8De Castro G. Kudaba I. Wu Y.-L. Lopes G. Kowalski D.M. Turna H.Z. Caglevic C. Zhang L. Karaszewska B. Laktionov K.K. Five-Year Outcomes with Pembrolizumab Versus Chemotherapy as First-Line Therapy in Patients with Non–Small-Cell Lung Cancer and Programmed Death Ligand-1 Tumor Proportion Score ≥ 1% in the KEYNOTE-042 Study J. Clin. Oncol.2023411986199110.1200/JCO.21.0288536306479 PMC 10082298 · doi ↗ · pubmed ↗