Intraepithelial Lymphocytes and LAIR1 Expression in Celiac Disease
Joaquim Carreras, Giovanna Roncador, Rifat Hamoudi, Jose Antoni Bombi, Yohei Masugi

TL;DR
The study finds that immune cells in celiac disease show increased LAIR1 expression, suggesting a role in the disease's immune response.
Contribution
This study identifies LAIR1 as a novel immune checkpoint marker in celiac disease and demonstrates its overexpression in affected tissues.
Findings
IELs in celiac disease show a cytotoxic T-cell phenotype with increased LAIR1 expression.
Higher LAIR1+ immune cell counts correlate with more severe intestinal damage in celiac disease.
AI analysis accurately classifies LAIR1 expression in intestinal tissues with 99.6% accuracy.
Abstract
Background: Celiac disease (CD) is a gluten-sensitive immune-related enteropathy of the small intestine characterized by villus atrophy, crypt hyperplasia, and increased intraepithelial lymphocytes (IELs). Objectives: To characterize the phenotype of IELs and immune cells of the lamina propria of small intestine control using immuno-oncology and immune-phenotype markers and test the most relevant marker, an immune checkpoint co-inhibitory receptor, leukocyte-associated immunoglobulin-like receptor 1 (LAIR1), in CD. Methods: Immunohistochemical analysis of CD3 (CD3E), CD4, CD8, CD103 (ITGAE), Granzyme B (GZMB), TCR beta (β), TCR delta (δ), CD56 (NCAM), CD16 (FCGR3A), LAIR1 (CD305), PD-L1 (CD274), PD1 (CD279), BTLA (CD272), TOX2, HVEM (TNFRSF14), CD163, HLA-DP-DQ-DR, IL4I1, and FOXP3 was performed using histological analysis. Gene expression analysis was performed using an independent…
Genes, proteins, chemicals, diseases, species, mutations and cell lines named across the full text — each resolved to its canonical identifier and authoritative record.
Click any figure to enlarge with its caption.
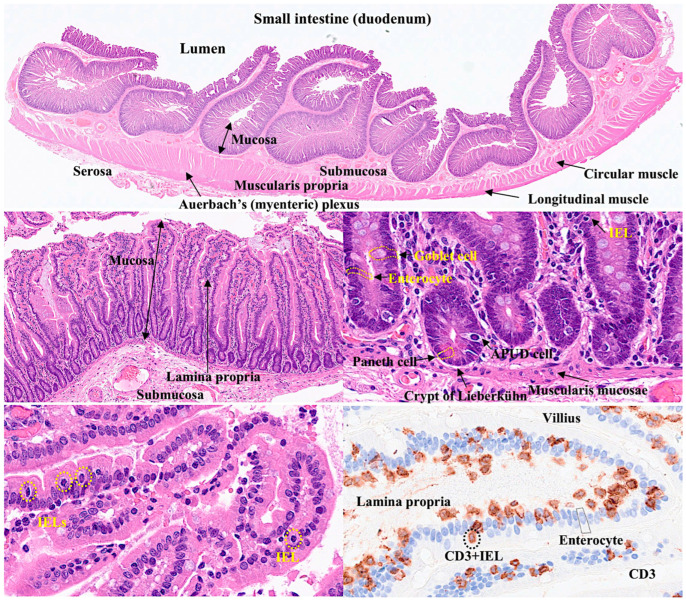 Figure 1
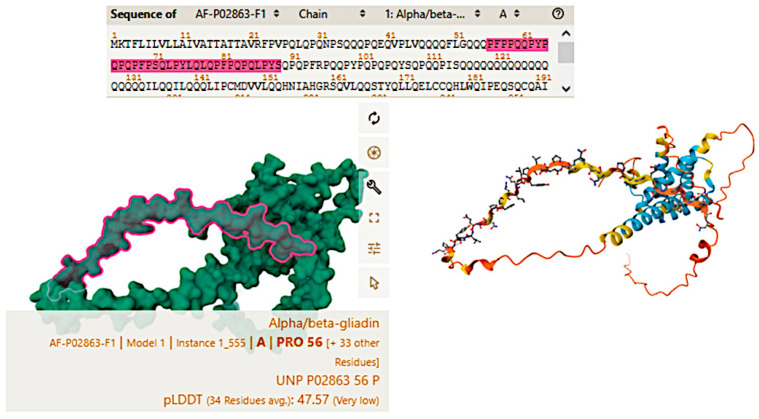 Figure 2
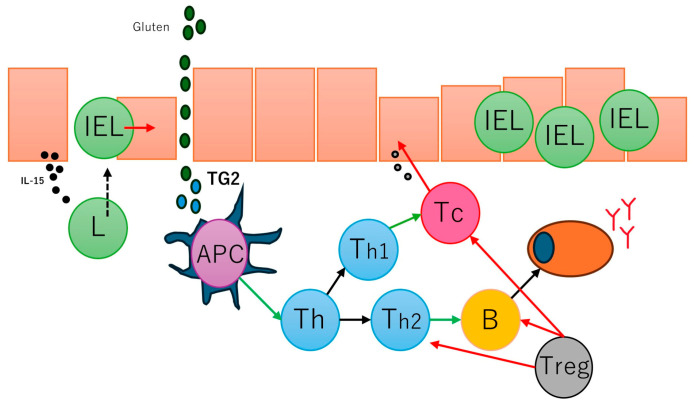 Figure 3
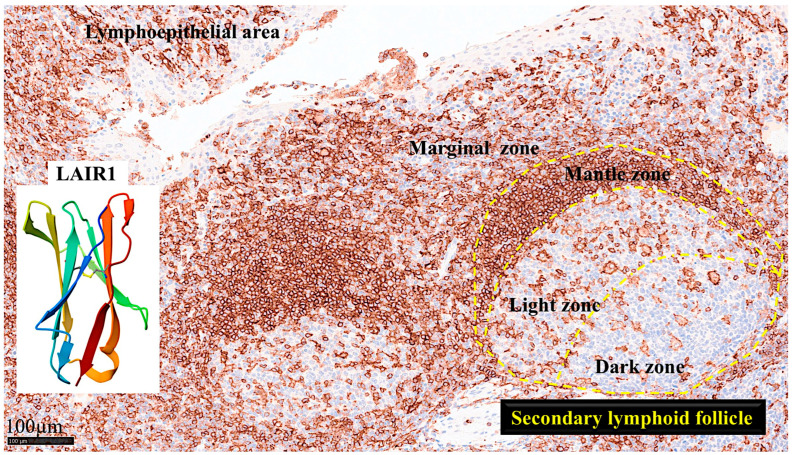 Figure 4
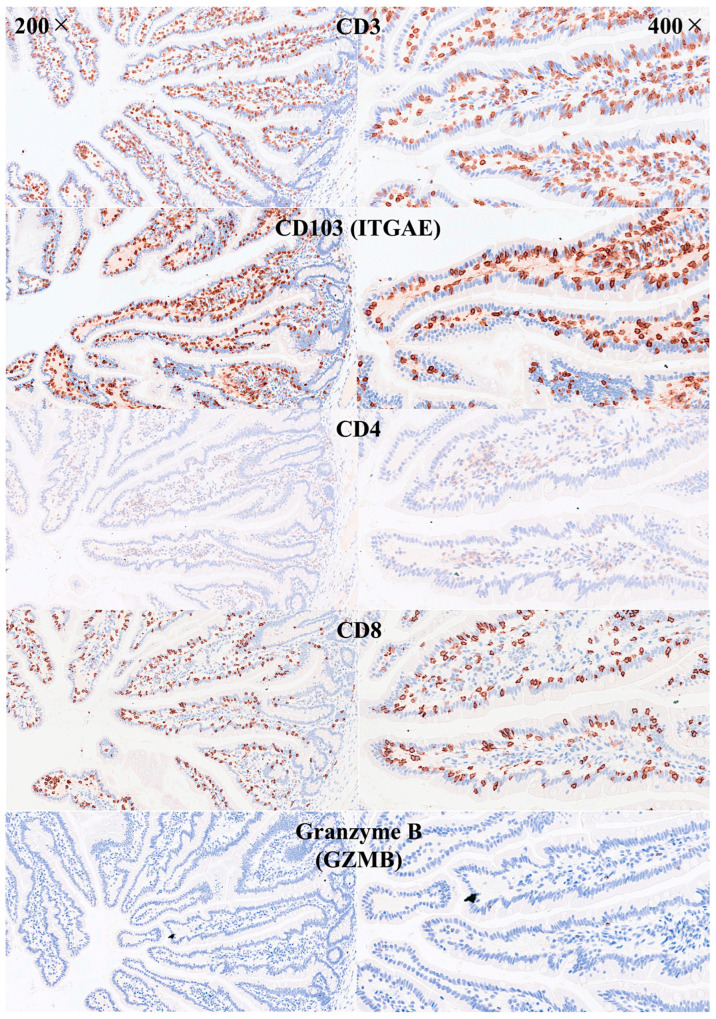 Figure 5
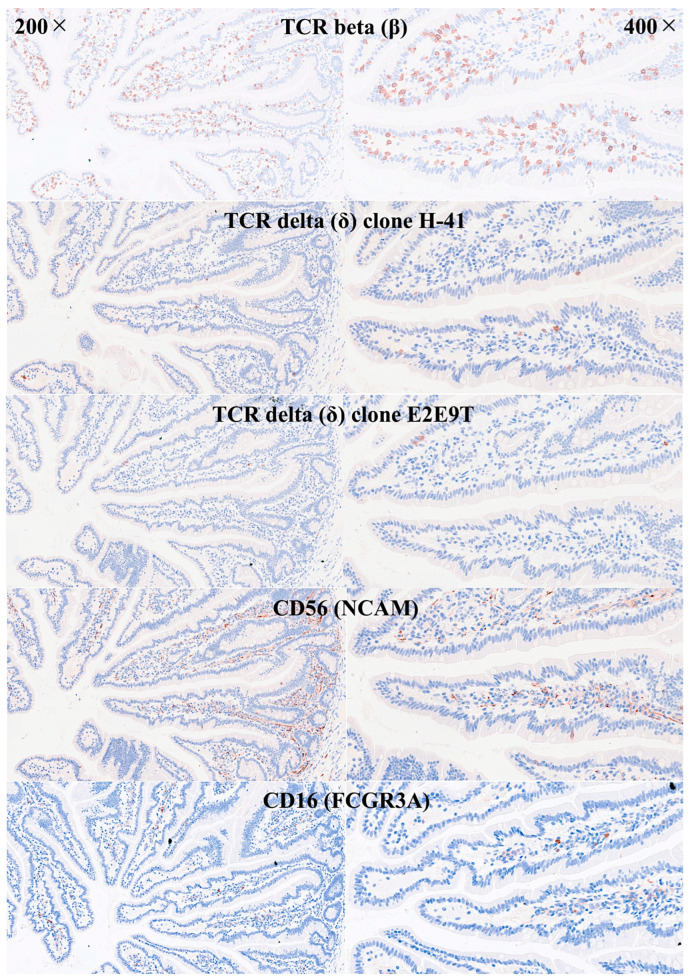 Figure 6
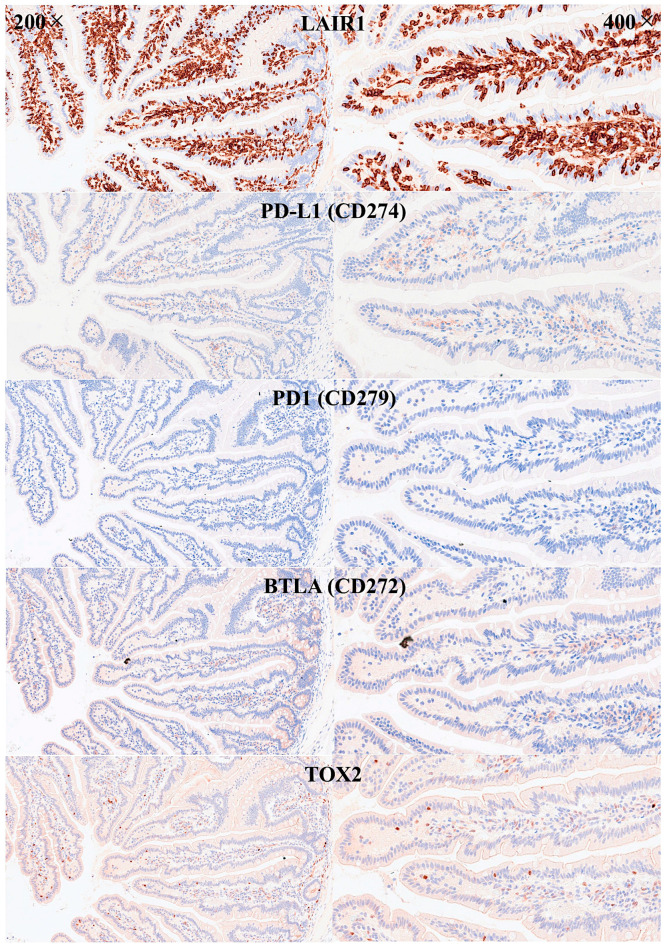 Figure 7
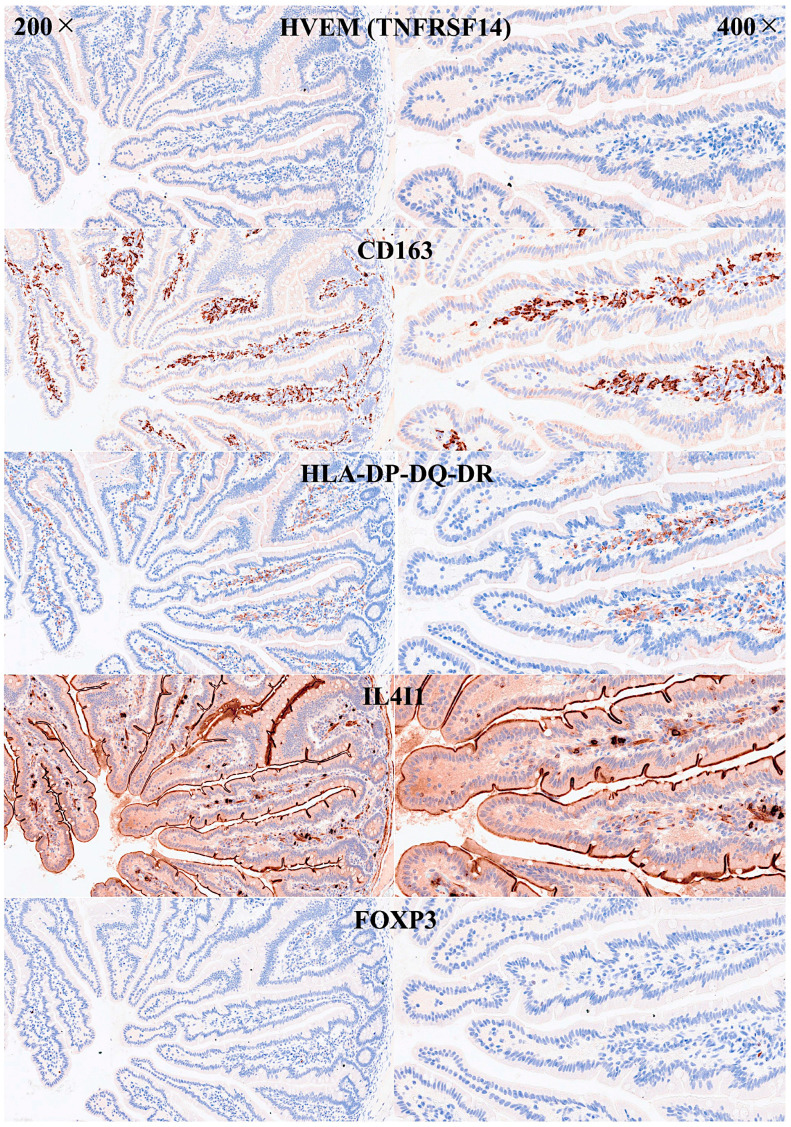 Figure 8
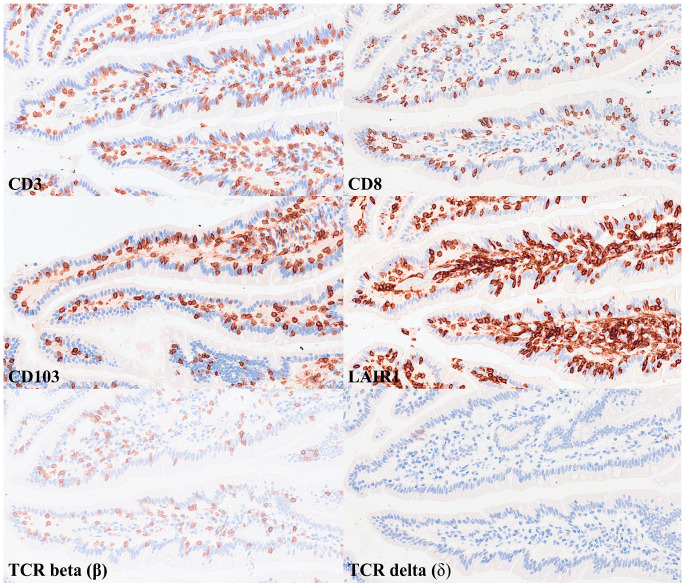 Figure 9
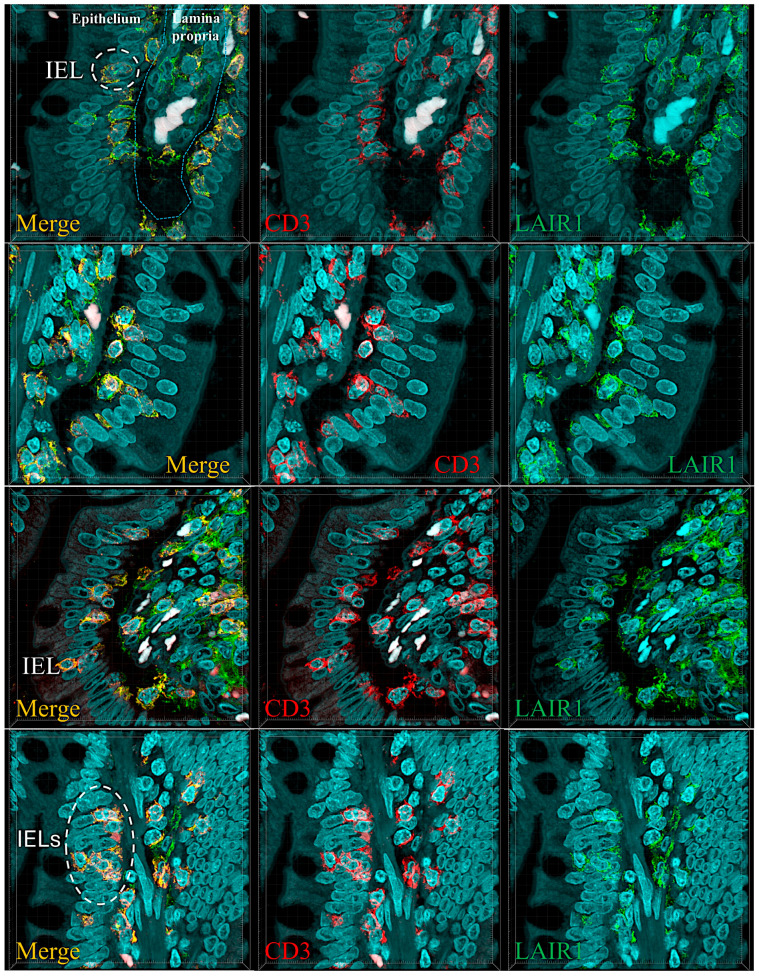 Figure 10
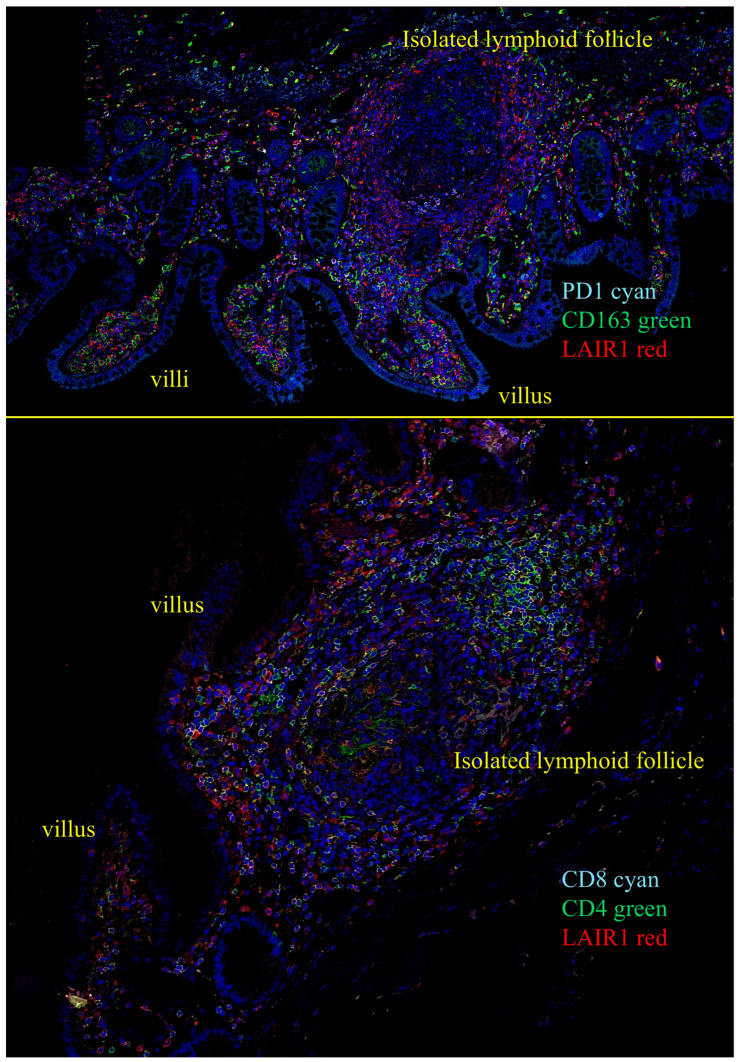 Figure 11
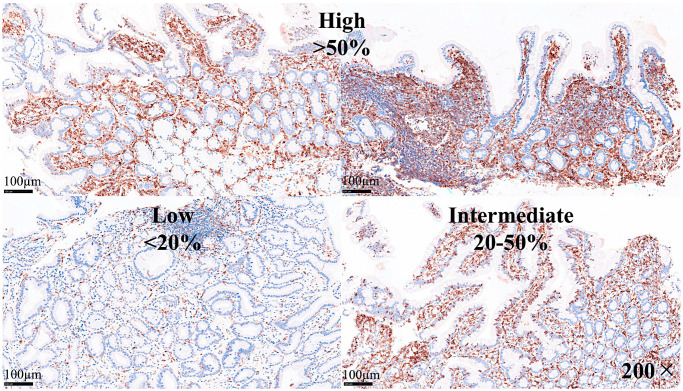 Figure 12
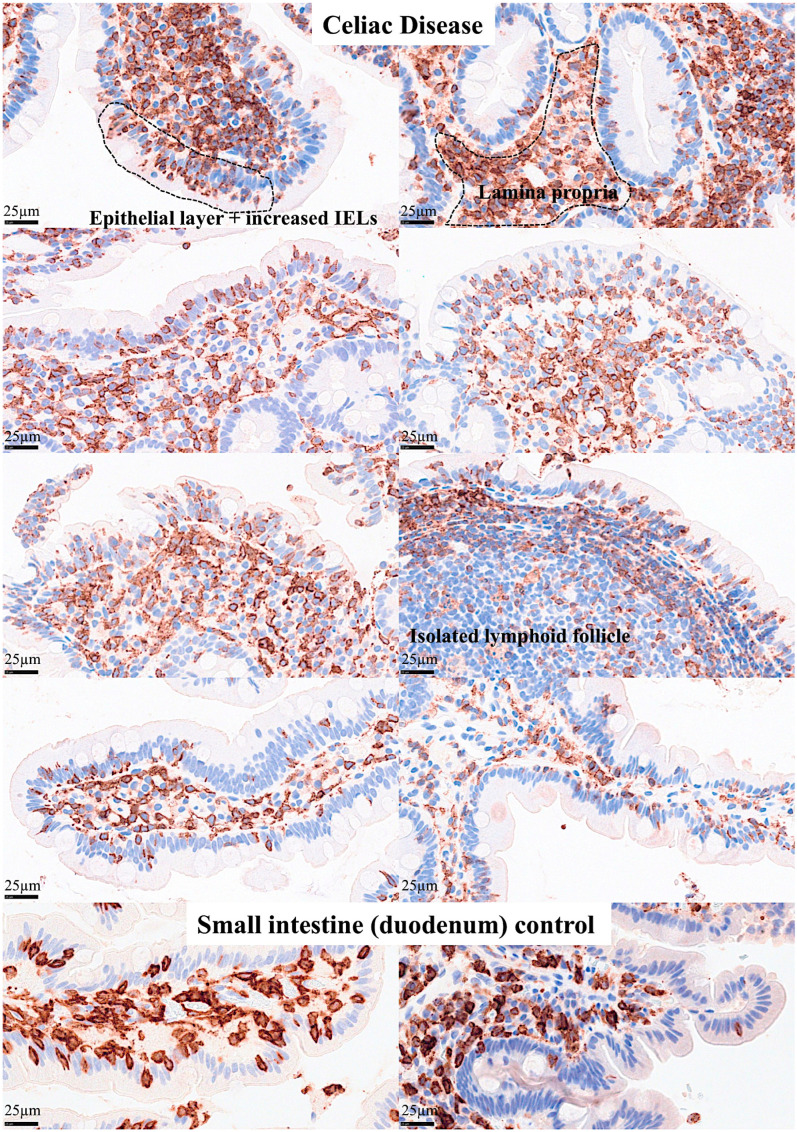 Figure 13
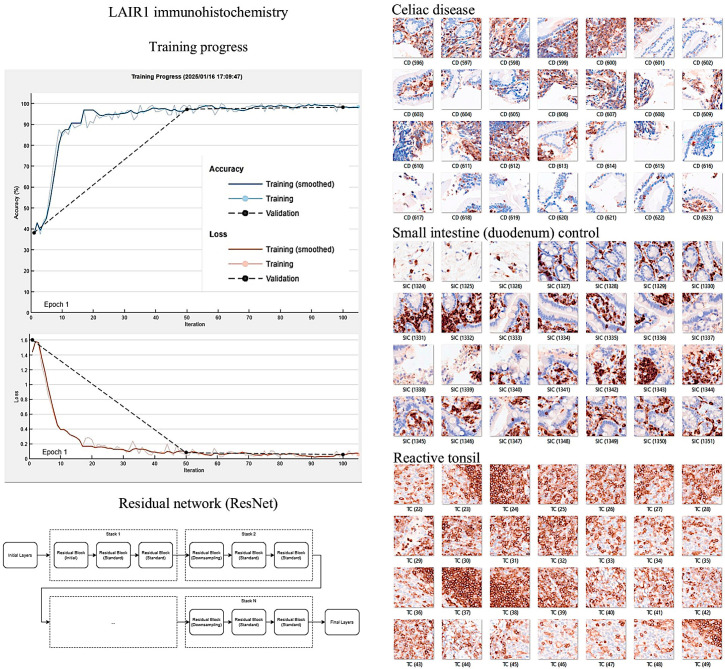 Figure 14
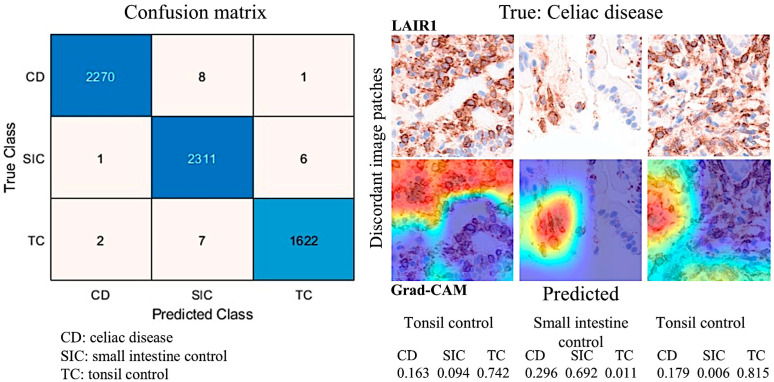 Figure 15
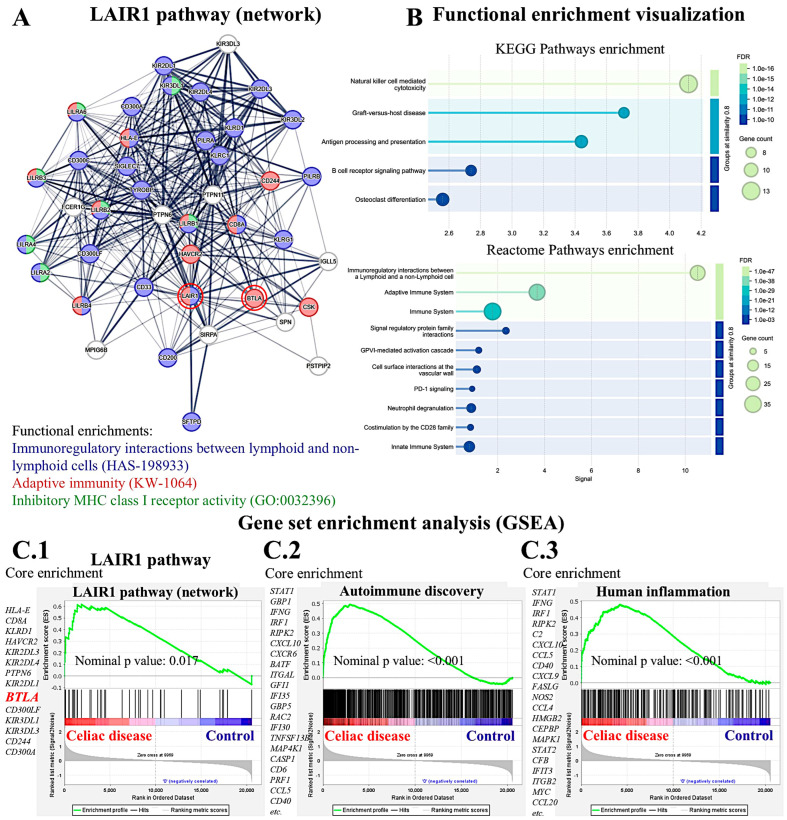 Figure 16
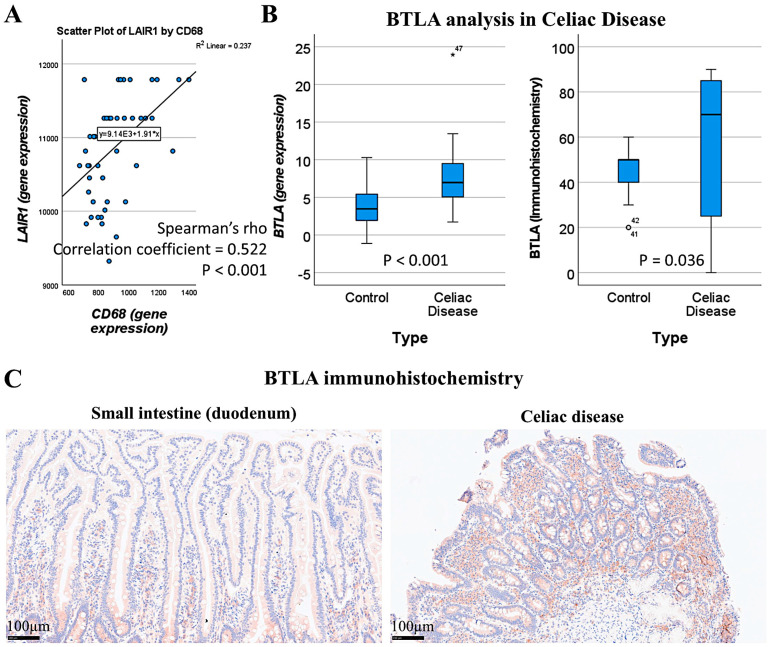 Figure 17
- —Ministry of Education, Culture, Sports, Science and Technology (MEXT)
- —Japan Society for the Promotion of Science (JSPS)
- —University of Sharjah
- —ASPIRE Precision Medicine Research Institute Abu Dhabi
Peer Reviews
No public reviews on file for this paper yet. If you reviewed it on a platform where reviews are public (OpenReview, ICLR, NeurIPS, ICML), you can paste yours below so the community can read it here.
Videos
No videos yet. Explain this paper in a talk, walkthrough, or lecture? Add one.
Taxonomy
TopicsCeliac Disease Research and Management · Digestive system and related health · Microscopic Colitis
1. Introduction
1.1. Histology of the Small Intestine
The normal intestinal mucosa has a defined architecture, including the villi, crypts, lamina propria, and muscularis mucosae.
The villi exhibit a digitiform shape with a 3:1 ratio between the height of the villi and the depth of the glandular crypts. The glandular crypts comprise several cell subtypes, including epithelial, Paneth, goblet, and endocrine cells. Each of these cells has different functions.
Intestinal epithelial cells (IECs) line the surface of the intestine and are responsible for aliment digestion, nutrient absorption, and infection protection by creating a physical barrier and modulating the immune response [1]. Intestinal epithelial cells are sensitive to the nutrients in the diet [1]. Paneth cells secrete alfa defensins, which are broad-spectrum microbicides that control gut microbiota and intestinal homeostasis. In hematoxylin and eosin (H&E) staining, Paneth cells display bright red cytoplasmic granules [2]. Goblet cells produce mucus and are intimately involved in controlling the mucosal immune system [3]. Goblet cells sample luminal antigens to initiate the adaptive immune response. There are several subtypes of goblet cells with different localization and gene expression [3]. There are several types of endocrine cells in the small intestine [4]: EC cells produce serotonin (5-HT) [5,6,7]; L cells produce GLP-1, GLP-2, and peptide YY [8,9,10]; K cells produce GIP and 5-HT [11,12]; I cells produce cholecystokinin and 5-HT [13,14]; D cells produce somatostatin [15,16]; G cells produce gastrin [17,18,19]; N cells produce neurotensin [20,21]; M cells produce motilin [22,23]; and S cells produce secretin [24,25] (Table 1). The main functions of endocrine cells are gut motility, appetite control, insulin release, cell proliferation control, gastric acid motility, pancreatic enzyme secretion, and intestinal absorption [4].
The lamina propria is a thin connective tissue layer located below the epithelial basement membrane. The lamina propria is rich in fibroblasts, myofibroblasts, vascular and lymphatic vessels, elastic fibers, smooth muscle fascicles, and immune cells, including lymphocytes, plasma cells, macrophages, eosinophils, and mast cells [26].
The muscularis mucosa is composed of a very thin layer of smooth muscular cells with motor activity, which are linked to mucosal absorption and secretion functions [27].
The submucosa contains blood and lymphatic vessels and nerves of the parasympathetic system, including the submucous plexus, also known as Meissner’s plexus [28]. The submucosal extracellular matrix is minimally immunogenic [28]. The muscularis propria [29] comprises an inner circular and outer longitudinal layer, and Auerbach’s (myenteric) plexus.
1.2. Instraepithelial Lymphocytes
IELs are found in the epithelium of the skin, genitourinary tract, respiratory tract, and intestinal tract [30]. IELs are a first line of defense against pathogens that have attacked the epithelial surface. The typical phenotype is of cytotoxic T-lymphocytes, being CD3- and CD8-positive [31]. The T-cell receptor (TCR) can be alphabeta (αβ)-positive or gammadelta (γδ)-positive. Some IELs present with self-reactive TCR, suggesting an extrathymic origin [30,32,33,34,35,36].
IELs are specialized immune cells that colonize the intestinal mucosa. Although B and innate cell populations may also transit inside this compartment, T-lymphocytes comprise the majority of intestinal IELs. IELs represent one of the largest lymphocyte populations in the intestine and contribute to epithelial homeostasis and barrier integrity, including tolerance, resistance, and tissue protection [37]. There are several subsets of IELs. However, all strains share common characteristics, including restricted TCR diversity, an epithelium-adapted profile, innate-like properties, and cytotoxic potential [37]. Human IELs can recognize modified self-antigens using both natural killer (NK) receptors and foreign antigens using the TCR [31]. The main characteristics of IELs are as follows:
- (1)IELs permanently reside in the epithelial tissue and do not recirculate because of the expression of CD103 [38,39] that binds to E-cadherin [39,40,41]. CD103 is also known as ITGAE (Integrin, Alpha E, and Human Mucosal Lymphocyte Antigen 1). E-cadherin is also known as Cadherin-1 (CDH1), and CD324.
- (2)The mucosal epithelial environment is highly immunogenic, with constant activation and tolerance that prevents tissue damage. Therefore, IELs express several T-cell co-inhibitory molecules and NK inhibitory receptors [42,43] and downregulate TCR co-stimulatory molecules.
- (3)The TCR diversity of IELs is limited compared to peripheral T-lymphocytes [44,45] and specific to conserved microbial or dietary antigens [46].
- (4)IELs have innate-like properties enabling rapid TCR-independent responses to stress signals [42,47].
- (5)IELs have cytotoxic activity [47,48,49,50], and an alteration may be associated with several gastrointestinal diseases such as celiac disease and inflammatory bowel disease (IBD) [50,51,52,53,54].
- (6)IELs are stratified into natural IELs (nIELs) and peripherally induced IELs (pIELs) [55,56,57,58]. nIELs are generated in the thymus and migrate to the intestine. In contrast, pIELs are derived from CD4-positive or CD8-positive T cells at inductive sites, such as gut-associated lymph nodes, in response to dietary and microbial antigens [31,37,55,56,57,58,59,60,61].
- (7)IELs can be further subclassified according to their TCR subtype: (I) TCRγδ + nIELs (tissue surveillance and repair), (II) TCRαβ + CD8αα + nIELs (regulation), (III) TCRαβ + CD8αβ + pIELs (effector memory, cytotoxicity), (IV) TCRαβ + CD4 + pIELs (regulation, cytotoxicity) [31,37]. Subtypes I and II may recognize self-antigens using their TCR, are present at birth, and are microbiota-independent. Subtypes III and IV may recognize microbial, viral, and dietary antigens using TCRs, are absent at birth, increase with age, and are microbiota- and diet-dependent [31,37]. CD4 + FOXP3 + regulatory T-lymphocytes (Tregs) can undergo CD4 + CD8αα + IEL differentiation in the intestinal epithelium [62,63].
- (8)CD8αα+ is an indication of intestinal IELs. Conventional CD8 + T cells express the CD8αβ heterodimer that is a TCR coreceptor and enhance TCR-MHC-I interactions during antigen presentation. Most IELs express CD8αα homodimer that decreases TCR sensitivity and prevents IEL hyperactivation via the mechanism of CD8αα homodimer interaction with thymus leukemia (TL) antigen [64], which is expressed by intestinal epithelial cells. Therefore, TL expression plays a critical role in maintaining IEL effector functions. In a genetic model of inflammatory bowel disease, TL deficiency was associated with colitis [65].
- (9)IELs contribute to chronic intestinal inflammatory disease pathogenesis. Inflammatory bowel disease (IBD) includes Crohn disease and ulcerative colitis. Dysregulated intestinal immune response to microbiota is a cause of IBD [66,67]. IELs could play a regulatory role in IBD [65,66,67,68,69,70,71,72]. Preserved villous architecture and increased IELs characterize microscopic colitis [73,74,75,76]. Celiac disease is an autoimmune disease triggered by dietary gliadin and is characterized by villous atrophy, crypt hyperplasia, and chronic inflammation of the lamina propria [77,78,79,80]. In celiac disease, there are increased CD8αβ+ pIELs and TCRγδ+ nIELs [31]. IELs can undergo neoplastic transformation into enteropathy-associated T-cell lymphoma, a rare complication in patients with celiac disease who are unresponsive to gluten-free diet and treatment [81,82,83,84] (Table 2).
1.3. Celiac Disease
Celiac disease is a common immune-related disease with a prevalence of approximately 1% in most populations [85]. The incidence of celiac disease has increased in recent years; the reason for this is unknown, but it may be related to environmental factors associated with the loss of tolerance to dietary gluten [85].
The pathogenesis of celiac disease is multifactorial. The pathogenesis includes a genomic background with the presence of several genetic factors [86] such as the close association with the HLA-DR3-DQ2 and/or DR4-DQ8 gene locus, which is highly present in patients with celiac disease [87]. Other gene loci related to metabolism and the immune system have also been identified using genome-wide association studies (GWASs), such as 3p21.31 (CCR3 and CCR2), 4p27 (KIAA1109, ADAD1, IL2, and IL21), 6q15 (BACH2), 6q25.3 (TAGAP), 1q24.3 (FASLG, TNFSF18, and TNFSF4), 6q22.31 (NKAIN2), 10p15.1 (PFKFB3 and PRKCQ), and 17q21.32 (HOXB9) [88]. Genome-wide gene expression studies have also highlighted similar biomarkers, including APOC3, CYP3A4, OCLN, MAD2L1, MKI67, CXCL11, and IL17A [89]. Figure 1 shows the histology of CD.
Celiac disease is characterized by an abnormal mucosal immune response to gliadin fractions, resulting in chronic inflammatory infiltration of the lamina propria and epithelium and villous atrophy [90]. Regarding the adaptive immune response, the key factors are peptide 56-89 (α-gliadin) (Figure 2), which is resistant to gastrointestinal peptidases [91,92], tissue transglutaminase, and gliadin-reactive T cells.
In active and gluten-sensitive celiac disease, the number of intraepithelial lymphocytes increases, and these cells express interferon gamma and IL-10 [93]. The gammadelta T-cell receptor (γδTCR) is also found to be increased in intraepithelial lymphocytes [94] in addition to the common alfa-beta T-cell receptor (αβTCR); in a case of refractive celiac disease, intraepithelial lymphocytes may have an aberrant phenotype and restricted gene rearrangement [95,96]. Several antibodies are found in the serum of patients with celiac disease, including anti-gliadin antibodies (anti-AGAs), anti-deamidated gliadin peptide antibodies (anti-DGPs), anti-transglutaminase 2 antibodies (anti-TG2s), anti-R1-type reticulin antibodies (anti-ARAs), and anti-endomysia antibodies (anti-EMAs) [97]. Gluten peptides also activate innate immune responses, such as IL-15, intraepithelial lymphocytes, type 1 interferon (gamma), macrophages, monocytes, and dendritic cells, and induce dysbiosis [98]. A summary of the pathogenesis of celiac disease has been presented in our previous publications [77,78] (Figure 3).
Table 3 summarizes the epidemiology, pathogenesis, and clinical manifestations of celiac disease in adults.
The diagnosis of celiac disease includes a serologic evaluation, endoscopy with small bowel biopsy (duodenum), and HLA testing in selected patients [146,147]. The diagnostic approach of celiac disease depends on the individual’s disease probability. Individuals with low celiac disease probability should undergo serologic testing and, if positive, endoscopy and biopsy. When there is a high probability (highly suggestive clinical presentation and presence of risk factors), these patients should undergo both serologic testing and biopsy. Tissue transglutaminase (tTG)-IgA antibody is the single preferred test for the detection of celiac disease in adults. Serum antibody assays include autoantibodies, antigliadin, anti-endomysia, and anti-tissue transglutaminase [97,146,147,148].
The endoscopic characteristics of celiac disease have low sensitivity and include atrophic mucosa with loss of folds, fissures, nodularity, and prominent submucosal vascularity [149,150].
The histological features of celiac disease range from mild alteration with increased IELs to severe atrophy with loss of villi, high epithelial apoptosis, and crypt hyperplasia.
Table 4 presents the histological classification based on Marsh [151].
The definition of celiac disease is a condition in which a chronic inflammation of the mucosa improves morphologically in a gluten-free diet and relapses when it is reintroduced. Therefore, the treatment consists of lifelong adherence to a gluten-free diet and identification and treatment of nutritional deficiencies. Investigational approaches include the use of transglutaminase inhibitors [152,153,154,155].
1.4. LAIR1
Leukocyte-associated immunoglobulin-like receptor 1 (LAIR1), also known as CD305, is an immune-inhibitory receptor found on mature hematopoietic cells, particularly on immune cells such as mononuclear cells, natural killer cells, and T- and B-lymphocytes [156].
The gene is located in the 19q13.4 region and is known as the leukocyte receptor cluster, which contains several genes that encode leukocyte receptors of the immunoglobulin superfamily. LAIR1 induces cell death and inhibits cytokine release and the activation of the NFKB pathway in myeloid leukemia [157,158,159]. Figure 4 shows the structure of LAIR1. It is a type I glycoprotein comprising 287 amino acids belonging to the family IR [160].
A comprehensive review of the role of LAIR1 in immune cell responses and neoplasia was recently performed by Poggi A. et al. [161], and the association with immune disorders and hematological neoplasms was reported by Van Laethem F. et al. [156]. Immune cell function can be modulated using inhibitory receptors. Many of these inhibitory receptors recognize a limited number of specific ligands. However, a subgroup of inhibitory receptors, called inhibitory pattern recognition receptors (iPRRs) can bind a large number of ligands of structural similarity [162,163]. LAIR1 belongs to the iPRR group and recognizes common structural patterns in collagens and collagen domain-containing proteins [164].
Autoimmune diseases are characterized by a pathological response to self- or autoantigens. These disorders can be either systemic (such as systemic lupus erythematosus and vasculitis) or organ-specific (such as autoimmune thyroiditis and multiple sclerosis) and can be either acute or chronic [165]. The pathogenesis of autoimmune diseases is complex [165] and involves breakdown or defects in immune tolerance, defects in active regulation and control of autoreactivity (FOXP3 + Tregs, IL-10, CTLA-4, TGF-beta) [166], defects in regulation of autoimmune B-cell responses (autoreactive B cells) [167], targeting of cell surface and soluble antigens and immune complex formation, immune complexes (between autoantibodies and the corresponding autoantigen present in the circulation and/or on cell surfaces) [168], effector T-cell-mediated injury (cytotoxic cells) [169], innate immune mechanisms (pattern recognition receptors) [170], specific T-cell subsets (Th1, Th2, Th17, Tregs), cytokines, internalization of autoantibodies (myopathies), and dysregulation of apoptosis (autoimmune lymphoproliferative syndrome (ALPS) [171], systemic lupus erythematosus, rheumatoid arthritis, systemic sclerosis) [172]. Regarding ulcerative colitis, we recently described steroid-requiring patients with high infiltration of LAIR1+ cells in the lamina propria [173].
LAIR1 has been associated with the pathogenesis of several autoimmune diseases, including systemic lupus erythematosus (SLE) [174], rheumatoid arthritis (RA) [175], allergy (airway hyper-reactivity and asthma) [176], graft rejection (kidney transplant) [177], and chronic hepatitis [178]. Regarding neoplasia of the hematopoietic and lymphoid system, we have recently described the role of LAIR1 in the pathogenesis of follicular lymphoma [179] and diffuse large B-cell lymphoma [180].
Epidemiological studies continue to identify celiac disease-associated diseases such as inflammatory arthritis and irritable bowel disease [181]. Celiac disease is a systemic immunological disorder caused by gluten (gliadin and other prolamin) in genetically predisposed individuals. The pathogenesis is complicated and remains a subject of research. The basic treatment is elimination of products that may contain gluten from the diet. However, new therapeutic strategies are being developed, such as supplementation with exogenous endopeptidases, immune response modification, and the use of zonulin and transglutaminase 2 inhibitors [182]. Due to the relevance of LAIR1 immune-inhibitory receptor on the function and activation of mature hematopoietic cells, particularly on immune cells such as mononuclear cells, natural killer cells, and T and B-lymphocytes, the role of LAIR1 in intestinal mucosa (IELs) and celiac disease pathogenesis warrants analysis.
1.5. Aim of the Study
This study aimed to analyze the phenotype of intraepithelial lymphocytes (IELs) and the lamina propria in the small intestine, including LAIR1, and to confirm the expression of LAIR1 in celiac disease.
The highlights are as follows:
- In the small intestine control, IELs exhibited a cytotoxic T-cell phenotype and were positive for CD3, CD8, CD103, TCRβ, and LAIR1.
- CD was characterized by higher LAIR1-positive IELs and LP immune cells than the small intestine control (p = 0.004).
- Higher intestinal lesions evaluated by Marsh scoring were correlated with higher LAIR1 (p < 0.001).
- CD was characterized by gene-set enrichment of the LAIR1 pathway using an independent transcriptomic dataset.
2. Materials and Methods
2.1. Patients and Samples
This study included 16 cases of celiac disease (total number of biopsies n = 57), 18 cases of small intestine control, 11 reactive lymphoid tissue, and 3 lymphoma cases (used as immunohistochemical internal control). The celiac cases were selected from the Department of Pathology of Hospital Clinic Barcelona, Spain, as described in our previous publications [77,78]. The patients were diagnosed with celiac disease following the conventional diagnosis, with clinical criteria, positive celiac serology, and histological criteria, including the presence of increased intraepithelial lymphocytes with crypt hyperplasia (Marsh type 2) or villous atrophy (Marsh type 3). The detailed data are presented in Appendix A, Table A1.
This study was conducted according to the principles of the Declaration of Helsinki for human experimentation. Ethical Committee of Tokai University approved this study (IRB14R-080 and IRB20-156).
2.2. Immunohistochemistry
Several immunohistochemical markers were analyzed in the tissue samples using a Leica Bond Max automated stainer according to the manufacturer’s instructions. The primary antibodies that were used were the following: CD3 (clone LN10, Leica Biosystems, Leica K.K., Shinjuku-ku, Tokyo, Japan), CD4 (4B12, Leica), CD8 (4B11, Leica), CD103 (EP206, Leica), granzyme B (11F1, Leica), TCRβ (TRBC1/TCRβ constant region 1 (E6Z3S) Rabbit mAb #79485, Cell Signaling Technology K.K., Chiyoda-ku, Tokyo, Japan), TCRδ (TRDC/TCRδ (E2E9T) XP^®^ Rabbit mAb #55750, Cell Signaling), CD56 (CD56-504-L-CE, Leica), CD16 (CD16-L-CE, Leica), LAIR1 (CD305, JAVI82A, created by Giovanna Roncador, Spanish National Cancer Research Center (CNIO, Centro Nacional de Investigaciones Oncologicas, calle Melchor Fernandez Almagro, 3, 28029 Madrid, Spain), PD-L1 (73-10, Leica), PD1 (CD279, NAT105, CNIO), BTLA (CD272, FLO67B, CNIO), TOX2 (TOM924D, CNIO), HVEM (TNFRSF14, ab47677, Abcam Tokyo, Ota city, Tokyo, Japan), CD163 (CD163-L-CE, Leica), HLA-DP-DQ (JS76, CNIO), IL4I1 (BALI265E,543H,573B, CNIO), and FOXP3 (236A, CNIO). The details of the primary antibody details are presented in Table 5.
Confocal microscopy was performed as described previously [183] using a Fluoview FV3000 confocal laser scanning microscope (Olympus K.K, Hachioji, Tokyo 192-8507, Japan) with Alexa Fluor 488 and 594 and DAPI dyes.
The immunohistochemical expression of BTLA in celiac disease was imported from our previous publication, including the histological slides, and all data reanalyzed [77].
LAIR1 was evaluated in a semiquantitative manner as low (1+, <20%), intermediate (2+, 20–50%), and high (3+, >50%).
2.3. Image Classification
Image classification based on the immunohistochemical expression of LAIR1 was performed using transfer learning and the ResNet18 deep learning model, as recently described [77,184,185]. All histological slides were scanned using a NanoZoomer S360 digital slide scanner (Hamamatsu Photonics K.K., Hamamatsu City, Shizuoka Pref., 430-8587, Japan). After visualization using the NDP.view2 image viewing software U12388-01 (Hamamatsu Photonics K.K.), the whole-tissue sections were exported into a jpeg file at 200× magnification and 150 dpi. The images were split into images patches of 224 × 224 × 3 using PhotoScape v3.7 (MOOII Tech, Korea; http://www.photoscape.org/; last accessed on 13 October 2025). All image patches were manually revised to exclude artifacts such as broken, folded, and nondiagnostic images. Image patches that were not 224 × 224 in size, those without tissue, or those with less than 20% tissue were automatically discarded. The image patches were pooled into 3 different folders, and the data were split into 3 sets: training set (70%) for training the network, validation set (10%) for testing its performance during training, and test set (20%) used after training to assess how well the network performed on new data. Grad-CAM analysis was used as an explainable AI method to visualize which areas of the input image were most important for model prediction and image classification. The methodology was performed as previously described in our previous publications [78,173,184]. All analyses were performed using a desktop equipped with an AMD Ryzen 9 5900X 12-Core Processor 3.70 GHz (Advanced Micro Devices, Inc., Osaki, Shinagawa-ku, Tokyo 141-0032, Japan), 48.0 GB of RAM, an NVIDIA GeForce RTX 4080 SUPER (16 GB) GPU (NVIDIA, Santa Clara, CA 95051, USA), and MATLAB R2023b Update 10 (23.2.0.2859533) 64-bit (win64) 27 January 2025 (MathWorks, Natick, MA 01760-2098, USA).
In the confusion matrix, the image patches were recorded as true positive (TP), false positive (FP), false negative (FN), and true negative (TN). The accuracy performance parameter was calculated as follows: accuracy = (TP + TN)/(TP + TN + FP + FN).
The relevant code functions were as follows: [imdsTrain, imdsVal, imdsTest] = splitEachLabel(imds, 0.7, 0.1, “randomized”); imdsTrain = shuffle(imdsTrain); YPred = classify(trainedNetwork_1, imdsTestAug); accuracy = sum(YPred == imdsTest.Labels)/length(YPred); scores = predict(trainedNetwork_1, imdsTestAug); confusionchart(YPred, imdsTest.Labels); wronglyPredicted = find(YPred~= imdsTest.Labels); imdsTest.Files{wronglyPredicted}
2.4. Gene Expression Analysis
A suitable independent series of celiac disease was searched in the Gene Expression Omnibus database, and the public dataset published by Dr Worf J et al. [186] was selected. This dataset includes transcriptome analysis of 48 duodenal biopsies of 26 children and adolescents diagnosed with celiac disease and 22 children without celiac disease as controls. Frozen tissue biopsies were obtained, and total RNA was extracted using a Qiagen AllPrep^®^ DNA/RNA Microkit (Qiagen Inc., Santa Clarita, CA 91355, USA). Gene expression was assessed using the Illumina HumanHT-12 v4.0 beadchip [186] (Illumina Inc., Sand Diego, CA 92122 USA).
Gene set enrichment analysis (GSEA) was performed using GSEA software version 4.4.0 (build 18) from Broad Institute, Inc. (Merkin Building, 415 Main St., Cambridge, MA 02142, USA). The analysis procedure was as previously described [77]. STRING version 12.0 (SIB, Swiss Institute of Bioinformatics; CPR, Novo Nordisk Foundation Center Protein Research; University of Copenhagen, Blegdamsvej 3B, DK-2200 Copenhagen N, Denmark); and EMBL, European Molecular Biology Laboratory; EMBL Hamburg, c/o DESY, Building 25A Notkestraße 8522607 Hamburg, Germany) were used for the functional network association analysis [187].
2.5. Statistical Analyses
All statistical analyses were performed using IBM SPSS version 27.0.1.0 (64-bit edition; IBM Corporation, Armonk, New York, NY, USA). Comparison between groups was performed using crosstabulation and chi-square test and the Mann–Whitney U nonparametric test. Spearman’s rho test was used to determine nonparametric correlations between genes. p-values ≤ 0.05 were considered statistically significant.
3. Results
3.1. Immunophenotype of IELs in Intestinal Mucosa Control
IELs were defined as lymphoid cells within the mucosal epithelial layer. CD3 staining was used as a reference. Under control physiological conditions, IELs were characterized by a T-cell phenotype that is positive for CD3 and a cytotoxic phenotype with CD8 expression. Cytotoxic granules were occasionally identified by granzyme B staining. Most IELs were positive for CD103/ITGAE. Most IELs expressed TCRβ chains; therefore, they expressed the TCRαβ chains. CD56 + IELs, TCRδ chain + IELs (i.e., TCRγδ + IELs), and TOX2 + IELs were occasionally found. Notably, all IELs were LAIR1-positive by immunohistochemistry.
Abundant CD163 + macrophages/dendritic cells were found in the lamina propria, which also expressed HLA-DP-DQ. CD4 + cells were mainly found in the lamina propria; however, clusters attached below the epithelial basal membrane were found. BTLA + cells were found in the lamina propria, which is consistent with our previous results [77]. PD-L1 expression was limited to the lamina propria in a pattern compatible with APC (macrophages, dendritic cells). Regulatory T-lymphocytes were identified in the lamina propria using the FOXP3 marker. Table 4 summarizes the findings. Characteristic images are shown in Figure 4, Figure 5, Figure 6 and Figure 7. Figure 8 confirms that the IELs are CD3 and LAIR1 double-positive using confocal microscopy. Notably, LAIR1 staining revealed that many cells of the lamina propria were LAIR1-positive (Figure 5, Figure 6, Figure 7, Figure 8, Figure 9, Figure 10, Figure 11 and Figure 12) (Table 6).
3.2. Multicolor Analysis of LAIR1 and Other Immune Markers
We performed quadruple and triple immunofluorescence analyses using confocal microscopy. The combinations that also included nuclear staining were as follows: PD1 (cyan), CD163 (green), and LAIR1 (red); and CD4 (green), CD8 (cyan), and LAIR1 (red).
In the human mucosa, CD4-positive, and probably, CD8-positive cells, were positive for LAIR1. PD1-positive cells also expressed LAIR1. CD163-positive cells (M2-like macrophages) were partially positive for LAIR1 in the interfollicular area and/or lamina propria. Mantle zone B-lymphocytes were LAIR1-positive but not in the germinal centers (Figure 11).
3.3. Analysis of LAIR1 Expression in Patients with Celiac Disease
Table 7 shows the distribution of cases according to the Marsh histological classification. In celiac disease, Marsh 0-2 accounted for 31.3%, and Marsh 3 for 68.7% of the cases. As expected, celiac disease cases had higher values in the Marsh classification (p < 0.001).
The protein expression of LAIR1 using immunohistochemistry was evaluated in the celiac disease biopsies. LAIR1 was expressed in the IELs but also in the inflammatory infiltrate of the lamina propria, and the distribution of LAIR1 + IELs was heterogeneous within and between biopsies.
LAIR1 expression in the mucosa control was low (1+) in 6/18 (33.3%) or intermediate (2+) in 12/18 (66.7%). In celiac disease, LAIR1 expression ranged from low (1+, 1/16, 6.3%), intermediate (2+, 8/16, 50%), and high (3+, 7/16, 43.8%). Therefore, celiac disease was characterized by higher LAIR1 expression (p = 0.004) (Table 8).
The histological features of celiac disease ranged from mild alteration with increased IELs to severe atrophy with loss of villi, high epithelial apoptosis, and crypt hyperplasia. Table 9 shows the correlation between Marsh histological classification and LAIR1. Higher histological lesions were correlated with higher LAIR1 expression (p < 0.001).
3.4. Image Classification of Celiac Disease, Small Intestine Control, and Reactive Tonsil Control Based on LAIR1 Immunohistochemical Expression
Images of LAIR1 protein expression analyzed by immunohistochemistry in celiac disease, small intestine control, and reactive tonsils were used as input data in a ResNet18 model [185] (Figure 13).
The ResNet18 model comprises 18 layers, including convolutional layers and residual blocks [188,189,190]. The series included 11,367 image patches of celiac disease, 11,630 of the small intestine control, and 8147 of the reactive tonsil control. The image patches were pooled into three different folders, and the data were split into three sets: training set (70%) for training the network, validation set (10%) for testing its performance during training, and test set (20%) used after training to assess how well the network performed on new data.
After five epochs in the training, the validation accuracy was 99.5%. After image patch classification using the test (holdout) series, the accuracy was 99.6%. The confusion matrix shows the distribution of image patches, including correctly and misclassified patches (Supplementary Data). The Grad-CAM technique was used to understand why the deep learning network made its classification decisions in incorrectly classified cases (Figure 14 and Figure 15).
3.5. Analysis of LAIR1 in Celiac Disease Using Gene Expression Data
A suitable independent series of celiac disease was used to validate the findings of LAIR1 at the gene expression level. A functional network association analysis approach was used to define the LAIR1 pathway. The result of the network analysis is shown in Figure 16A: in the network (i.e., the LAIR1 pathway), the partners are shown and are classified in different colors according to their immunoregulatory interactions, adaptive immunity, and MHC class I inhibitory function. Functional enrichment visualization confirmed the immunoregulatory function of LAIR1 and its partners (Figure 16B), and the association (i.e., enrichment, upregulation) of the LAIR1 pathway in patients with celiac disease was confirmed in the gene set enrichment analysis (GSEA) (Figure 16(C.1)). The enrichment of autoimmune and human inflammation-associated genes was also confirmed by GSEA (Figure 16(C.2,C.3)). Of note, both network analysis and GSEA highlighted the BTLA marker (Figure 16(A,C.1)). BTLA was close to LAIR1 in the network, and in the GSEA, BTLA was found within the core enrichment.
Our study results showed that LAIR1 identified CD163+ cells in the lamina propria (Section 3.2, Figure 10). By gene expression, LAIR1 correlated with CD68, a pan-macrophage marker (Figure 17A).
BTLA was further analyzed, and gene expression levels were confirmed to be overexpressed in celiac disease (p < 0.001) (Figure 17B). At the protein level in our series, high BTLA expression was confirmed in celiac disease cases (p = 0.036) (Figure 17B,C).
4. Discussion
Celiac disease is a gluten-sensitive enteropathy and common immune-mediated inflammatory condition of the small intestine caused by sensitivity to dietary gluten and related proteins in genetically predisposed individuals [191]. In Western countries, celiac disease is estimated to affect approximately 1% of the population. Celiac disease clinically presents as heterogeneous; therefore, it continues to be underestimated [191].
There are several phenotypes of celiac disease. Symptomatic diseases include classic and nonclassic celiac diseases. Classic celiac disease is a gluten-sensitive enteropathy characterized by diarrhea, signs and symptoms of malabsorption, villous atrophy, and resolution upon withdrawal from gluten-containing foods [79]. Nonclassic celiac disease is also known as “atypical”, and these patients lack the classic symptoms of malabsorption and only present with minor gastrointestinal complaints. However, duodenal biopsies show villous atrophy, the production of celiac autoantibodies, such as anti-tissue transglutaminase, and extraintestinal manifestations [123,192].
The other phenotypes include subclinical or asymptomatic, potential, latent, and refractory celiac disease. Refractory celiac disease is defined as the persistence of clinical symptoms and villous atrophy despite adherence to a gluten-free diet. Failure to improve on a gluten-free diet is mostly due to noncompliance. However, in few cases, a pure refractory condition is found: refractory celiac disease type 1 (normal population of IELs), the semi-malignant inflammatory condition (refractory type 2; aberrant immunophenotype and T-cell receptor clonality analysis of IELs), transformation to enteropathy-associated T-cell lymphoma (EATL), collagenous sprue, or alternative diagnosis of autoimmune enteropathy [126,127,193].
The cause of refractory disease is unknown, and immunosuppression has been the treatment of choice. Traditional glucocorticoids, such as intravenous hydrocortisone and oral prednisolone, are used. Alternative immunosuppressant therapies include azathioprine, 6-mercaptopurine, and thioguanine [126,194,195,196,197]. A monoclonal antibody therapy using anti-CD52 (alemtuzumab) was reported [198].
Badran YR et al. reported eight cases of immune checkpoint inhibitor-associated celiac disease, suggesting that the drugs disrupted gut immune homeostasis and the gut immune tolerance mechanism [199]. In that study, immunohistochemical analysis of several markers included CD3, CD8, TCRγδ, PD1, CD68, PD-L1, and quantification of IELs [199]. In our study, we analyzed several immuno-oncology markers in a small intestine control and, later, LAIR1 expression in celiac disease. Our findings showed that in the small intestine, LAIR1 expression is found not only in IELs but also in lamina propria immune cells. LAIR1 was diffusely expressed in celiac disease.
LAIR1 belongs to the family of immune-inhibitory receptors and is expressed by mature hematopoietic cells, particularly in natural killer (NK) and T/B-lymphocyte immune cells [198]. Beyond the physiological function of immune homeostasis and immune tolerance, LAIR1 has been involved in several autoimmune and inflammatory conditions and neoplasia [156], including allergy [200], systemic lupus erythematosus [201], rheumatoid arthritis [175,202,203], graft rejection [204], breast carcinoma [205], glioma [206], solid tumors [207], and hepatocellular carcinoma [208], among others.
We recently demonstrated the usefulness of using deep learning to analyze gene expression and classify images of celiac disease [77,78] and ulcerative colitis [173,184,209]. In this study, deep learning was used to classify LAIR1 image patches between celiac disease, small intestine control, and reactive tonsils. The proposed network managed to classify images with good performance. However, the aim was to conduct a proof-of-concept analysis, not to create a trained network production or commercial applications. Narrow artificial intelligence is not ready to take over the job of pathology-trained medical doctors because histological biopsies obtained from endoscopic examinations may be associated with other diseases. Notably, other research groups, such as Denholm et al., Molder et al., Scheppach et al., and Schreiber et al. (among others), have successfully used deep learning in celiac disease [210,211,212,213,214,215,216,217].
This study analyzed the phenotype of intraepithelial lymphocytes (IELs) and the lamina propria in the small intestine, including LAIR1, and confirmed LAIR1 expression in celiac disease. In celiac disease, both IELs and lamina propria cells were positive for LAIR1. Compared with the small intestine control, the lamina propria infiltration in celiac disease was higher. Finally, as a proof-of-concept AI analysis, a convolutional neural network classified LAIR1-stained image patches between the three diagnoses of small intestine control, celiac disease, and reactive tonsils with high accuracy. Therefore, IELs are positive for LAIR1. The LAIR1 marker is relevant in intestinal mucosa immunology and celiac disease.
Of note, one clinical trial targeting LAIR1 is listed on the website of clinicaltrials.gov (last accessed on 31 July 2025): A Safety, Tolerability and Efficacy Study of NC525 in Subjects With Advanced Myeloid Neoplasms (Id. NCT05787496, NextCure, Inc., drug NC525, Monoclonal antibody specific for LAIR-1) (NextCure, Inc., Beltsville, MD 20705, USA).
5. Conclusions
This study used several immuno-oncology and immune-phenotype markers to characterize the intraepithelial lymphocytes and the lamina propria of a small intestine control and to confirm the expression of LAIR1 in celiac disease. In small intestine mucosa control, IELs exhibited a cytotoxic T-cell phenotype and were CD3+, CD8+, CD103+, TCRβ+, and LAIR1+. In celiac disease, both IELs and many lamina propria cells were LAIR1-positive. In comparison to the small intestine control, LAIR1 lamina propria infiltration in celiac disease was higher. This study also successfully performed a proof-of-concept deep learning histological analysis of LAIR1 between the small intestine control, celiac disease, and reactive tonsils. A convolutional neural network classified LAIR1-stained image patches between the three diagnoses of small intestine control, celiac disease, and reactive tonsils with high accuracy (99.6%).
In conclusion, IELs are LAIR1+. High LAIR1 expression in IELs and lamina propria immune cells characterize CD.
The reference list from the paper itself. Each links out to its DOI / PubMed record.
- 1Kong S. Zhang Y.H. Zhang W. Regulation of Intestinal Epithelial Cells Properties and Functions by Amino Acids Biomed. Res. Int.20182018281915410.1155/2018/281915429854738 PMC 5966675 · doi ↗ · pubmed ↗
- 2Yang E. Shen J. The roles and functions of Paneth cells in Crohn’s disease: A critical review Cell Prolif.202154 e 1295810.1111/cpr.1295833174662 PMC 7791172 · doi ↗ · pubmed ↗
- 3Gustafsson J.K. Johansson M.E.V. The role of goblet cells and mucus in intestinal homeostasis Nat. Rev. Gastroenterol. Hepatol.20221978580310.1038/s 41575-022-00675-x 36097076 · doi ↗ · pubmed ↗
- 4Atanga R. Singh V. In J.G. Intestinal Enteroendocrine Cells: Present and Future Druggable Targets Int. J. Mol. Sci.202324883610.3390/ijms 2410883637240181 PMC 10218851 · doi ↗ · pubmed ↗
- 5Kanova M. Kohout P. Serotonin-Its Synthesis and Roles in the Healthy and the Critically Ill Int. J. Mol. Sci.202122483710.3390/ijms 2209483734063611 PMC 8124334 · doi ↗ · pubmed ↗
- 6Pithadia A.B. Jain S.M. 5-Hydroxytryptamine Receptor Subtypes and their Modulators with Therapeutic Potentials J. Clin. Med. Res.20091728010.4021/jocmr 2009.05.123722505971 PMC 3318857 · doi ↗ · pubmed ↗
- 7Shajib M.S. Khan W.I. The role of serotonin and its receptors in activation of immune responses and inflammation Acta Physiol.201521356157410.1111/apha.1243025439045 · doi ↗ · pubmed ↗
- 8Drucker D.J. Mechanisms of Action and Therapeutic Application of Glucagon-like Peptide-1Cell Metab.20182774075610.1016/j.cmet.2018.03.00129617641 · doi ↗ · pubmed ↗