Hologenomics Reveals Specialized Dietary Adaptations in the Mengla Snail‐Eating Snake
Chaochao Yan, Xin‐Ning Li, Zhong‐Liang Peng, Wei Wu, Zeng Wang, Zhao‐Ran Zhu, Jia‐Chang Liu, Yao Wang, Jin‐Long Ren, Zhi‐Yi Zhang, Jia‐Tang Li

TL;DR
The study explores how the Mengla snail-eating snake evolved specialized adaptations for snail consumption through genomic and microbial changes.
Contribution
The research reveals how genomic and microbial interactions drive dietary specialization in a non-mammalian species.
Findings
The snake evolved infralabial glands secreting toxins and digestive enzymes to aid in snail predation and digestion.
Adaptive evolution in the host genome and gut microbiota addresses nutritional and digestive challenges of snail consumption.
Functional convergence in microbial gene functions is observed between reptiles and mammals, suggesting parallel evolutionary pathways.
Abstract
Serpents, as highly adaptable vertebrates, provide robust models for studying the mechanisms of dietary specialization. Using an integrative multi‐omics approach, encompassing host genomic, transcriptomic, proteomic, gut metagenomic, and enzymatic analyses, the mechanisms underlying dietary adaptations in the Mengla snail‐eating snake (Pareas menglaensis), a species specialized in consuming snails is investigated. Adaptations supporting this diet included evolution of infralabial glands secreting toxin homologs and digestive enzymes, facilitating molluscan predation and digestion. This specialization has driven adaptive evolution in the host genome and shaped the gut microbiota, addressing both nutritional challenges (e.g., lipid deficiency) and digestive requirements (e.g., mucus degradation) associated with snail consumption. Notably, the functional convergence in microbial gene…
Genes, proteins, chemicals, diseases, species, mutations and cell lines named across the full text — each resolved to its canonical identifier and authoritative record.
Click any figure to enlarge with its caption.
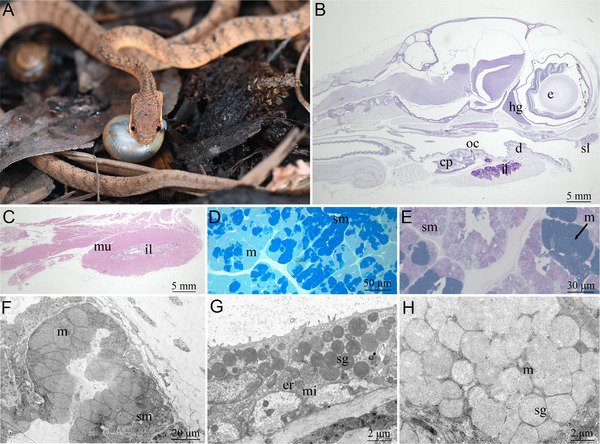 Figure 1
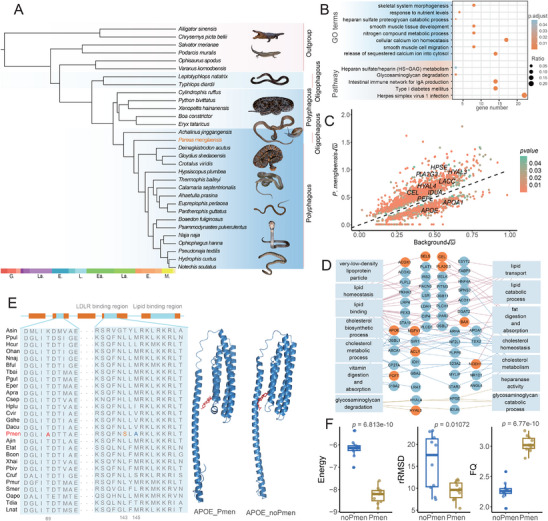 Figure 2
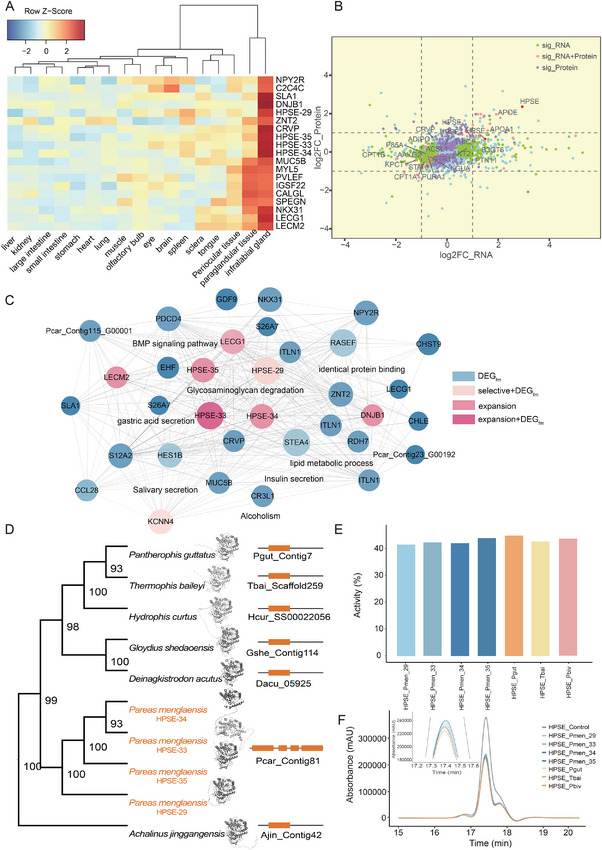 Figure 3
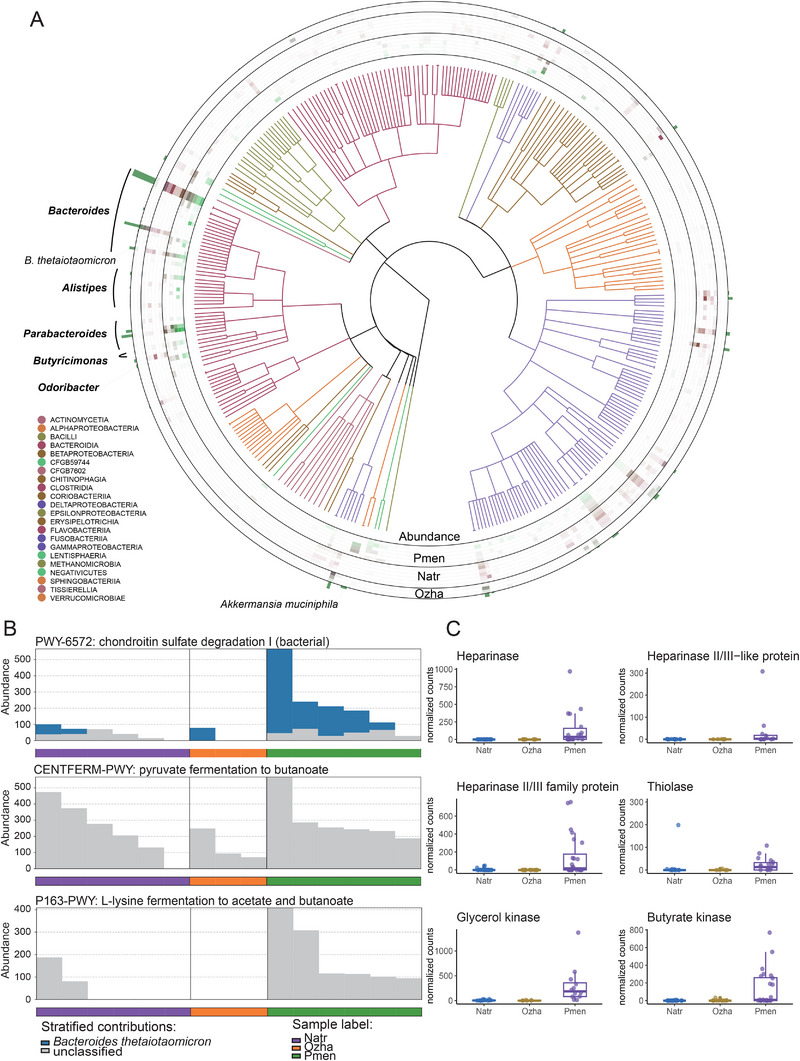 Figure 4
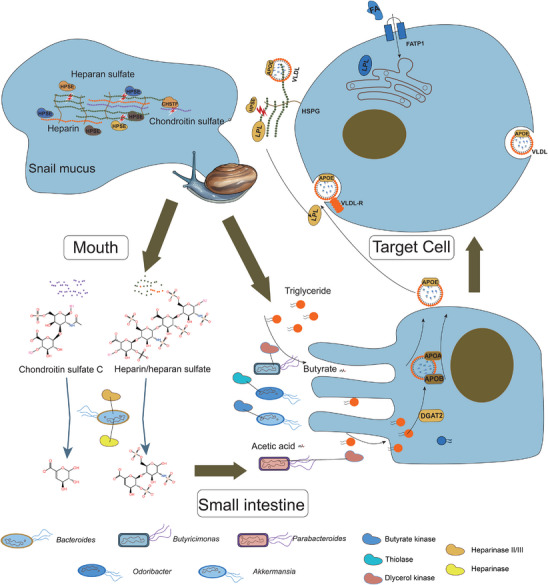 Figure 5
- —Sichuan Science and Technology Program
- —National Natural Science Foundation of China10.13039/501100001809
Peer Reviews
No public reviews on file for this paper yet. If you reviewed it on a platform where reviews are public (OpenReview, ICLR, NeurIPS, ICML), you can paste yours below so the community can read it here.
Videos
No videos yet. Explain this paper in a talk, walkthrough, or lecture? Add one.
Taxonomy
TopicsAmphibian and Reptile Biology · Genomics and Phylogenetic Studies · Aquaculture disease management and microbiota
Introduction
1
Dietary shifts have profoundly influenced species radiation into new ecological niches, driving both physiological and morphological adaptations.^[^ 1, 2 ^]^ Although research on dietary specialization and its genetic underpinnings has primarily focused on mammals,^[^ 1, 2, 3 ^]^ serpents also exhibit considerable dietary adaptability, with diverse strategies ranging from polyphagy to oligophagy, including specializations in crustacean‐eating, egg‐eating, and ant‐eating.^[^ 4, 5, 6, 7 ^]^ Within this context, Pareas, a unique snake lineage that feeds exclusively on terrestrial mollusks, such as snails and slugs (Figure 1A), serves as an ideal model for studying the genetic mechanisms underlying dietary specialization.
Histomorphology of specialized infralabial gland in Pareas menglaensis. A) Pareas menglaensis preying on a snail. B) Parasagittal plane of head stained with hematoxylin & eosin, showing location of hypertrophied infralabial gland. Scale bar = 5 mm. C) Parasagittal plane of mandible, showing entire infralabial gland wrapped by muscle. Scale bar = 5 mm. D) Enlarged tissue section of infralabial gland, showing seromucous cells with a stronger positive response to Coomassie brilliant blue R250. E) Infralabial gland, showing seromucous cells with a positive response to periodic acid‐Schiff (PAS) and mucous cells with a positive response to Alcian blue, pH 2.5. Scale bar = 30 µm. F) Ultrastructure of acinus in the infralabial gland, revealing cells with secretory granules of different electron densities. Scale bar = 20 µm. G) Seromucous cells with highly electron‐dense, variably‐sized secretory granules inside. Scale bar = 2 µm. H) Mucous cells with homogeneous, moderately electron‐dense secretory granules inside. Scale bar = 2 µm. e, eye; hg, Harderian gland; oc, oral cavity; sl, supralabial gland; cp, compound bone; il, infralabial gland; d, dentary bone; mu, muscle; sm, seromucous cells; m, mucous cells; sg, secretory granules; mi, mitochondria; er, endoplasmic reticulum.
Long‐term adaptations to specialized diets can induce distinct genetic modifications within organisms. For instance, the low‐nutrient, high‐fiber bamboo diet of the giant panda (Ailuropoda melanoleuca) has driven the pseudogenization of the umami taste receptor gene TAS1R1 and positive selection of protein digestion‐related genes, such as PRSS1, PRSS36, and CPB1, thus enhancing digestion and nutrient absorption efficiency.^[^ 2 ^]^ Similarly, the loss of certain genes, such as ERN2, CTRL, and REP15, in vampire bats has been linked to adaptations for blood feeding, addressing nutrient composition biases inherent to hematophagy.^[^ 3 ^]^ Likewise, mollusk‐exclusive feeding presents two primary challenges for pareid snakes. First, snails secrete substantial amounts of glycosaminoglycan‐rich mucus (e.g., heparan sulfate/heparin, dermatan sulfate, and chondroitin sulfate) when threatened, which can obstruct the trachea and impede respiration.^[^ 8 ^]^ Second, the nutrient profile of snails, particularly low lipid content,^[^ 9 ^]^ complicates energy storage and cellular function. Recent studies suggest that certain Pareas species have evolved hypertrophied infralabial glands in their lower jaw that produce secretions facilitating mollusk digestion, representing a unique adaptation to their specialized diet.^[^ 10 ^]^ While morphological adaptations associated with snail consumption in Pareas have been minimally documented, the genetic basis for this dietary specialization remains largely unexplored.
Dietary specializations are frequently linked to changes in host‐associated microbiomes, where interactions between host genomes and microbiomes (i.e., “hologenomes”) play an integral role in these adaptations.^[^ 1, 11 ^]^ The vampire bat exemplifies co‐evolutionary adaptation, having specialized to consume a blood‐based diet, characterized by high protein content, low carbohydrates, and inherent pathogen exposure. This dietary shift drove substantial changes in both its genome and gut microbiome,^[^ 11 ^]^ with considerable gastrointestinal tract enrichment with commensals containing urea metabolism‐related genes (e.g., ureA) and potentially protective bacteria (e.g., Amycolatopsis), enhancing nitrogen metabolism and pathogen resistance.^[^ 11 ^]^ Similarly, the Malayan pangolin has developed specific dietary adaptations to an exclusive ant‐ and termite‐based diet, which is high in chitin.^[^ 1 ^]^ This adaptation is marked by the up‐regulation of the acidic mammalian chitinase gene, facilitating efficient chitin breakdown,^[^ 12 ^]^ along with gut microbiome enrichment with microorganisms expressing TREH, which aids in the digestion of trehalose, a product of chitin degradation.^[^ 1 ^]^ However, whether specific adaptations in gut microbiomes accompany genetic changes in pareid snakes, and how the hologenome supports dietary specialization, have not yet been clarified.
This study employed an integrative multi‐omics approach, combining host genomic, transcriptomic, proteomic, and gut metagenomic data, alongside assays validating key enzyme activities, to elucidate the hologenomic mechanisms underlying dietary specialization in the Mengla snail‐eating snake (Pareas menglaensis). Analysis revealed various genes under species‐specific selection, including genes involved in glycosaminoglycan and lipid metabolism, which facilitate snail digestion and nutrient utilization. Additionally, complex and diverse interactions between the host and its symbiotic microbiota were identified, highlighting adaptive responses to mucus digestion and the nutritional constraints of a low‐lipid diet. Overall, this study advances our understanding of the genetic foundations of dietary specialization and provides novel insights into the coordination of physiological functions through host‐symbiont interactions.
Results
2
Histomorphology of Specialized Infralabial Gland in P. Menglaensis
2.1
Tissue analysis revealed a hypertrophied infralabial gland in the lower jaw of P. menglaensis (Figure 1A). The gland, extending from the anterior tip of the dentary to the front of the compound bone, was attached to the mandible and encased in muscle tissue (Figure 1B,C). The gland was primarily composed of mucous cells (m) and seromucous cells (sm), organized into acinar lobules of varying sizes (Figure 1D,E). Seromucous cells, in contrast to mucous cells, demonstrated positive staining with PAS and Coomassie Brilliant Blue R250, whereas mucous cells showed a marked positive reaction to Alcian blue at pH 2.5, indicating differential cytoplasmic composition between the two cell types (Figure 1D,E).
Ultrastructural analysis provides precise insights into the subcellular architecture of secretory cells, where elevated electron density within secretory granules reflects high protein content.^[^ 13, 14 ^]^ Examination of the infralabial gland in P. menglaensis revealed that acinar cells contained secretory granules exhibiting varying electron densities (Figure 1F). Seromucous cells displayed highly electron‐dense, variably‐sized secretory granules (Figure 1G) and a cytoplasm rich in organelles associated with protein synthesis and secretion, including mitochondria and rough endoplasmic reticulum (Figure 1G). In contrast, mucous cells were characterized by homogeneous, uniformly sized, moderately electron‐dense secretory granules (Figure 1H).
Dietary Adaptations cause Genetic Changes in P.Menglaensis
2.2
A comparative analysis involving genomic data from 31 reptile species, including P. menglaensis, was conducted to investigate genetic changes associated with its specialized snail‐eating behavior (Figure 2A; Figure S1, Supporting Information). Genomic data for P. menglaensis were obtained from Peng et al. (2023)^[^ 15 ^]^ and Wang et al. (2023)^[^ 16 ^]^ (Table S1, Supporting Information). This analysis identified 64 gene families with significant expansions unique to P. menglaensis (Table S2, Supporting Information). Functional enrichment analysis revealed that the most significantly enriched functions (i.e., lowest p‐values) among the expanded genes were associated with immune responses, particularly against infections of orofacial mucosal surfaces, such as herpes simplex virus 1, and with the modulation of cellular calcium ion levels. These genes were also significantly enriched in pathways related to glycosaminoglycan degradation, especially heparan sulfate/heparin metabolism (R‐MMU‐1638091), in which heparanase (HPSE) plays a central role. Furthermore, notable gene family expansions were detected in categories related to nutrient sensing (e.g., INS) and skeletal system morphogenesis (GO:0031667 and GO:0048705) (Figure 2B, Table S3, Supporting Information). In contrast, contractions were identified in gene families associated with key physiological functions, including TRIM family members involved in hepatic lipid metabolism and insulin sensitivity,^[^ 17, 18 ^]^ olfactory receptor genes linked to fatty acid oxidation and hormone‐sensitive lipase activation,^[^ 19, 20 ^]^ and some other immune‐related genes (Table S4, Supporting Information).
Comparative genomic analysis of Pareas menglaensis and non‐snail‐eating reptiles. A) Phylogenetic tree of 31 species analyzed in this study, with dietary classifications (oligophagy or polyphagy) labeled on the right. Timescale bar at the bottom shows divergence time. B) Significantly enriched Gene Ontology (GO) terms (blue) and pathways (red) associated with expanded genes. Bubble size represents the number of genes in a certain category divided by the total number of annotations for the corresponding term. Color indicates adjusted p‐values. C) Scatter plot of ω values for P. menglaensis genes compared to background genes, highlighting genes with accelerated molecular evolution (i.e., rapidly evolving genes, REGs) in P. menglaensis. Color indicates the significance of differences in evolutionary rates. D) Functional enrichment analysis of REGs, represented by filled blue circles, with REGs under positive selection shown as filled orange circles. Colored lines depict relationships between genes and their metabolic functions: red for lipid metabolism, blue for cholesterol metabolism, yellow for glycosaminoglycan degradation and absorption. E) Sequence alignment showing three P. menglaensis‐specific amino acid substitutions (in different colors) in APOE. Orange bars indicate α‐helix of APOE, blue bars indicate structural‐functional domains. 3D models of APOEs from P. menglaensis (Pmen) and other snakes (noPmen) docking with cholesterol are displayed on the right. F) Boxplots showing differences in binding models between APOEs from P. menglaensis and other snakes, with each model subjected to 10 docking simulations. P‐values were calculated using two‐sided Student's t‐test and are presented above each plot. RMSD, root mean square deviation; FQ, fit quality. The whiskers indicate 1.5 times of the interquartile range.
In P. menglaensis, genomic analyses identified 1846 rapidly evolving genes (REGs; Figure 2C and Table S5, Supporting Information) and 963 positively selected genes (PSGs; Table S6, Supporting Information), reflecting widespread signatures of adaptive evolution. These genes were significantly enriched in glycosaminoglycan metabolism (e.g., GO:0015012, GO:0030206, GO:0030201, and hsa00531) and lipid metabolism (e.g., GO:0006629, GO:0033540, hsa00062, and hsa01212) (Figure 2D, Tables S7 and S8, Supporting Information), and included HPSE, IDUA, and HYAL4, which encode enzymes that hydrolyze heparan sulfate/heparin, dermatan sulfate, and chondroitin sulfate, respectively.^[^ 21, 22, 23 ^]^ Genes involved in lipid transport and processing, such as APOE, APOA1, PLA2G3, and CEL, also exhibited signatures of positive selection and/or accelerated evolution (Figure 2D). To validate these findings, an independent analysis was performed using the HyPhy platform. Consistently, APOE, PLA2G3, and CEL were again identified as PSGs (Table S9, Supporting Information) and APOE was again identified as a REG (Table S10, Supporting Information). HPSE, IDUA, and HYAL4 were also recovered as REGs in both analyses (Table S10, Supporting Information). HyPhy further revealed significant enrichment of PSGs in glycosaminoglycan metabolism (e.g., GO:0005539 and hsa00531) and lipid metabolism (e.g., GO:0033540 and hsa00062) (Table S11, Supporting Information), along with REGs enriched in lipid‐related functions (e.g., GO:0019216 and GO:0042159) (Table S12, Supporting Information).
Among the genes under natural selection in P. menglaensis, 1623 carried species‐specific amino acid substitutions, many of which were involved in lipid metabolism (Table S13, Supporting Information). Notably, APOE, a lipid metabolism‐related gene identified as both a PSG and REG, harbored P. menglaensis‐specific mutations (Table S14, Supporting Information). Given its critical role in coordinating lipid metabolism through binding triglycerides, glycosaminoglycans, and low‐density lipoprotein receptors (LDLRs), these mutations may contribute substantially to fat metabolism adaptations in this species.
Three P. menglaensis‐specific amino acid substitutions were identified in APOE across the species comparison. The threonine‐to‐alanine substitution at amino acid position 69 (T69A) was predicted to impact protein structure (PROVEAN score < −2.5), while two additional substitutions, L143S and V145A, were located within the LDLR‐binding domain, a functionally important region of the protein (Figure 2E; Figure S2, Supporting Information). To evaluate the functional impact of these substitutions, molecular docking simulations were performed to compare lipid‐binding affinity between APOE variants from P. menglaensis and other snakes. Notably, the P. menglaensis variant demonstrated markedly enhanced binding characteristics for lipids such as cholesterol, including increased stability and higher affinity (Figure 2F, Table S15, Supporting Information). These enhancements were supported by reduced binding free energy and improved fit quality (FQ). Consistent results were obtained using AlphaFold3, a platform for biomolecular interaction prediction, which indicated superior lipid‐binding stability for P. menglaensis APOE based on significantly elevated ptm and iptm model confidence scores (Figure S3, Supporting Information). To further resolve receptor interactions, AlphaFold3 was employed to model APOE‐LDLR interfaces. Although no significant difference in overall LDLR‐binding capacity was detected between P. menglaensis and other snakes, the optimal conformation of the P. menglaensis APOE‐LDLR complex displayed enhanced structural stability (Figure S3, Supporting Information).
Infralabial Gland‐Specific Gene Expression in P. Menglaensis
2.3
To identify the role of the infralabial gland in the dietary adaptation of P. menglaensis to snail consumption, pairwise tissue comparisons were conducted. High‐quality RNA sequencing (RNA‐seq) data were obtained from the transcriptomes of the infralabial gland and 16 other tissues. A total of 2830 genes were identified as differentially expressed in the infralabial gland (Figure 3A, Table S16, Supporting Information). These genes displayed significant enrichment in categories associated with glycosaminoglycan metabolism (e.g., hsa00531: glycosaminoglycan degradation, GO:0030207: chondroitin sulfate catabolic process and hsa00534: glycosaminoglycan biosynthesis – heparan sulfate/heparin), secretion of digestive juices (e.g., hsa04970: salivary secretion and hsa04971: gastric acid secretion), and lipid metabolism (e.g., hsa04975: fat digestion and absorption, hsa04979: cholesterol metabolism and hsa01212: fatty acid metabolism) (Table S17, Supporting Information). Among the differentially expressed genes, 15 originated from the 64 expanded gene families (Table S14, Supporting Information). Of these, nine were functionally annotated. Three corresponded to HPSE, which ranked among the most highly up‐regulated genes (Figure 3A). Two encoded C‐type lectin homologs (LECG1 and LECM2), one of which (LECG1) is originally identified in many‐banded krait venom and known to induce blood cell aggregation.^[^ 24 ^]^ Two DNJB1s, which encode members of the DnaJ/Hsp40 family that function as molecular chaperones, promoting protein folding and enhancing fatty acid oxidation to alleviate insulin resistance.^[^ 25 ^]^ One ZN135 encodes a zinc finger protein associated with regulation of cell morphology and cytoskeletal organization.^[^ 26 ^]^ The final annotated gene, CEAM3, is possibly involved in cell adhesion.^[^ 27 ^]^
Infralabial gland‐specific gene expression associated with dietary specialization. A) Heatmap of differentially expressed genes in infralabial gland compared to 16 other tissues, highlighting 19 genes with highest up‐regulation. Each tissue sample included at least three biological replicates. Raw counts were normalized, averaged, and transformed into Z‐scores. B) Scatter plot illustrating expression changes in infralabial gland at mRNA and protein levels before and after snail feeding (n ≥ 3). Genes with significant (adjusted p < 0.05) differential expression at the transcriptional level (sig_RNA), protein level (sig_Protein), or both (sig_RNA+Protein), are marked in green, purple, and pink, respectively. C) Co‐expression network of hub genes (dark blue) strongly positively correlated with infralabial gland in P. menglaensis, categorized by additional characteristics: DEGfm (light blue), differentially expressed hub genes in infralabial gland before and after feeding; selective + DEGfm (pink), positively selected or rapidly evolving in P. menglaensis; expansion (light magenta), expanded in P. menglaensis; expansion + DEGfm (magenta). D) Phylogenetic tree of HPSEs from P. menglaensis and other snakes, showing multiple copies of HPSE unique to P. menglaensis. Size of orange blocks on the right is proportional to the size of genes. E) Bar graph depicting comparable enzyme activities between four recombinant P. menglaensis HPSEs and three recombinant HPSEs from non‐snail‐eating snakes. Activity reflects the percentage of substrate hydrolyzed by each enzyme over a 4.5 h period. F) Chromatographic profiles of substrate degradation, illustrating differential reductions in peak areas among recombinant HPSEs. Colored traces correspond to active enzymes; gray traces denote heat‐inactivated controls.
Comparative transcriptomic and proteomic analyses of the infralabial gland before and after snail feeding identified 139 differentially expressed genes and 394 differentially expressed proteins (Tables S18 and S19, Supporting Information). Functional enrichment revealed significant overrepresentation of pathways related to glycosaminoglycan metabolism (hsa00532) and lipid metabolism (e.g., hsa04975 and hsa04979) (Tables S20 and S21, Supporting Information). Notably, HPSE, APOE, and APOA1 exhibited further up‐regulation at the protein levels, or at both the transcript and protein levels, in the infralabial gland following feeding (Figure 3B, Tables S18 and S19, Supporting Information).
Weighted gene co‐expression network analysis (WGCNA) identified modules of co‐expressed genes associated with the specialized function of the infralabial gland in P. menglaensis, many of which exhibited species‐specific evolutionary signals (Figure 3C; Figure S4, Tables S22 and S23, Supporting Information). Beyond the previously discussed expanded LECG1, LECM2, HPSE, and DNJB1 genes, additional genes showed signatures of positive selection or rapid evolution. Among them, MUC16, classified as both positively selected and rapidly evolving, encodes a membrane‐bound mucin implicated in the formation of protective lubricating barriers at mucosal surfaces to defend against particulate and pathogenic challenges (Table S14, Supporting Information).^[^ 28 ^]^
Given the species‐specific expansion, intact structural integrity and postprandial up‐regulation of HPSE variants in P. menglaensis (Figure 3D; Figures S5 and S6, Supporting Information), their enzymatic function was further assessed. Seven recombinant HPSE proteins, including four derived from P. menglaensis and three derived from non‐snail‐eating snakes (Pantherophis guttatus, Thermophis baileyi, and Python bivittatus), were expressed using a prokaryotic system and evaluated for their capacity to hydrolyze heparin sodium, a glycosaminoglycan substrate susceptible to cleavage by HPSE.^[^ 29, 30 ^]^ Gel permeation chromatography revealed that the P. menglaensis HPSE variants exhibited enzymatic activities comparable to those of HPSEs from non‐snail‐eating species (Figure 3E,F).
Gut Microbiomes Assist Snail Eating
2.4
As diet is recognized as the principal determinant of gut microbiome composition in snakes,^[^ 31 ^]^ the influence of dietary specialization in P. menglaensis was investigated through comparative metagenomic analysis. Gut metagenomes from six Mengla snail‐eating snakes were compared with those of two non‐snail‐eating species: the Chinese cobra (Naja atra) and Zhao's mountain stream snake (Opisthotropis zhaoermii). The gut microbiota of P. menglaensis exhibited greater intra‐species consistency and higher microbial diversity than those of the non‐snail‐eating snakes (Figure S7 and Table S24, Supporting Information). Among the 10 most abundant gut microbial taxa in P. menglaensis, Bacteroides was the most dominant genus, present in both comparator species (Figure 4A; Figure S8, Supporting Information), although species‐level composition varied (Figure 4A). Notably, B. thetaiotaomicron and B. fragilis predominated in P. menglaensis, whereas B. neonati and B. fragilis dominated in the non‐snail‐eating snakes (Figure S8, Supporting Information). Parabacteroides ranked second in abundance in P. menglaensis, while comprising only a minor fraction in O. zhaoermii (Figure 4A; Figure S8, Supporting Information). Additionally, Alistipes, Butyricimonas, and Odoribacter, though less abundant overall, were found to be dominant exclusively in P. menglaensis (Figure 4A; Figure S8, Supporting Information).
Adaptations of Pareas menglaensis gut microbiota for snail eating. A) Phylogeny of gut commensals detected in P. menglaensis and two non‐snail‐eating snakes. Bacteria from different classes are represented using different colors. From inner to outer rings, Circos plot shows the detected microbes, with specific microbe abundance in each sample represented by different colors (deeper color indicating higher abundance) and bars representing sum of microbial abundance in all samples. Dominant microbiota in P. menglaensis are denoted along the outer rim. B) Microbial pathways significantly (p < 0.05) enriched in gut symbionts with higher abundance in P. menglaensis (Pmen) compared to non‐snail‐eating snakes (Natr, Ozha). Bar charts show abundance of microbes in six P. menglaensis (green box), six Naja atra (purple box), and three Opisthotropis zhaoermii samples (orange box). C) Boxplots showing significant differences (adjusted p < 0.05) in abundance of six microbial genes associated with glycosaminoglycan or lipid metabolism among six P. menglaensis, six N. atra, and three O. zhaoermii individuals. P‐values were calculated using one‐sided Dunn's test with Benjamini‐Hochberg correction, following a significant Kruskal‐Wallis test. The whiskers indicate 1.5 times of the interquartile range.
These taxonomic differences in the composition of dominant gut microbes likely contributed to the observed functional divergence in gut microbiome activity across species (Figure 4B). Glycosaminoglycan degradation (PWY‐6572: chondroitin sulfate degradation I) was significantly enriched in the microbiota of P. menglaensis, driven primarily by the high abundance of B. thetaiotaomicron, which was the second‐most abundant Bacteroides species in P. menglaensis but only marginally represented in the other two snakes (Figure 4B; Figure S8 and Table S25, Supporting Information). Consistently, genes encoding enzymes responsible for heparin and heparan sulfate degradation (e.g., heparinase and heparinase II/III family proteins) exhibited markedly higher levels in P. menglaensis (Figure 4C, Table S26, Supporting Information).^[^ 32, 33 ^]^
In addition, several microbial pathways associated with short‐chain fatty acid (SCFA) production were significantly enriched, including P163‐PWY: L‐lysine fermentation to acetate and butanoate, CENTFERM‐PWY: pyruvate fermentation to butanoate (Figure 4B; Table S25, Supporting Information). In addition, P. menglaensis exhibited robust expression of lipid‐metabolizing microbial enzymes (Figure 4C, Table S26, Supporting Information), notably butyrate kinase and thiolase, which are involved in key steps of SCFA butyrate production,^[^ 34 ^]^ and glycerol kinase, a critical enzyme involved in triacylglycerol synthesis and lipid storage.^[^ 35 ^]^ In contrast, microbial pathways associated with lipid breakdown, including FAO‐PWY: fatty acid and beta‐oxidation I (generic) and PWY‐5138: fatty acid and beta‐oxidation IV (unsaturated, even number), were significantly enriched in non‐snail‐eating species (Figure S9 and Table S25, Supporting Information). This pattern may reflect the higher abundance of lipophilic bacterial taxa such as Aeromonas, Citrobacter, and Morganella in those species (Figure S8, Supporting Information).^[^ 36, 37, 38 ^]^ Correspondingly, microbial genes involved in lipid catabolism were also significantly more abundant in these snakes (Figure S9 and Table S26, Supporting Information).
Discussion
3
Although snakes exhibit a wide diversity of dietary habits, the genetic and physiological mechanisms underlying these adaptations remain largely underexplored. Their varied feeding habits make snakes an ideal model for studying dietary specialization. This study provides insight into the molecular and symbiotic adaptations supporting snail‐eating in an oligophagous snake species, focusing on genetic modifications in glycosaminoglycan and lipid metabolism and the complex interactions between host and gut symbionts that facilitate digestion and nutrient utilization.
Pareid snakes face considerable challenges when preying on snails, including extracting the body from the shell and digesting the substantial quantities of mucus secreted by the snail. To overcome these mechanical and physiological challenges, P. menglaensis has evolved specialized infralabial glands exhibiting high expression of multiple toxin homologs. These include SLA1, homologous to the agglutinin of the hundred‐pace snake; LECG1, homologous to a Bungarus‐derived C‐type lectin; and CRVP, homologous to the cysteine‐rich venom protein found in Lichtenstein's green racer. In venom systems, the agglutinin and C‐type lectin are known to promote erythrocyte aggregation,^[^ 24, 39 ^]^ while the cysteine‐rich venom proteins can hinder muscle contraction in prey.^[^ 40 ^]^ The expression of these toxin homologs in the infralabial gland may facilitate prey immobilization and prevent retraction into the shell, thereby enabling more efficient access to the snail body. However, direct functional validation of these putative roles is required in future studies.
Beyond these toxin homologs, additional genes expressed in the infralabial gland appear to have undergone adaptive changes to facilitate snail eating. For example, DNJB1, a DnaJ/Hsp40 family member, was expanded and may contribute to correct folding of glycosaminoglycan‐degrading enzymes such as HPSE. MUC16, which encodes a large mucin involved in mucosal barrier formation, showed evidence of both positive selection and accelerated evolution, suggesting an adaptive role in protecting oral tissues from abrasion during snail ingestion.
These genomic innovations were accompanied by functionally relevant gene family contractions, which may reflect trade‐offs associated with dietary specialization. Contraction of TRIM family genes—key regulators of lipid metabolism and insulin sensitivity—has been linked to metabolic dysregulation, including hepatic lipid accumulation and insulin resistance,^[^ 17, 18 ^]^ potentially constraining the ability of P. menglaensis to efficiently process high‐fat prey such as rodents. Similarly, contractions in olfactory receptor genes may impair lipid‐responsive pathways, including fatty acid oxidation and hormone‐sensitive lipase activation,^[^ 19, 20 ^]^ further reducing metabolic flexibility. In parallel, contraction of immune‐related genes may compromise the snake's capacity to manage diverse pathogens encountered in generalist diets. These converging constraints, including metabolic inefficiency, impaired lipid processing, and immune vulnerability, likely reinforce the narrow trophic niche of P. menglaensis, despite the availability of alternative prey in its environment.
Snail mucus, rich in glycosaminoglycans, presents a major biochemical obstacle to digestion due to its adhesive and protective properties (Figure 5).^[^ 41, 42 ^]^ Our results revealed a coordinated host‐microbiome interaction facilitating glycosaminoglycan breakdown. Genes associated with glycosaminoglycan metabolism were highly expressed in the infralabial gland of P. menglaensis, with many showing signs of rapid evolution (Figure 2 and Figure 3). In particular, HPSE underwent species‐specific expansion in P. menglaensis, with four functional paralogs expressed in the infralabial gland. Although enzymatic activity showed no significant differences compared to other snakes, this genomic expansion likely enhanced total enzymatic output through a gene dosage effect, enabling more efficient degradation of glycosaminoglycans. The postprandial up‐regulation of HPSE provided further evidence of its pivotal role in enabling efficient mucus degradation and facilitating dietary adaptation in P. menglaensis (Figure 5).
Hologenomic adaptation underlying dietary specialization in Pareas menglaensis. Adaptational changes in the snake genome and gut microbiota have provided solutions to challenges such as lipid shortages and mucus degradation encountered during snail consumption.
Additionally, P. menglaensis displayed a notably higher abundance of glycosaminoglycan‐degrading bacteria and increased abundance of glycosaminoglycan‐degrading enzymes in its gut microbiome compared to snakes with different dietary patterns (Figure 4 and Figure 5). Previous studies have shown that vampire bats primarily rely on Clostridium, Streptococcus, and Staphylococcus to degrade heparan sulfate, aiding in blood digestion. In P. menglaensis, however, neither Streptococcus nor Staphylococcus were present, and Clostridium showed low abundance. Interestingly, both vampire bats and Mengla snail‐eating snakes appear to employ heparinase II/III‐like or heparinase II/III family proteins produced by their gut symbionts for heparan sulfate degradation.^[^ 11 ^]^ This represents an intriguing example of convergent evolution across mammalian and reptilian lineages, where similar microbial functions have evolved to support comparable dietary requirements.
Our findings also highlight a coordinated interaction between the host genome and microbiome in nutrient utilization, enabling the Mengla snail‐eating snake to cope with the limited lipid content characteristic of a snail‐based diet. Snails are inherently low in lipid content,^[^ 9 ^]^ which likely drives the selection of genes involved in lipid metabolism within P. menglaensis. For example, APOE, a gene involved in the regulation of plasma and tissue lipid levels,^[^ 43, 44, 45 ^]^ was found to be under positive selection and harbored P. menglaensis‐specific mutations. These mutations conferred a distinct cholesterol‐binding profile, likely enhancing lipid‐binding capacity. Although mutations in the LDLR‐binding region of P. menglaensis APOE did not significantly alter binding affinity—possibly due to conformational flexibility introduced by extensive random coils in LDLRs during APOE‐LDLR interaction simulations—the optimal binding model suggested increased binding stability associated with the mutated APOE variant (Figure S3, Supporting Information). APOE also binds to cell surface glycosaminoglycans, such as heparin, which cooperate with LDLRs to mediate APOE‐bound lipid uptake. No mutations were observed at sites previously shown to be critical for APOE‐glycosaminoglycan interactions (Figure S10, Supporting Information).^[^ 46 ^]^ Overall, these results suggest that APOE mutations in P. menglaensis likely enhance lipid binding and improve lipid delivery to metabolically demanding tissues, while preserving the efficiency of glycosaminoglycan‐mediated uptake (Figure 5).
Possibly reflecting the low‐fat diet, gut microbes that favor high‐fat environments were significantly less abundant in P. menglaensis, as were microbial genes associated with lipid degradation (Figures S8 and S9, Supporting Information). However, taxa with beneficial metabolic functions were significantly enriched in response to the dietary limitations of snail consumption (Figure 4 and Figure 5). The low‐fat dietary context may promote the proliferation of Akkermansia muciniphila,^[^ 47 ^]^ a bacterium that degrades mucins to produce SCFAs that can be used as an energy source by the host.^[^ 48 ^]^ Its greater abundance in P. menglaensis relative to other snakes may confer metabolic advantages (Figure 4; Figure S8, Supporting Information). Butyricimonas, Odoribacter, and Parabacteroides, key producers of SCFAs, were observed at markedly higher abundances in P. menglaensis compared to other snakes (Figure 4; Figure S8, Supporting Information). Butyricimonas and Odoribacter primarily produce butyrate, a key regulator of energy homeostasis,^[^ 49, 50, 51 ^]^ while Parabacteroides predominantly secretes acetate, which supports host energy metabolism and alleviates inflammatory responses.^[^ 52 ^]^ The P. menglaensis gut microbiota likely utilize oligosaccharides derived from glycosaminoglycan degradation to sustain SCFA production as an energy source (Figure 5).^[^ 53, 54 ^]^ Furthermore, the significantly higher expression of microbial genes, such as butyrate kinase and thiolase, further suggests active SCFA production, particularly butyrate, within the intestines of P. menglaensis (Figure 4C; Table S26, Supporting Information). High expression of glycerol kinase may help compensate for the lipid deficiency inherent in a snail‐based diet by enhancing fatty acid utilization (Figure 5). Interestingly, enzymes involved in butyrate production and glycerol kinase are also enriched in the gut microbiota of the common vampire bat, thought to be important in energy storage.^[^ 11 ^]^ This parallel adaptation suggests convergent evolutionary strategies for managing nutrient scarcity between vampire bats and Mengla snail‐eating snakes, both of which rely on lipid‐poor diets.
Mengla snail‐eating snakes may also need to mitigate the accumulation of ammonia, a toxic byproduct of digesting protein‐rich snails.^[^ 55 ^]^ While uric acid typically serves as the primary nitrogenous waste in most reptiles, some species may increase urea excretion under higher protein intake.^[^ 56 ^]^ In this study, genes such as SLC14A2 and ASS1 exhibited rapid evolution in P. menglaensis, suggesting adaptations to its protein‐rich diet. These genes contribute to the urea cycle, which detoxifies ammonia by converting it to urea, thereby minimizing ammonia toxicity.^[^ 57, 58, 59 ^]^ Complementing this, Alistipes, a genus known for its ureolytic capacity,^[^ 60 ^]^ emerged as one of the most abundant bacterial symbionts in P. menglaensis (Figure 4; Figure S8, Supporting Information). However, unlike the common vampire bat, which relies on microbial urease for urea degradation, P. menglaensis did not exhibit elevated expression of microbial urease genes, possibly because urea is not its primary nitrogenous waste.^[^ 11 ^]^
Conclusion
4
Studies of dietary adaptations in animals through a holobiome perspective remain limited outside of mammals. This research highlights the integrative relationship between the genome and microbiome in driving dietary adaptations in the Mengla snail‐eating snake and presents evidence of functional convergence between mammals and reptiles in gut symbionts. Overall, these findings extend our understanding of dietary adaptation mechanisms across species and underscore the pivotal role of the hologenome in evolutionary processes.
Experimental Section
5
Ethics Approval
All experimental protocols were approved by the Animal Research and Ethics Committee of the Chengdu Institute of Biology, Chinese Academy of Sciences (CIBDWLL2023011).
Histomorphology of the P. Menglaensis Infralabial Gland
Histomorphological analysis was conducted following the methods of Wang et al. (2022).^[^ 10 ^]^ In brief, the snakes were euthanized via intraperitoneal injection of sodium thiopental (Table S27, Supporting Information). The entire head was severed at the first cervical vertebra and skinned, after which the infralabial glands were individually dissected for histological and histochemical analysis. The head section and one of the infralabial gland sections were stained using hematoxylin‐eosin staining for general observations. To differentiate secretory cell types, the remaining infralabial gland sections were subjected to Coomassie brilliant blue R250 staining, Alcian blue (AB) pH 2.5 staining, periodic acid‐Schiff (PAS) staining, or a combined PAS and AB reaction. All photomicrographs were obtained using a Cnoptec B302 microscope connected to a digital camera (Sony ICX285AQ CCD) and image acquisition software (ImageView). For ultrastructural observations, fresh tissue was cut into 1‐mm^3^ blocks, then fixed and embedded in resin (EMBed 812). Ultrathin sections (60–80 nm) were prepared using an ultramicrotome and observed under a transmission electron microscope.
Gene Family Analysis and Functional Enrichment
OrthoFinder v2.5.4 was used to identify multi‐copy and single‐copy gene families in P. menglaensis and other snake species with different feeding habits.^[^ 61, 62 ^]^ A maximum‐likelihood tree based on all single‐copy genes was reconstructed using IQTree v1.6.520^[^ 63 ^]^ with parameters: ‐nt 10 ‐st DNA ‐bb 1000 ‐alrt 1000. Based on the phylogeny, PAML v4.9i^[^ 64 ^]^ was utilized to detect positively selected genes (PSGs) and genes with high molecular evolutionary rates (REGs). RELAX^[^ 65 ^]^ and FEL model in HyPhy v2.5.48^[^ 66 ^]^ were used to validate the PSGs and REGs. CAFE v4.2.1^[^ 67 ^]^ was used to detect significantly expanded or contracted gene families.
The KOBAS v3.0.3^[^ 68 ^]^ database was used to assign Gene Ontology (GO) terms, Kyoto Encyclopedia of Genes and Genomes (KEGG) Orthology (KO) identifiers and Reactome pathway identifiers to each gene.^[^ 69, 70, 71 ^]^ GO and Reactome pathway enrichment analyses were conducted using the R package clusterProfiler v4.0.1,^[^ 72 ^]^ with GO and Reactome pathway terms showing a p < 0.05 considered significantly enriched. For KEGG enrichment analysis, KO identifiers were first mapped using the KEGG Mapper Reconstruct tool (https://www.genome.jp/kegg) as described in Yan et al. (2022).^[^ 73 ^]^ Counts of KO identifiers for foreground and background genes within each reconstructed pathway were then analyzed using a hypergeometric test, with KEGG pathways showing a p < 0.05 deemed significantly enriched.
Transcriptome Sequencing and Assembly
Six P. menglaensis individuals were euthanized via rapid decapitation and subsequently dissected (Table S27, Supporting Information). Various tissues were collected, including infralabial glands, paraglandular tissue, heart, muscle, liver, lung, kidney, brain, eyes, stomach, small intestine, large intestine, spleen, olfactory bulb, tongue, sclera, and periocular tissue, then flash‐frozen in liquid nitrogen and stored in a refrigerator at −80 °C. Total RNA was extracted from each sample using a QIAGEN RNA Mini Kit, followed by RNA quality assessment. cDNA libraries were constructed and sequenced on the Illumina NovaSeq 6000 platform in PE150 mode. Quality‐controlled RNA‐seq reads were aligned to the P. menglaensis genome using STAR v2.7.6a^[^ 74 ^]^ with the parameters: chimSegmentMin 2; outFilterMismatchNmax 3. Gene and transcript expression levels were quantified using RSEM v1.2.28.^[^ 75 ^]^
Seven additional snakes were assigned to two groups, each comprising at least three individuals (Table S28, Supporting Information). In one group, infralabial glands were sampled without prior feeding, while in the second group, infralabial glands were sampled within 30 min of feeding on snails. Differentially expressed genes (DEGs) between the two groups were identified using the methods described below, followed by functional enrichment analysis.
Analysis of DEGs
DESeq2 v1.34.0^[^ 76 ^]^ and edgeR v3.36.0^[^ 77 ^]^ were used for differential expression analysis to identify DEGs across tissue types. Genes with an adjusted p < 0.05 and a log2 fold change > 1 were classified as differentially expressed. Enrichment analysis of DEGs was performed using KOBAS v3.0.3 and clusterProfiler v4.0.1.
Correlation Analysis of Tissue Transcriptomes
Co‐expressed gene networks significantly correlated with specific tissue types were identified using the WGCNA package in R.^[^ 78 ^]^ Unsigned co‐expression networks were constructed using a selected soft threshold (power = 5). To identify modules of highly connected RNAs, similar networks were merged using the parameters: minModuleSize = 30, pamRespectsDendro = FALSE, mergeCutHeight = 0.25. Modules with a correlation coefficient > 0.90 and p < 0.05 for each tissue were selected for further analysis. Functional enrichment analysis of genes within these modules was performed as previously described. Hub genes within the co‐expression network were identified using Cytoscape v3.7.2^[^ 79 ^]^ based on degree centrality.
Comparative Proteomic Analysis of Infralabial Gland Before and After Snail Feeding
Proteomic profiling was conducted on the infralabial glands of the seven previously described snakes (Table S28, Supporting Information). Following sample isolation at 4 °C, tissues were dissected into small pieces after removal of blood, fat, and connective tissue. The processed samples were immediately frozen in liquid nitrogen and stored at −80 °C until further use. The frozen tissues were ground in liquid nitrogen and lysed using a lysis buffer with an ultrasonic processor. After centrifugation to remove cell debris, protein concentration was determined using a BCA Assay Kit.
Equal amounts of protein from each sample were reduced and alkylated with 5 mM dithiothreitol and 11 mM iodoacetamide, respectively, then subjected to trypsin digestion. An initial digestion was performed overnight at a trypsin‐to‐protein mass ratio of 1:50, followed by a second digestion for 4 h at a 1:100 mass ratio. The peptides were subsequently desalted using a C18 SPE column.
The digested samples were subjected to liquid chromatography‐tandem mass spectrometry (LC‐MS/MS). First, tryptic peptides were dissolved in solvent A (0.1% formic acid, 2% acetonitrile/in water) and loaded onto a home‐made reversed‐phase analytical column (25 cm length, 75/100 µm i.d.). Peptide separation was performed using the EASY‐nLC 1200 Ultra‐High Performance Liquid Chromatography system, with the following gradient: 0–14.5 min, 6%–22% solvent B; 14.5–17.5 min, 22%–34% solvent B: 17.5–19 min, 34%–80% solvent B: 19–20 min, 80% solvent B, at a constant flow rate of 700 nL min^−1^. The separated peptides were then analyzed using an Orbitrap Exploris 480 with a nano‐electrospray ion source, applying an electrospray voltage of 2 300 V. The FAIMS compensation voltage was set to −45 V. Precursors and fragments were detected at the Orbitrap, with a full MS scan resolution of 60 000 over a 350–1 400 m/z range. The MS/MS scans were acquired with a fixed first mass of 120.0 m z^−1^ at a resolution of 15 000. Higher‐energy collisional dissociation fragmentation was conducted using a normalized collision energy of 27%, with an automatic gain control target of 1 × 10^6^ and maximum injection time of 22 ms.
Subsequent analyses were conducted based on the raw MS data. The DIA‐NN search engine v1.8^[^ 80 ^]^ was utilized to match tandem mass spectra against all protein‐coding sequences annotated in the P. menglaensis genome, concatenated with the reverse decoy database. Trypsin/P was specified as the cleavage enzyme, allowing up to one missed cleavage, with N‐terminal Met excision and carbamidomethylation on Cys as fixed modifications, and a false discovery rate set to < 1%. Relative protein quantities from each group were averaged, and differentially expressed proteins between groups were identified using a t‐test, with the significance threshold set at p < 0.05. Functional enrichment analysis of differentially expressed proteins was performed using the methods previously described.
Identification of Species‐Specific Mutations of APOE
Previously identified single‐copy genes were analyzed to detect *P. menglaensis‐*specific mutations using custom Python scripts, and the functional impacts of these mutations were predicted using PROVEAN v1.1.5.^[^ 81 ^]^ Mutations with a PROVEAN score < −2.5 were predicted to affect protein function. The 3D structure of APOE was modeled using AlphaFold v2.0.0 with the CASP14 model.^[^ 82 ^]^ Pymol v2.6^[^ 83 ^]^ was employed to examine structural differences between the mutated and reference versions of the protein.
To evaluate ligand binding, structural files of the mutated P. menglaensis APOE, its non‐mutated counterpart from non‐snail‐eating snakes, and a potential ligand were loaded into Dockey v1.0.1.^[^ 84 ^]^ Dockey simulated the binding interaction 10 times, generating parameters for model fitness, binding stability and affinity. These metrics were then compared between the APOE binding models from P. menglaensis and those from snakes with alternative diets. To overcome Dockey's limitations in handling high‐complexity protein‐protein interactions, we employed AlphaFold v3.0.0^[^ 85 ^]^ to resolve distinct binding architectures between APOE‐LDLR interactions. It was also used to validate the APOE‐cholesterol binding architectures.
Metagenomic Sequencing and Assembly
Six Mengla snail‐eating snakes and three Zhao's mountain stream snakes were captured in the wild during visual encounter surveys. When a snake was opportunistically located, it was captured using tongs and safely secured in a clear plastic box. The Mengla snail‐eating snakes were sampled from Xishuangbanna, Yunnan Province, within three days, and the Zhao's mountain stream snakes were sampled from Leishan, Guizhou Province, within three days (Table S29, Supporting Information). Six Chinese cobras were collected together at one time from Sichuan Province; however, since they were donated by villagers, the exact capture locations were unknown. All individuals of the three snake species were collected during summer.
These snakes were sacrificed by decapitation, and their fresh gut contents were immediately collected and stored at −80 °C with the same procedures. DNA was extracted from the gut microbiome using a TIANamp Stool DNA Kit (TIANGEN) following the manufacturer's instructions. DNA quality was verified prior to constructing sequencing libraries using a DNA Library Prep Kit (Yeasen). Libraries were sequenced on the DNBSEQ‐T7 system in PE150 mode, generating a median of 7.79 Gb of sequencing data.
Metagenomic Taxonomic Annotation and Functional Analysis
The resulting metagenomic data were imported into metaWRAP^[^ 86 ^]^ for further analysis. The MetaWRAP read_qc module was used to trim the reads and remove host contamination. Quality‐checked reads were then co‐assembled using the metaWRAP Assembly module. The Kraken module was applied to annotate the co‐assembly results, enabling identification of community composition, while microbial abundance across taxonomic levels was estimated using Bracken v2.9.^[^ 87 ^]^ Alpha and beta diversity were then estimated using the EasyMetagenome pipeline.^[^ 88 ^]^
The co‐assembly was then binned with the Binning module, using the CONCOCT, MaxBin, and metaBAT algorithms. The generated bins were consolidated into a single bin set (‐c 70 ‐x 5) via the Bin_refinement module. The Reassemble_bins module was then used to further refine the consolidated bin set, with taxonomic and functional annotations determined for each bin using the Classify_bins and Annotate_bins modules, respectively. Functional enrichment of gut microbes significantly more abundant in P. menglaensis compared to other snakes was performed with MetaPhlAn^[^ 89 ^]^ following the biobakery_workflows. Microbial gene annotation of identified bins was conducted with DRAM,^[^ 90 ^]^ and reads were mapped to gene transcripts using STAR, with microbial gene abundance levels estimated via RSEM. To compare gene expression between P. menglaensis and non‐snail‐eating snakes, gut microbial genes from all species were first clustered using OrthoFinder, and read counts of each cluster were calculated. A Kruskal‐Wallis test was then used to assess significance of differences in microbial gene abundance among P. menglaensis, N. atra and O. zhaoermii. Dunn's test was employed to conduct pairwise comparisons following a statistically significant difference detected by the Kruskal‐Wallis test. Genes exhibiting significantly different abundance between P. menglaensis and non‐snail‐eating snakes were defined with a Benjamini‐Hochberg adjusted p < 0.05.
Acquisition of Recombinant P. Menglaensis HPSEs
Recombinant protein expression and purification were performed by Gene Universal Inc. In brief, the HPSE gene was amplified via polymerase chain reaction (PCR) using primers with overhangs, followed by sequence verification. The amplified product was digested with NdeI and XhoI (SibStar) and cloned into the pET‐28a(+) vector (Gene Universal Inc.) (Table S30, Supporting Information). Heat shock transformation was then performed on competent Escherichia coli TOP10 cells (Gene Universal Inc.). Positive clones were screened via PCR, and plasmid DNA was extracted and further confirmed by sequencing. The extracted plasmid was also digested with ApaI and XhoI (SibStar) to ensure that the resulting bands matched the expected fragment sizes.
The extracted plasmid was then transformed into E. coli BL21(DE3) cells (Gene Universal Inc.), and positive clones were inoculated in Luria‐Bertani (LB) medium. Recombinant protein expression was induced with 0.5 mM IPTG at 37 °C for 4 h, with protein expression validated by sodium dodecyl‐sulfate polyacrylamide gel electrophoresis (SDS‐PAGE) and Western Blotting (Figure S11, Supporting Information). After assessing solubility, large‐scale production of recombinant proteins was conducted, followed by purification using Ni‐NTA affinity chromatography, with a PBS‐Urea (pH 7.4) buffer containing 500 mM imidazole. Purified proteins were confirmed by SDS‐PAGE (Figure S11, Supporting Information), refolded, and dialyzed in a PBS buffer containing 300 mM NaCl and 10% Glycerol at pH 7.4. Finally, the filtered recombinant proteins were stored at −80 °C until further use.
Enzyme Activity Assays
Heparinolytic activity was quantified using a Shimadzu gel permeation chromatography (GPC) system equipped with a Shodex OHpak SB‐806M HQ column (8.0×300 mm). The mobile phase consisted of 0.1 M ammonium acetate buffer (pH 6.8) delivered at 0.6 mL min^−1^. Samples were filtered through 0.45 µm membranes prior to 25 µL injections. Recombinant HPSE proteins (0.4 mg mL^−1^ in PBS) from P. menglaensis and three non‐snail‐eating snakes were incubated with substrate solution containing 0.5 mg mL^−1^ heparin sodium (MACKLIN) in 10 mM PBS (pH 7.0) at a 100:1 (v/v) substrate‐to‐enzyme ratio. Reactions proceeded for 4.5 h at 37 °C followed by thermal inactivation at 100 °C for 10 min. Parallel control reactions used heat‐inactivated enzymes (100 °C, 10 min pretreatment). Chromatographic profiles were analyzed by monitoring absorbance at 210 nm. Enzyme activity was calculated as
where A_sample_ and A_control_ represent the integrated peak areas of heparin degradation products in experimental and heat‐inactivated control groups, respectively.
Statistical Analysis
For statistical analyses of results generated by Dockey and AlphaFold3, data were presented directly using boxplots. Dockey and AlphaFold3 simulated binding interactions 10 and 50 times, respectively. A two‐sided Student's t‐test was used to assess significant differences, with significance defined as p < 0.05. Statistical analyses were performed using R. For identifying differentially expressed proteins before and after feeding snails, A two‐sided Student's t‐test was conducted in R to determine significant differences, with an adjusted p < 0.05 considered significant. Each group included at least three individuals. For gut microbiome analyses, six P. menglaensis, six N. atra, and three O. zhaoermii individuals were analyzed. When comparing microbial gene abundance between P. menglaensis and non‐snail‐eating snakes, data were presented as boxplots. A Kruskal‐Wallis test was used to assess differences in microbial gene abundance among P. menglaensis, N. atra, and O. zhaoermii. Following a significant Kruskal‐Wallis result, one‐sided Dunn's tests were used for pairwise comparisons. Genes with significantly different abundances between P. menglaensis and the other two snakes were identified using Benjamini‐Hochberg‐adjusted p < 0.05. Statistical analyses were performed using R.
Conflict of Interest
The authors declare the following competing interests that one patent has been registered (CN202510860383.8).
Supporting information
Supporting Information
Supporting Information
The reference list from the paper itself. Each links out to its DOI / PubMed record.
- 1S.‐C. Cheng , C.‐B. Liu , X.‐Q. Yao , J.‐Y. Hu , T.‐T. Yin , B. K. Lim , W. Chen , G.‐D. Wang , C.‐L. Zhang , D. M. Irwin , Z.‐G. Zhang , Y.‐P. Zhang , L. Yu , Natl. Sci. Rev. 2022, 10, nwac 174.37124465 10.1093/nsr/nwac 174PMC 10139702 · doi ↗ · pubmed ↗
- 2Y. Hu , Q. Wu , S. Ma , T. Ma , L. Shan , X. Wang , Y. Nie , Z. Ning , L. Yan , Y. Xiu , F. Wei , Proc. Natl. Acad. Sci. USA 2017, 114, 1081.28096377 10.1073/pnas.1613870114 PMC 5293045 · doi ↗ · pubmed ↗
- 3M. Blumer , T. Brown , M. B. Freitas , J. A. Oliveira , A. E. Morales , T. Schell , C. Greve , M. Pippel , D. Jebb , N. Hecker , A.‐W. Ahmed , B. M. Kirilenko , M. Foote , A. Janke , B. K. Lim , M. Hiller , Sci. Adv. 2022, 8, abm 6494.10.1126/sciadv.abm 6494 PMC 895626435333583 · doi ↗ · pubmed ↗
- 4D. G. Broadley , Herpetologica 1979, 35, abm 6494.
- 5K. Coleman , L. A. Rothfuss , H. Ota , K. V. Kardong , J Herpetol 1993, 27, 320.
- 6B. C. Jayne , H. K. Voris , P. K. Ng , Biol J Linn Soc 2018, 123, 636.
- 7J. K. Webb , R. Shine , W. R. Branch , P. S. Harlow , J. Zool. 2000, 250, 321.
- 8A. O'Hanlon , C. D. Williams , M. J. Gormally , J. Zool. 2019, 307, 203.