Cost-effectiveness of cadonilimab plus chemotherapy vs chemotherapy alone for advanced gastric cancer: evidence to inform drug pricing in the U.S. and China
Wenwang Lang, Liuyong Mei, Qiang Xiao, Zujin Zhou, Huiqing Jiang, Xianling Zhao

TL;DR
This study compares the cost-effectiveness of cadonilimab plus chemotherapy versus chemotherapy alone for advanced gastric cancer in the U.S. and China, finding it cost-effective in China for PD-L1 positive patients but not in the U.S.
Contribution
The study provides novel economic evidence on cadonilimab pricing thresholds for cost-effectiveness in two distinct healthcare systems.
Findings
In China, cadonilimab plus chemotherapy is cost-effective for PD-L1 CPS ≥5 patients with an ICER of $37,499.27/QALY.
In the U.S., the therapy's ICER of $290,498.45/QALY exceeds the WTP threshold.
Price simulations suggest cadonilimab must be priced below $209.54/125 mg in China and $826.46/125 mg in the U.S. to be cost-effective.
Abstract
Cadonilimab, a bispecific antibody targeting programmed cell death protein 1 (PD-1) and cytotoxic T-lymphocyte-associated protein 4 (CTLA-4), was the first agent of its class to demonstrate promising therapeutic efficacy in combination with chemotherapy for patients diagnosed with advanced gastric or gastroesophageal junction adenocarcinoma (GC/GEJC). This economic evaluation aimed to determine whether cadonilimab plus chemotherapy offers cost-effective benefits compared to chemotherapy alone from both the U.S. and Chinese healthcare payer perspectives. In addition, we estimated the pricing thresholds at which cadonilimab would be considered economically viable as a first-line treatment. We constructed a Markov model comprising three health states, progression-free survival (PFS), progressive disease (PD), and death, spanning a 10-year time horizon. The clinical efficacy data were…
Genes, proteins, chemicals, diseases, species, mutations and cell lines named across the full text — each resolved to its canonical identifier and authoritative record.
Click any figure to enlarge with its caption.
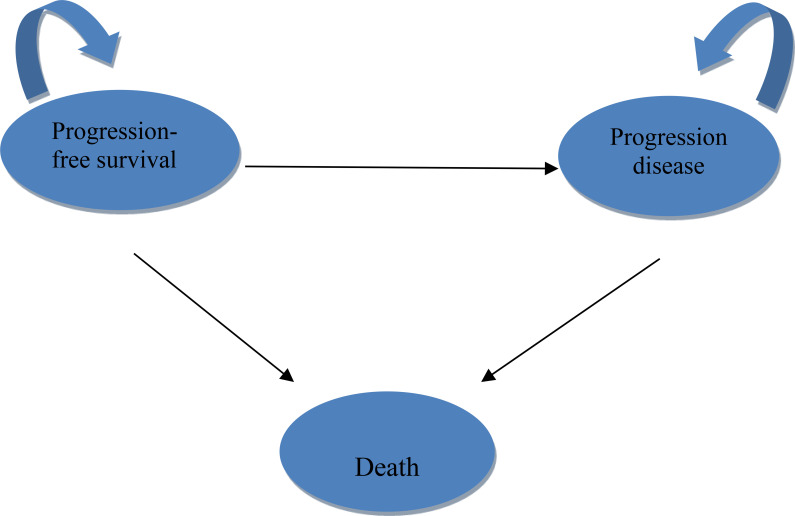 Figure 1
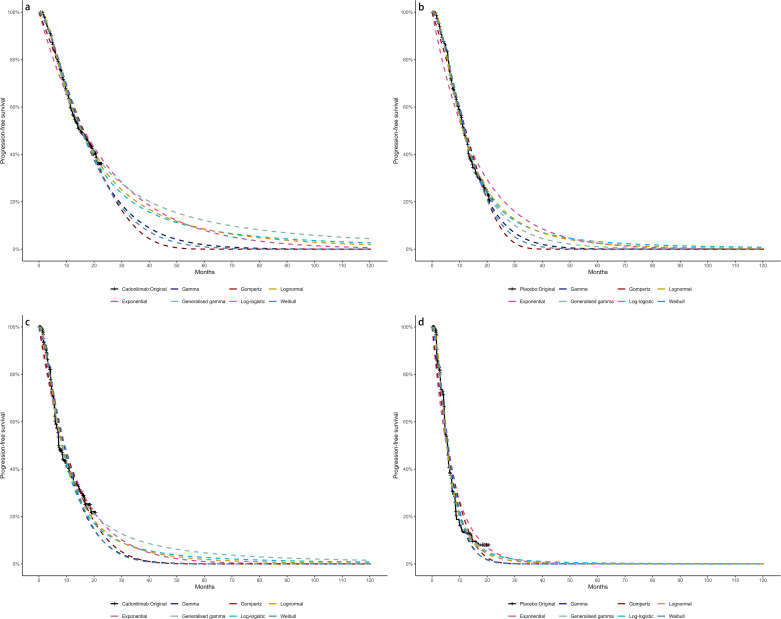 Figure 2
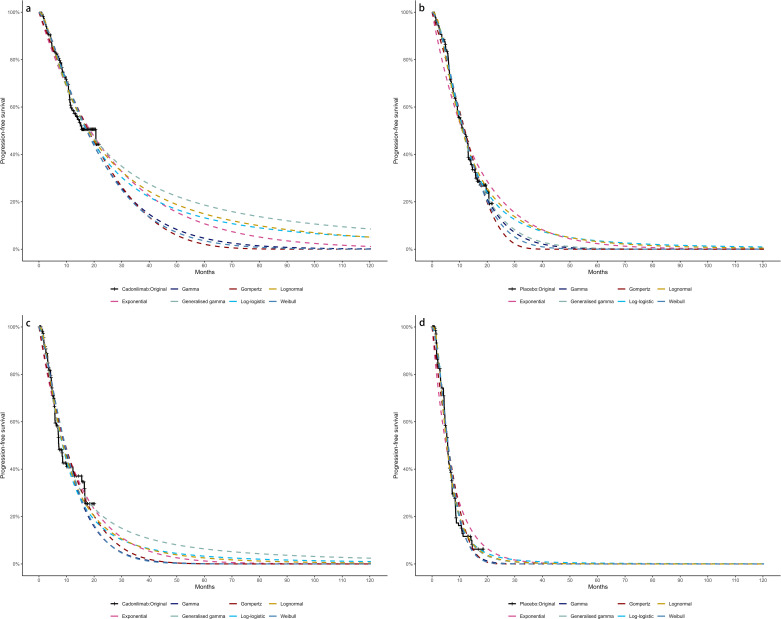 Figure 3
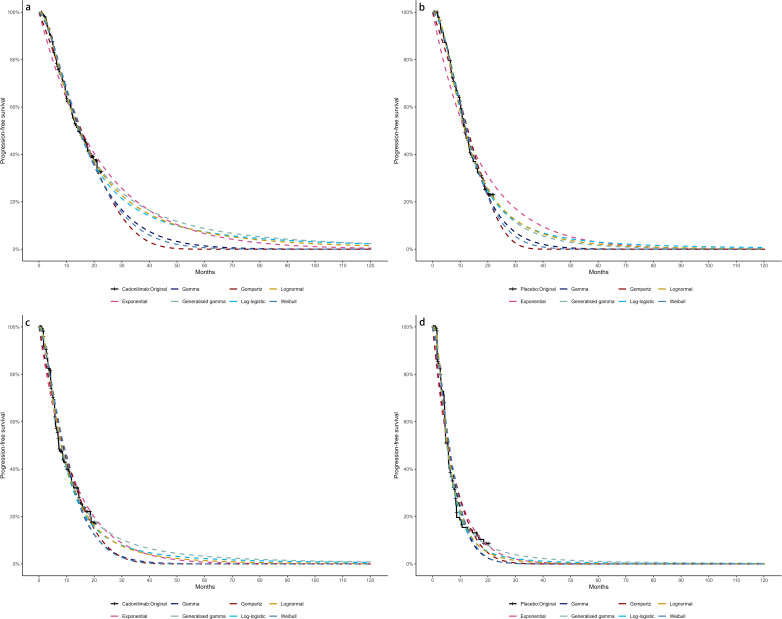 Figure 4
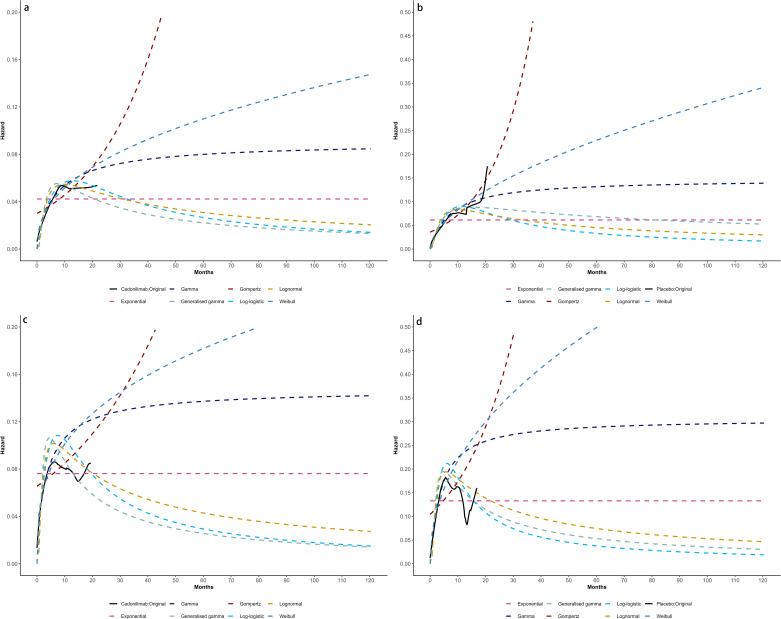 Figure 5
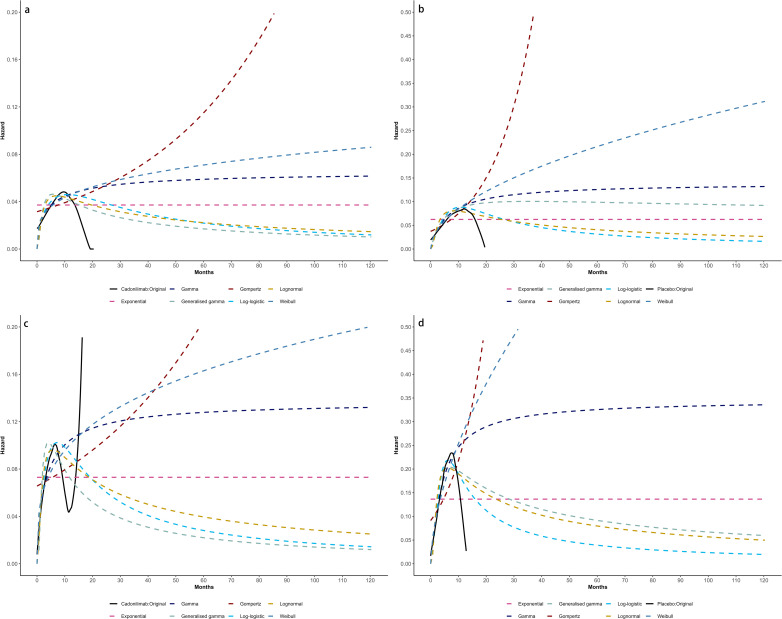 Figure 6
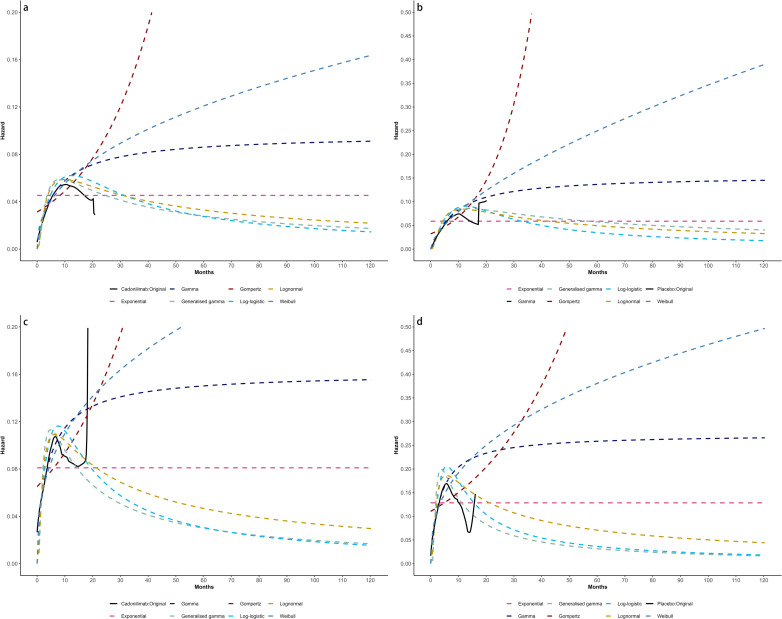 Figure 7
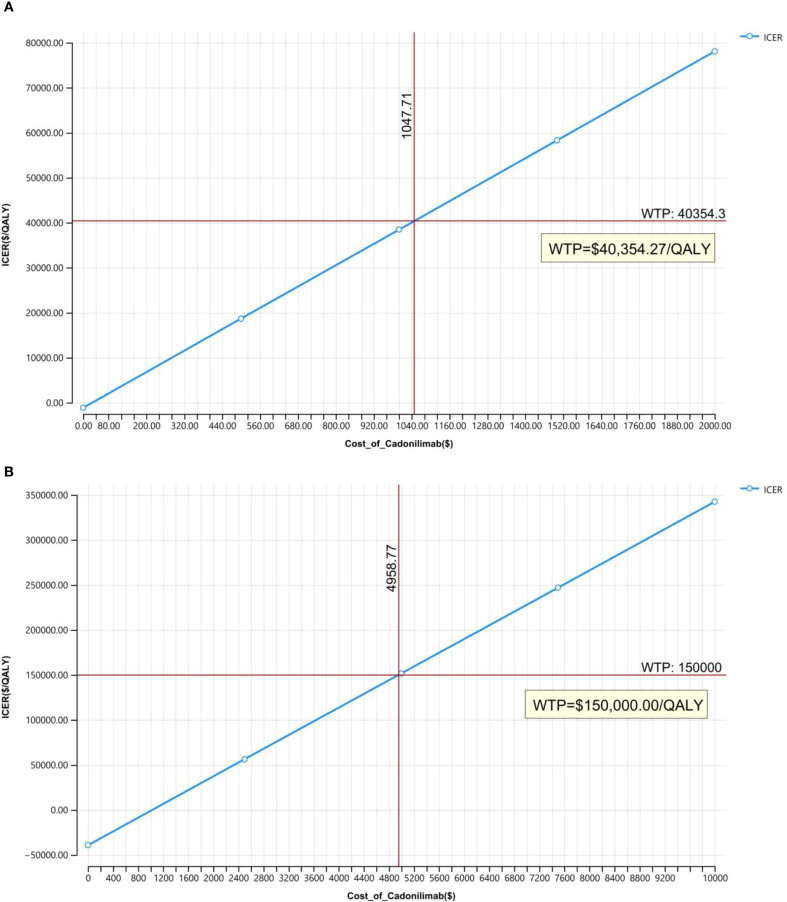 Figure 8
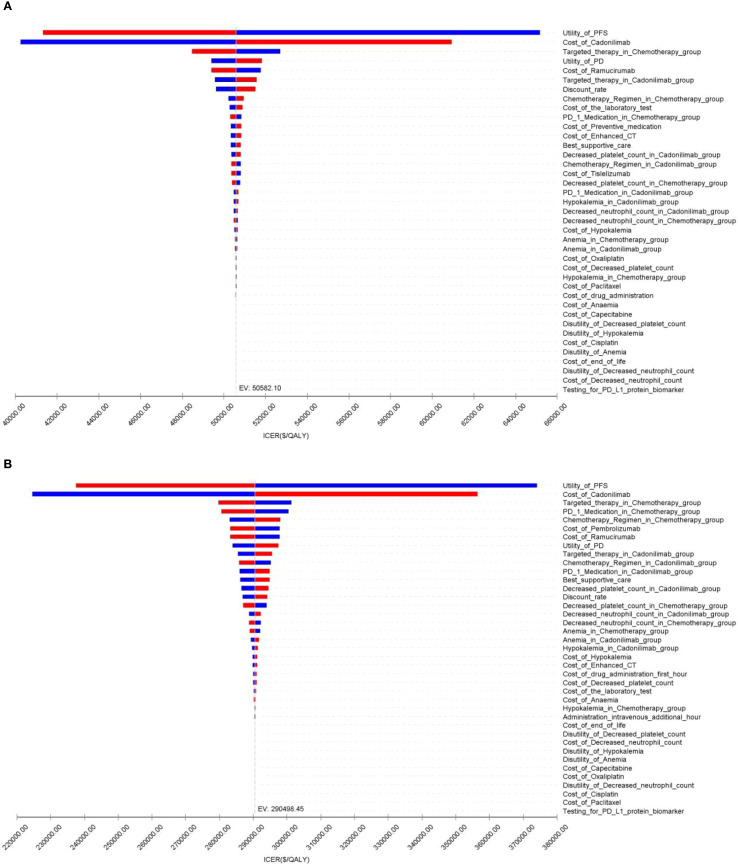 Figure 9
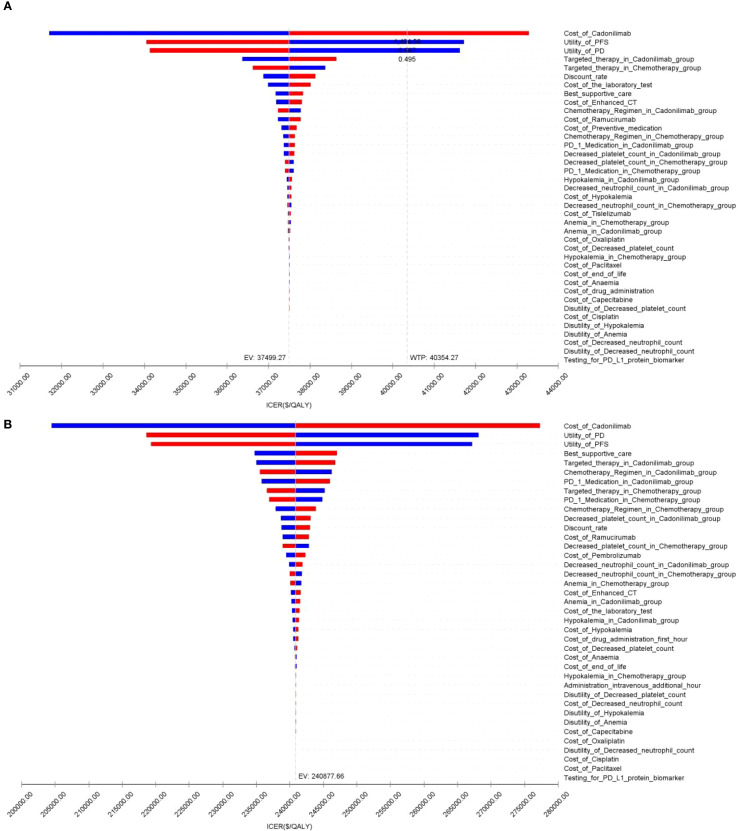 Figure 10
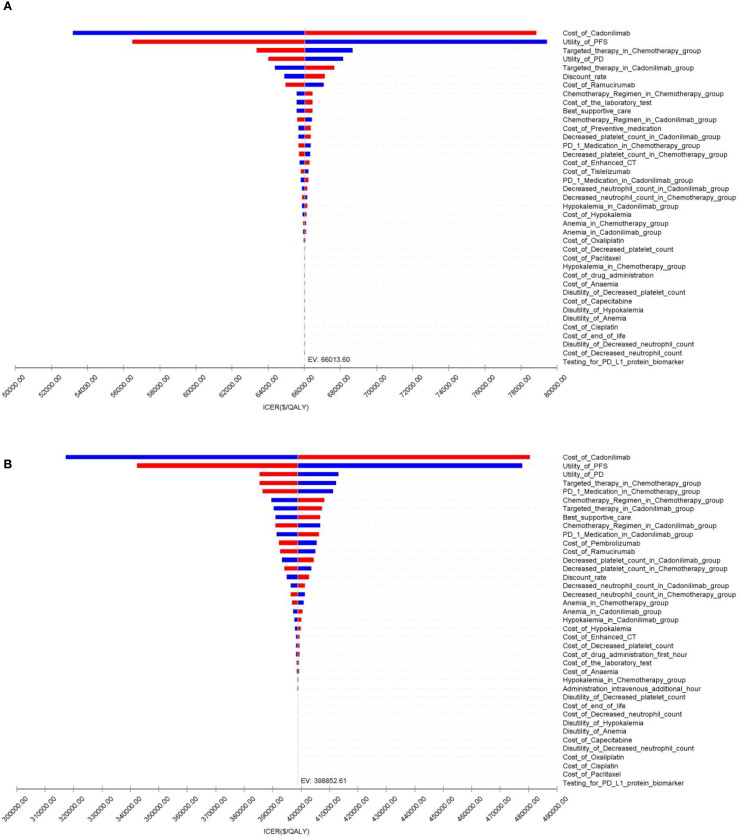 Figure 11
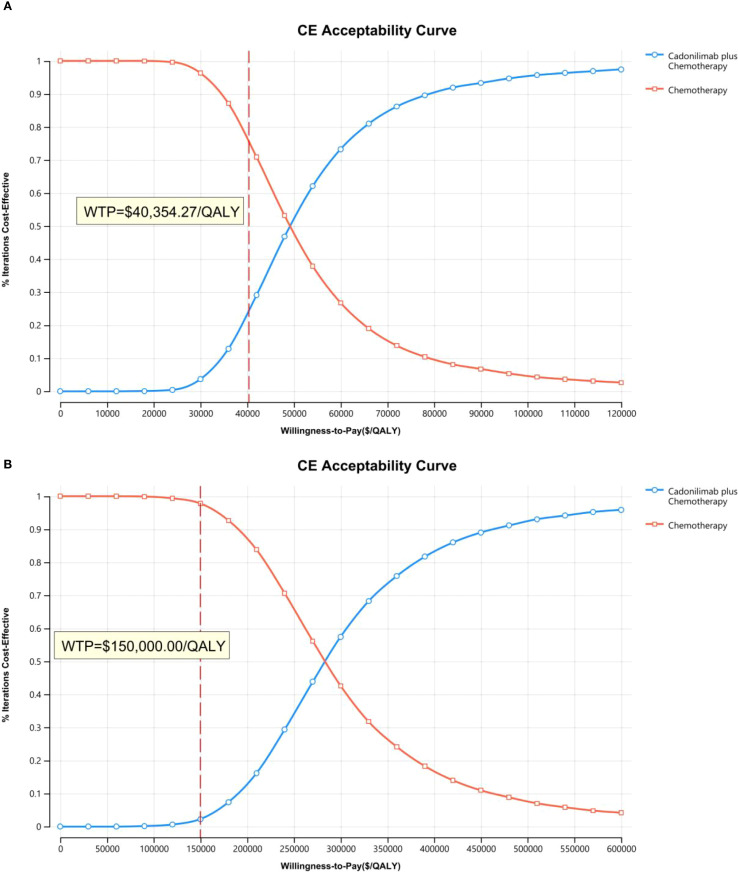 Figure 12
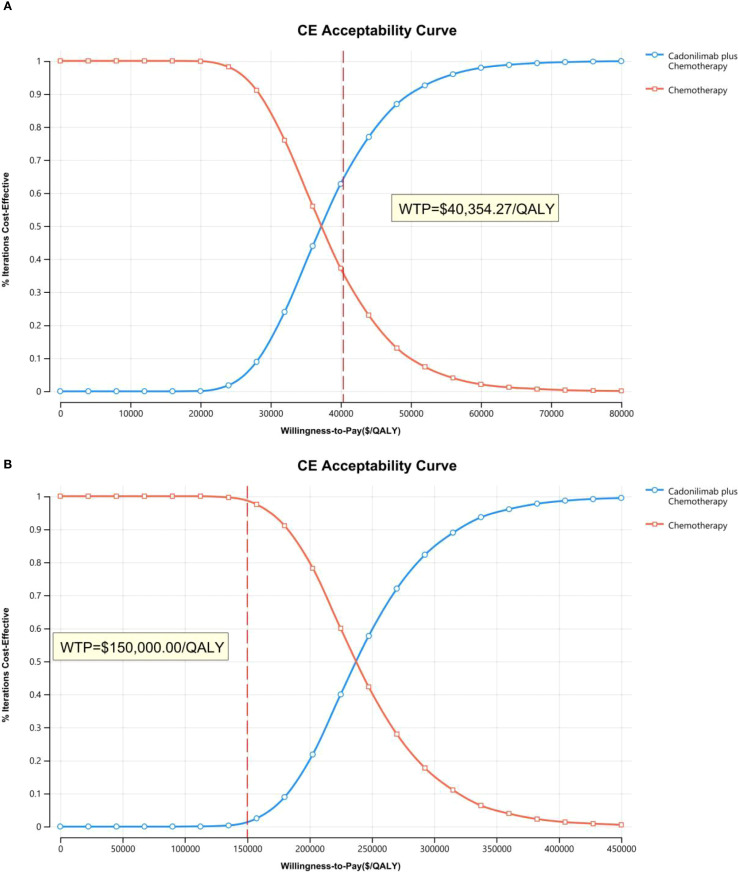 Figure 13
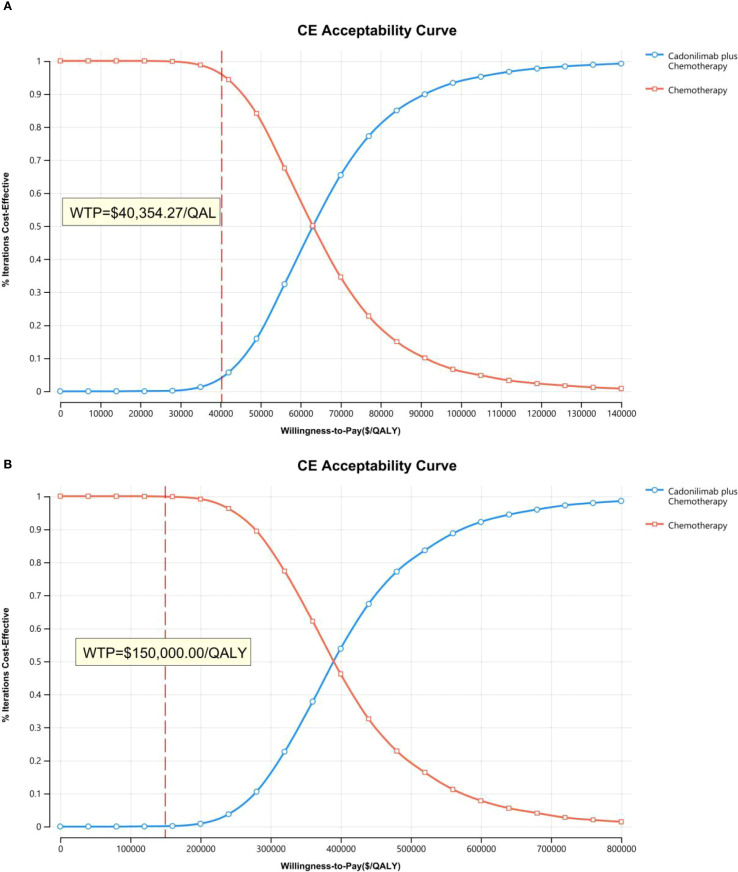 Figure 14
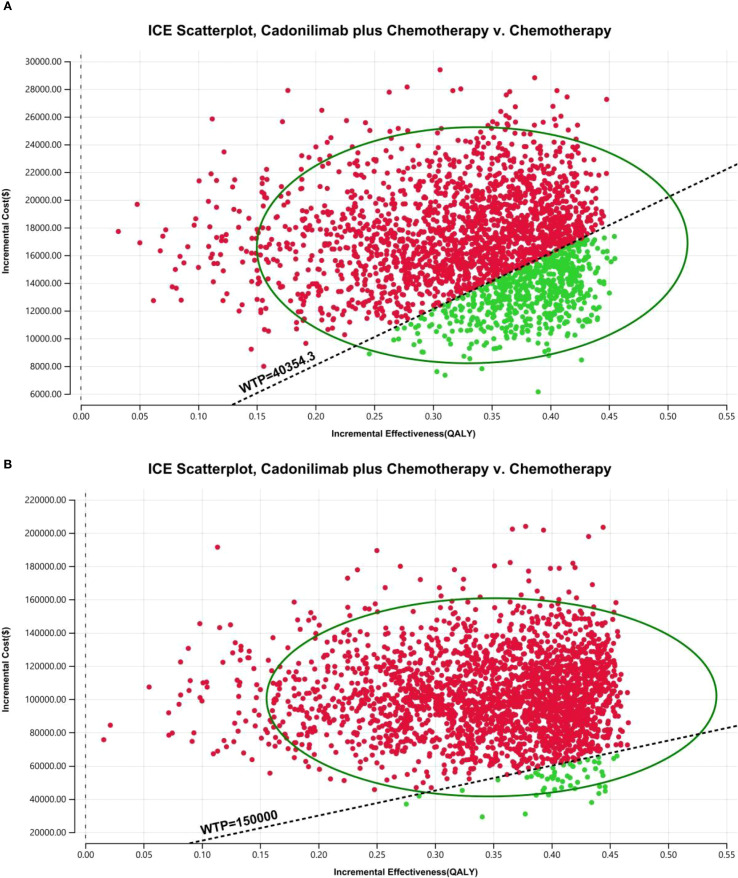 Figure 15
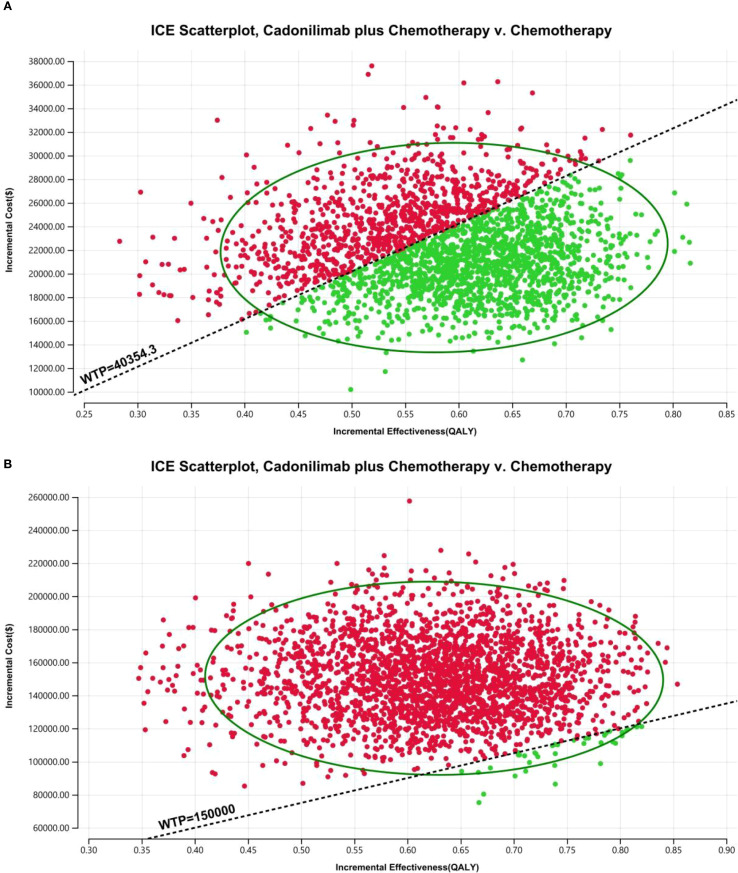 Figure 16
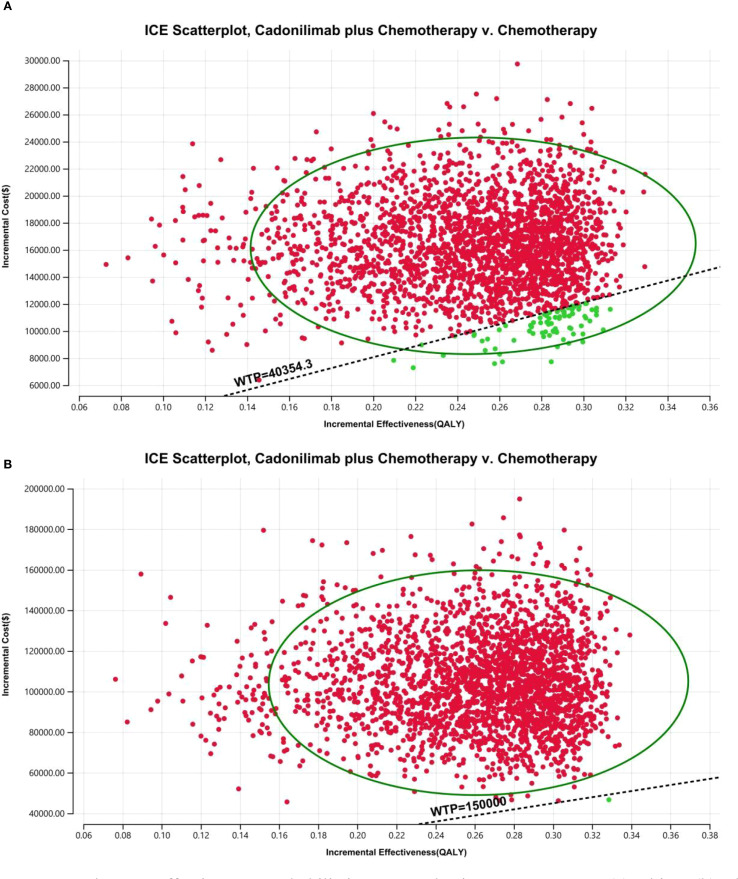 Figure 17
| Parameters | Baseline value | Range | Distribution | Reference | |
|---|---|---|---|---|---|
| Minimum | Maximum | ||||
|
| |||||
| Cadonilimab plus chemotherapy | Meanlog=2.7363 | Lognormal | ( | ||
| chemotherapy | Shape=2.0400 | Loglogistic | ( | ||
|
| |||||
| Cadonilimab plus chemotherapy | Mu=1.9580 | Generalized gamma | ( | ||
| chemotherapy | Meanlog=1.6818 | Lognormal | ( | ||
|
| |||||
| Cadonilimab plus chemotherapy | Meanlog=2.8810 | Lognormal | ( | ||
| chemotherapy | Shape=1.9017 | Gamma | ( | ||
|
| |||||
| Cadonilimab plus chemotherapy | Meanlog=2.1741 | Lognormal | ( | ||
| chemotherapy | Meanlog=1.6784 | Lognormal | ( | ||
|
| |||||
| Cadonilimab plus chemotherapy | Meanlog=2.6772 | Lognormal | ( | ||
| chemotherapy | Meanlog=2.4639 | Lognormal | ( | ||
|
| |||||
| Cadonilimab plus chemotherapy | Meanlog=2.0993 | Lognormal | ( | ||
| chemotherapy | Meanlog=1.6956 | Lognormal | ( | ||
|
| |||||
| Cost of Cadonilimab | 1305.87 | 1044.70 | 1567.04 | Gamma | Local charge |
| Cost of Tislelizumab | 352.03 | 281.62 | 422.44 | Gamma | Local charge |
| Cost of Oxaliplatin | 166.25 | 133.00 | 199.50 | Gamma | Local charge |
| Cost of Capecitabine | 44.06 | 35.25 | 52.87 | Gamma | Local charge |
| Cost of 5-FU | 126.87 | 101.50 | 152.24 | Gamma | Local charge |
| Cost of Cisplatin | 34.66 | 27.73 | 41.59 | Gamma | Local charge |
| Cost of Paclitaxel | 212.61 | 170.09 | 255.13 | Gamma | Local charge |
| Cost of Ramucirumab | 2106.24 | 1702.93 | 2554.39 | Gamma | Local charge |
| Testing for PD-L1 protein biomarker | 567.64 | 454.11 | 681.17 | Gamma | Local charge |
| Cost of the laboratory test | 106.61 | 85.29 | 127.93 | Gamma | ( |
| Enhanced CT | 171.03 | 136.82 | 205.24 | Gamma | Local charge |
| Cost of end-of-life | 1460.30 | 1168.24 | 1752.36 | Gamma | ( |
| Best supportive care | 164.57 | 92.16 | 138.24 | Gamma | ( |
| Cost of drug administration per unit | 134.93 | 107.94 | 161.92 | Gamma | ( |
|
| |||||
| PD-L1/PD-1 Medication | 11.50% | 9.20% | 13.80% | Beta | ( |
| Chemotherapy Regimen | 34.40% | 27.52% | 41.28% | Beta | ( |
| Targeted therapy | 11.10% | 8.88% | 13.32% | Beta | ( |
|
| |||||
| PD-L1/PD-1 Medication | 22.30% | 17.84% | 26.76% | Beta | ( |
| Chemotherapy Regimen | 47.90% | 38.32% | 57.48% | Beta | ( |
| Targeted therapy | 20.30% | 16.24% | 24.36% | Beta | ( |
|
| |||||
| Anemia | 669.45 | 535.56 | 803.34 | Gamma | ( |
| Decreased platelet count | 1054.22 | 843.38 | 1265.06 | Gamma | ( |
| Decreased neutrophil count | 544.19 | 435.35 | 653.03 | Gamma | ( |
| Hypokalemia | 3000.00 | 2400.00 | 3600.00 | Gamma | ( |
|
| |||||
| Utility of PFS | 0.797 | 0.638 | 0.956 | Beta | ( |
| Utility of PD | 0.577 | 0.462 | 0.692 | Beta | ( |
|
| |||||
| Anemia | 0.07 | 0.06 | 0.084 | Beta | ( |
| Decreased platelet count | 0.11 | 0.09 | 0.132 | Beta | ( |
| Decreased neutrophil count | 0.20 | 0.16 | 0.240 | Beta | ( |
| Hypokalemia | 0.04 | 0.09 | 0.14 | Beta | ( |
|
| |||||
| Anemia | 10.20% | 8.16% | 12.24% | Beta | ( |
| Decreased platelet count | 28.50% | 22.80% | 34.20% | Beta | ( |
| Decreased neutrophil count | 15.10% | 12.08% | 18.12% | Beta | ( |
| Hypokalemia | 5.90% | 4.72% | 7.08% | Beta | ( |
|
| |||||
| Anemia | 12.50% | 10.00% | 15.00% | Beta | ( |
| Decreased platelet count | 25.00% | 20.00% | 30.00% | Beta | ( |
| Decreased neutrophil count | 14.80% | 11.84% | 17.76% | Beta | ( |
| Hypokalemia | 1.00% | 0.08% | 0.12% | Beta | ( |
| Discount rate | 5% | 4.00% | 6.00% | Beta | |
| BMI/m2 | 1.72 | ||||
| Weight/kg | 65 | ||||
| $1 = ¥7.0467 | 40,354.27 | ||||
| Type of distribution | Cadonilimab plus chemotherapy (OS) | Chemotherapy (OS) | Cadonilimab plus chemotherapy (PFS) | Chemotherapy(PFS) | ||||||||
|---|---|---|---|---|---|---|---|---|---|---|---|---|
| AIC | BIC | LogLik | AIC | BIC | LogLik | AIC | BIC | LogLik | AIC | BIC | LogLik | |
| Exponential | 1284.687 | 1288.407 | -641.344 | 1488.312 | 1492.032 | -743.156 | 1195.999 | 1199.719 | -596.999 | 1360.303 | 1364.023 | -679.151 |
| Gamma | 1260.438 | 1267.878 | -628.219 | 1438.741 | 1446.182 | -717.371 | 1171.728 | 1179.169 | -583.864 | 1298.264 | 1305.705 | -647.132 |
| Generalized gamma | 1252.248 | 1263.409 | -623.124 | 1438.235 | 1449.395 | -716.117 | 1152.010 | 1163.171 | -573.005 | 1278.456 | 1289.617 | -636.228 |
| Gompertz | 1278.451 | 1285.892 | -637.226 | 1463.253 | 1470.693 | -729.626 | 1195.445 | 1202.886 | -595.722 | 1351.569 | 1359.010 | -673.785 |
| Weibull | 1264.650 | 1272.091 | -630.325 | 1443.448 | 1450.888 | -719.724 | 1179.156 | 1186.597 | -587.578 | 1314.639 | 1322.080 | -655.319 |
| Log-logistic | 1256.508 | 1263.949 | -626.254 | 1437.368 | 1444.808 | -716.684 | 1158.399 | 1165.839 | -577.199 | 1279.473 | 1286.913 | -637.736 |
| Lognormal | 1251.234 | 1258.674 | -623.617 | 1437.727 | 1445.168 | -716.863 | 1152.9990 | 1160.440 | -574.499 | 1277.656 | 1285.097 | -636.828 |
| Type of distribution | Cadonilimab plus chemotherapy (OS) | Chemotherapy(OS) | Cadonilimab plus chemotherapy (PFS) | Chemotherapy (PFS) | ||||||||
|---|---|---|---|---|---|---|---|---|---|---|---|---|
| AIC | BIC | LogLik | AIC | BIC | LogLik | AIC | BIC | LogLik | AIC | BIC | LogLik | |
| Exponential | 431.287 | 434.040 | -214.620 | 673.620 | 676.562 | -335.810 | 428.832 | 431.585 | -213.416 | 630.366 | 633.307 | -314.183 |
| Gamma | 429.017 | 434.525 | -212.477 | 655.971 | 661.855 | -325.986 | 422.720 | 428.227 | -209.360 | 595.904 | 601.788 | -295.952 |
| Generalized gamma | 427.851 | 436.112 | -210.906 | 657.836 | 666.661 | -325.918 | 416.104 | 424.365 | -205.052 | 593.860 | 602.685 | -293.930 |
| Gompertz | 432.654 | 438.161 | -214.296 | 664.185 | 670.068 | -330.092 | 430.376 | 435.884 | -213.188 | 620.211 | 626.095 | -308.106 |
| Weibull | 429.856 | 435.363 | -212.895 | 657.056 | 662.939 | -326.528 | 425.200 | 430.707 | -210.600 | 601.944 | 607.828 | -298.972 |
| Log-logistic | 427.599 | 433.106 | -211.774 | 656.027 | 661.911 | -326.014 | 417.733 | 423.240 | -206.866 | 592.798 | 598.681 | -294.399 |
| Lognormal | 426.077 | 431.584 | -211.016 | 658.737 | 664.621 | -327.369 | 415.505 | 421.012 | -205.752 | 591.928 | 597.811 | -293.964 |
| Type of distribution | Cadonilimab plus chemotherapy (OS) | Chemotherapy (OS) | Cadonilimab plus chemotherapy (PFS) | Chemotherapy (PFS) | ||||||||
|---|---|---|---|---|---|---|---|---|---|---|---|---|
| AIC | BIC | LogLik | AIC | BIC | LogLik | AIC | BIC | LogLik | AIC | BIC | LogLik | |
| Exponential | 698.054 | 701.110 | -348.027 | 723.001 | 725.991 | -360.500 | 648.459 | 651.515 | -323.229 | 655.088 | 658.078 | -326.544 |
| Gamma | 684.856 | 690.969 | -340.428 | 695.367 | 701.348 | -345.683 | 634.040 | 640.152 | -315.020 | 631.682 | 637.663 | -313.841 |
| Generalized gamma | 682.361 | 691.529 | -338.180 | 695.279 | 704.250 | -344.639 | 626.171 | 635.340 | -310.086 | 614.320 | 623.291 | -304.160 |
| Gompertz | 694.703 | 700.816 | -345.352 | 709.257 | 715.238 | -352.629 | 647.587 | 653.699 | -321.793 | 655.037 | 661.018 | -325.519 |
| Weibull | 687.161 | 693.274 | -341.581 | 698.274 | 704.255 | -347.137 | 638.087 | 644.200 | -317.044 | 640.021 | 646.002 | -321.793 |
| Log-logistic | 682.887 | 688.999 | -339.443 | 694.586 | 700.567 | -345.293 | 628.307 | 634.419 | -312.153 | 618.165 | 624.146 | -307.082 |
| Lognormal | 680.510 | 686.623 | -338.255 | 693.371 | 699.352 | -344.685 | 625.246 | 631.359 | -310.623 | 616.300 | 622.280 | -306.150 |
| Parameters | Baseline value | Range | Distribution | Reference | |
|---|---|---|---|---|---|
| Minimum | Maximum | ||||
|
| |||||
| Cost of Cadonilimab | 8640.00 | 6912.00 | 10368.00 | Gamma | Estimated |
| Cost of Pembrolizumab | 11520.60 | 9216.48 | 13824.72 | Gamma | ( |
| Cost of Oxaliplatin | 40.95 | 31.45 | 47.17 | Gamma | ( |
| Cost of Capecitabine | 56.00 | 87.92 | 131.88 | Gamma | ( |
| Cost of 5-FU | 50.17 | 40.14 | 60.20 | Gamma | ( |
| Cost of Cisplatin | 42.32 | 36.63 | 54.95 | Gamma | ( |
| Cost of Paclitaxel | 40.06 | 32.36 | 48.54 | Gamma | ( |
| Cost of Ramucirumab | 13124.36 | 10499.49 | 15749.23 | Gamma | ( |
| Cost of the laboratory test | 111.65 | 89.32 | 133.98 | Gamma | ( |
| Enhanced CT | 424.35 | 339.48 | 509.22 | Gamma | ( |
| Testing for PD-L1 protein biomarker | 459.00 | 367.20 | 550.80 | Gamma | ( |
| Cost of end-of-life | 21603.00 | 17282.40 | 25923.60 | Gamma | ( |
| Best supportive care | 3049.00 | 2439.20 | 3658.80 | Gamma | ( |
| Cost of drug administration first hour | 142.55 | 114.04 | 171.06 | Gamma | ( |
| Administration intravenous, additional hour | 30.68 | 24.54 | 36.82 | Gamma | ( |
| Cost of AEs, $ | |||||
| Anemia | 20260.00 | 6352.80 | 9529.20 | Gamma | ( |
| Decreased platelet count | 22698.00 | 10484.00 | 15726.00 | Gamma | ( |
| Decreased neutrophil count | 17181.00 | 10484.00 | 15726.00 | Gamma | ( |
| Hypokalemia | 25326.00 | 6705.75 | 10058.63 | Gamma | ( |
| Discount rate | 3% | 0.02 | 0.04 | Beta | |
| BMI/m2 | 2.1 | ||||
| Weight/kg | 75 | ||||
| Treatment | Cost | QALY | Incremental cost | Incremental QALY | INHB | INMB | ICER |
|---|---|---|---|---|---|---|---|
| Cadonilimab plus chemotherapy(China) | 28528.60 | 1.01 | 16797.61 | 0.33 | -0.08 | -3396.52 | 50582.10 |
| Chemotherapy(China) | 11730.98 | 0.67 | |||||
| Cadonilimab plus chemotherapy(CPS ≥5)(China) | 32039.12 | 1.18 | 21999.87 | 0.59 | 0.04 | 1674.96 | 37499.27 |
| Chemotherapy(CPS ≥5)(China) | 10039.25 | 0.59 | |||||
| Cadonilimab plus chemotherapy(CPS <5)(China) | 27699.35 | 0.91 | 16349.88 | 0.25 | -0.16 | -6355.16 | 66013.60 |
| Chemotherapy(CPS <5)(China) | 11349.47 | 0.66 | |||||
| Cadonilimab plus chemotherapy(US) | 191469.60 | 1.04 | 101275.06 | 0.35 | -0.33 | -48981.29 | 290498.45 |
| Chemotherapy(US) | 90194.54 | 0.69 | |||||
| Cadonilimab plus chemotherapy(CPS ≥5)(US) | 225496.39 | 1.22 | 150226.89 | 0.62 | -0.38 | -56677.19 | 240877.66 |
| Chemotherapy(CPS ≥5)(US) | 75269.50 | 0.60 | |||||
| Cadonilimab plus chemotherapy(CPS <5)(US) | 190095.49 | 0.93 | 103745.44 | 0.26 | -0.43 | -64728.99 | 398852.61 |
| Chemotherapy(CPS <5)(US) | 86350.04 | 0.67 |
| Treatment | Cost | QALY | Incremental cost | Incremental QALY | INHB | INMB | ICER |
|---|---|---|---|---|---|---|---|
| Cadonilimab plus chemotherapy(China) | 29119.94 | 1.04 | 16970.62 | 0.35 | -0.07 | -2902.11 | 48678.70 |
| Chemotherapy(China) | 12149.32 | 0.69 | |||||
| Cadonilimab plus chemotherapy(CPS ≥5)(China) | 14311.46 | 1.01 | 8426.58 | 0.33 | -0.08 | -1703.88 | 25374.68 |
| Chemotherapy(CPS ≥5)(China) | 5884.89 | 0.67 |
Peer Reviews
No public reviews on file for this paper yet. If you reviewed it on a platform where reviews are public (OpenReview, ICLR, NeurIPS, ICML), you can paste yours below so the community can read it here.
Videos
No videos yet. Explain this paper in a talk, walkthrough, or lecture? Add one.
Taxonomy
TopicsGastric Cancer Management and Outcomes · Helicobacter pylori-related gastroenterology studies · Economic and Financial Impacts of Cancer
Introduction
Gastric cancer (GC), including tumors located at the gastroesophageal junction (GEJC), is the fourth most prevalent malignancy globally and is a major contributor to cancer-related mortality (1). In 2020, it accounted for approximately 1.1 million new cases and over 768,000 deaths worldwide (2). Epidemiological data reveal substantial regional disparities in disease burden: China reports roughly 358,700 new GC/GEJC cases and more than 260,400 annual deaths (3), while the United States reports around 30,300 new cases and over 10,780 deaths each year (4). A critical shared challenge in both regions is that most patients are diagnosed at an advanced stage, which severely restricts treatment options and undermines long-term prognosis. The most common histological type of gastric cancer is adenocarcinoma, with the majority being human epidermal growth factor receptor 2 (HER2)-negative (5, 6). Despite advances in medical technology, more than 50% of patients with gastric cancer present with metastatic and unresectable tumors at diagnosis. Anti-programmed cell death protein-1 (PD-1) and programmed death ligand 1 (PD-L1) inhibitors combined with chemotherapy have become the standard of care for first-line treatment of HER2-negative, unresectable locally advanced or metastatic gastric or gastroesophageal junction (GC/GEJ) adenocarcinoma (7–11). Although the addition of a PD-1 inhibitor to chemotherapy improves outcomes, survival benefits remain limited in patients with low PD-L1 expression.
Cadonilimab is a human tetravalent bispecific IgG1 antibody with a symmetric IgG single-chain variable fragment (scFv) structure and an Fc-null design to eliminate antibody-dependent cellular cytotoxicity (ADCC), antibody-dependent cellular phagocytosis (ADCP), complement-dependent cytotoxicity (CDC), and cytokine release. Fc receptor-mediated effector functions can eliminate or impair lymphocytes expressing PD-1 and cytotoxic T-lymphocyte-associated protein 4 (CTLA-4), thereby reducing their antitumor activity (Supplementary Figure 1). Moreover, immune-related adverse events (irAEs) induced by checkpoint inhibitors have been associated with the recruitment of immune cells bearing Fc receptors (12, 13). Cadonilimab has shown promising clinical activity and manageable safety in patients with gastric or GEJ adenocarcinoma, regardless of PD-L1 expression (14).
In the phase 3 COMPASSION-15 trial (15), both progression-free survival (PFS) and overall survival (OS) significantly improved in the cadonilimab group. In the intention-to-treat (ITT) population, the median OS was 15.0 months versus 10.8 months; in patients with PD-L1 combined positive score (CPS) ≥5, the median OS was not reached versus 10.6 months; and in those with PD-L1 CPS <5, it was 14.8 months versus 11.1 months. The median PFS was 7.0 months in the cadonilimab group compared to 5.3 months in the placebo group. Among patients with PD-L1 CPS ≥5, PFS was 6.9 months with cadonilimab and 4.6 months with placebo, while in the PD-L1 CPS <5 group, PFS was 6.9 months versus 5.5 months.
Cadonilimab is the world’s first PD-1/CTLA-4 bispecific antibody tumor immunotherapy drug developed independently in China and provides critical evidence supporting updates to clinical practice guidelines for gastric cancer. Despite its clinical potential, there is no comprehensive evidence of its economic value. Cadonilimab has been granted orphan drug status and fast-track designation by the U.S. FDA and is expected to receive market approval as early as 2026. As a next-generation immunotherapy agent, it is projected to be a key component of the global oncology market, which is valued at nearly USD 100 billion. However, its high price triggered two rounds of price reductions in China, from 865.80, and then to $261.17 per 125 mg, raising concerns about affordability and cost-effectiveness. The absence of pricing information in the U.S. further complicates economic evaluations. Additionally, cadonilimab may soon be included in National Comprehensive Cancer Network (NCCN) Guidelines (16), underscoring the need for cost-effectiveness data to inform clinical and policy decisions in both regions.
This study aimed to assess the cost-effectiveness of cadonilimab in combination with chemotherapy versus chemotherapy alone as first-line treatment for advanced GC/GEJC from both U.S. and Chinese healthcare payer perspectives, thereby informing future drug pricing and reimbursement decisions.
Methods
Patient enrollment and intervention
This study followed the Consolidated Health Economic Evaluation Reporting Standards (CHEERS) guidelines (17). Eligible patients were between 18 and 75 years of age and had histologically confirmed, locally advanced, unresectable, or metastatic GC/GEJC. None of the patients had previously received systemic therapy for advanced disease. Patient characteristics and inclusion criteria were consistent with those described in the COMPASSION-15 clinical trial.
The participants were randomly assigned to receive either cadonilimab (10 mg/kg, administered intravenously) or a placebo every 21 days for up to 24 months. Both groups received concurrent chemotherapy with capecitabine (1,000 mg/m² orally, twice daily on days 1–14) and oxaliplatin (130 mg/m² intravenously on day 1), repeated in 21-day cycles for up to six cycles (XELOX regimen). Following the combination phase, the patients continued with cadonilimab or placebo as monotherapy.
Subsequent treatments, including PD-1 inhibitors, targeted agents, chemotherapy, or best supportive care, were performed in accordance with the NCCN (16) and Chinese Society of Clinical Oncology (CSCO) guidelines for gastric cancer (18) and were consistent with post-treatment strategies used in the COMPASSION-15 trial (15). Tumor assessments were performed every six weeks during the first 54 weeks after enrollment and every nine weeks thereafter.
Adverse events (AEs) were monitored with a particular focus on severe (grade ≥3) events occurring in more than 3% of patients. These included anemia, neutropenia, thrombocytopenia, and hypokalemia (Table 1).
Model structure
A three-state Markov model was constructed using TreeAge Pro 2022 (Williamstown, MA, USA) and R version 4.2.4 (Vienna, Austria). Health states included PFS, progressive disease (PD), and death (Figure 1). The model employed a 3-week cycle length over a 10-year time horizon, representing the lifetime of the patient population and capturing over 99% mortality.
Markov model structure.
The analysis was conducted from the perspective of healthcare payers in both China and the United States. The Chinese model adopted a system-wide healthcare payer perspective, whereas the U.S. analysis focused on direct medical costs relevant to both public and private payers (25).
Outcomes
The model evaluated total life years, quality-adjusted life years (QALYs), incremental cost-effectiveness ratios (ICERs), incremental net health benefits (INHB), and incremental net monetary benefits (INMB). Annual discount rates were applied to both costs and utilities—3% for the U.S. and 5% for China—in accordance with established pharmacoeconomic guidelines (26, 27).
Chinese cost data were converted to 2024 U.S. dollars using an exchange rate of 40,354.27 per QALY in China (three times the national gross domestic product per capita) and $150,000 per QALY in the U.S., consistent with standards established by the WHO and U.S. healthcare payers (28).
Clinical data inputs
Probabilities for OS and PFS were extracted from Kaplan–Meier (KM) curves in the ASTRUM-005 trial using the GetData Graph Digitizer (http://getdata-graph-digitizer.com), and individual patient data were reconstructed following the method described by Guyot et al. (29).
Due to limited follow-up, extrapolation was required to extend survival estimates across the model’s full time horizon (30). The reconstructed time-to-event data were then fitted with a series of parametric models, including classic models (exponential, Weibull, Gompertz, gamma, log-logistic, log-normal, and generalized gamma).
Model selection was guided by a combination of statistical goodness-of-fit based on the Akaike information criterion (AIC), extrapolation performance based on log likelihood (LogLik), and visual inspection. Using this framework, the most suitable parametric model was chosen to extrapolate KM curves for OS and PFS beyond the follow-up period of the COMPASSION-15 trial (consistent with the trial referenced earlier for treatment protocols) (Figures 2–4). Before implementing the Cox proportional hazards (PH) model, the PH assumption—a core prerequisite for valid model inference—was validated using two complementary methods: visual inspection of log-log survival curves and quantitative assessment of Schoenfeld residuals (31, 32). While the PH assumption yielded p-values > 0.05 for both OS and PFS across all patient groups (nominally suggesting the assumption was satisfied), two critical observations indicated potential violation: crossing cumulative hazard curves between the treatment and control arms, and a non-horizontal trend in the smoothed Schoenfeld residuals. The variation in predicted hazards across different parameter distributions is shown in Figures 5–7. The corresponding survival function parameters are detailed in Tables 2–4.
The Kaplan-Meier: (A) overall survival curves of Cadonilimab plus chemotherapy group, (B) overall survival curves of Chemotherapy group, (C) progression-free survival curves of Cadonilimab plus chemotherapy group, (D) progression-free survival curves of Chemotherapy group.
The Kaplan-Meier of CPS ≥ 5: (A) overall survival curves of Cadonilimab plus chemotherapy group, (B) overall survival curves of Chemotherapy group, (C) progression-free survival curves of Cadonilimab plus chemotherapy group, (D) progression-free survival curves of Chemotherapy group.
The Kaplan-Meier of CPS <5: (A) overall survival curves of Cadonilimab plus chemotherapy group, (B) overall survival curves of Chemotherapy group, (C) progression-free survival curves of Cadonilimab plus chemotherapy group, (D) progression-free survival curves of Chemotherapy group.
Comparison of fitted proportional hazards survival models with observed kaplan–meier curves: (A) overall survival curves of Cadonilimab plus chemotherapy group, (B) overall survival curves of Chemotherapy group, (C) progression-free survival curves of Cadonilimab plus chemotherapy group, (D) progression-free survival curves of Chemotherapy group.
Comparison of fitted proportional hazards survival models with observed kaplan–meier curves of CPS ≥ 5: (A) overall survival curves of Cadonilimab plus chemotherapy group, (B) overall survival curves of Chemotherapy group, (C) progression-free survival curves of Cadonilimab plus chemotherapy group, (D) progression-free survival curves of Chemotherapy group.
Comparison of fitted proportional hazards survival models with observed kaplan–meier curves of CPS <5: (A) overall survival curves of Cadonilimab plus chemotherapy group, (B) overall survival curves of Chemotherapy group, (C) progression-free survival curves of Cadonilimab plus chemotherapy group, (D) progression-free survival curves of Chemotherapy group.
Table 4: The Akaike information criteria (AIC), Bayesian information criteria (BIC) and Log likelihood (LogLik) (CPS <5).
Cost inputs
This analysis focused exclusively on the direct medical costs associated with the management of GC/GEJC. These costs include drug acquisition, laboratory testing, enhanced computed tomography (CT), intravenous drug administration, subsequent therapies, best supportive care, end-of-life care, and management of severe adverse events (grade 3 or 4). Medication prices were obtained from public Chinese databases and institutional pricing schedules, whereas other cost components were derived from published economic evaluations and relevant literature.
Owing to the absence of a listed market price for cadonilimab in the United States, its cost was estimated using a comparative approach. Specifically, pricing was approximated based on analogous immunotherapies such as toripalimab and tislelizumab (33). Drug prices for both China and the U.S. were converted to U.S. dollars and adjusted using a price index to ensure cross-national comparability. Tables 1 and 5 summarize the clinical and cost parameters used in this analysis (19–23, 28, 34, 35).
Quality-of-life inputs
Health outcomes in the model were adjusted using utility values obtained from previously published sources, as EQ-5D-5L (European Quality of Life-5 Dimension-5 Level) data were not directly reported in the COMPASSION-15 trial. Utility values were anchored on a scale ranging from 0 (representing death) to 1 (representing perfect health).
For patients in the PFS state, the utility was set at 0.797 based on data from the TOGA trial and calculated using the Japanese EuroQol (EQ-5D) scoring algorithm (24). The utility for patients in the PD state was 0.577, derived from evaluations conducted by the National Institute for Health and Clinical Excellence (NICE). Quality-of-life decrements (disutilities) associated with severe adverse events, including anemia, thrombocytopenia, neutropenia, and hypokalemia, were also incorporated into the model (24). All AEs were assumed to occur during the initial treatment cycle, with detailed incidence rates provided in Table 1.
Subgroup analyses
To explore heterogeneity in cost-effectiveness outcomes, subgroup analyses were performed for patients with PD-L1 CPS ≥5 and CPS <5 in both China and the United States. These analyses employed the same modeling structure and assumptions as those used in the base-case scenario. Due to the lack of subgroup-specific data on follow-up treatments, adverse event rates, or healthcare resource utilization in the COMPASSION-15 trial, these parameters were assumed to be consistent with those observed in the overall study population.
Price simulation
Owing to uncertainties in the key input parameters, particularly drug pricing, scenario analyses were conducted to evaluate a range of potential pricing outcomes. In the Chinese context, cost-effectiveness was assessed with and without the inclusion of a patient assistance program. The price of cadonilimab varied between 2,000 per 625 mg dose, and outcomes were compared against the country-specific WTP threshold of $40,354.27 per QALY.
In the United States, where a formal list price for cadonilimab is currently unavailable, an estimated cost of 0 to 150,000 WTP threshold.
Scenario analysis
To address potential inconsistencies between the base-case discount rates (3% for the U.S., 5% for China) and World Health Organization (WHO) recommendations, an additional scenario was run where China’s discount rate was lowered to 3% (matching the U.S. rate). This analysis evaluated how aligning discount rates across regions would impact cost-effectiveness conclusions, particularly for long-term survival outcomes. Given the volatility of the yuan–dollar exchange rate in 2024–2025, a second scenario incorporated Purchasing Power Parity (PPP) adjustments to currency conversion—replacing the base-case market exchange rate with 2024 International Monetary Fund (IMF) PPP values (¥1 = 1). Concurrently, China’s WTP threshold was adjusted to $20,243.85 per QALY to align with PPP-adjusted economic benchmarks, ensuring cross-country comparability of cost-effectiveness results under a standardized economic metric.
Sensitivity analysis
The robustness of the model outcomes was evaluated using one-way sensitivity analysis (OWSA) and probabilistic sensitivity analysis (PSA). In the OWSA, each key parameter was independently varied by ±20% from its base-case value to determine its influence on the ICER. The results were visualized using tornado diagrams to identify the most influential variables.
For the PSA, all model inputs were sampled simultaneously based on appropriate probability distributions, beta for probabilities and utility values, and gamma for cost parameters. A total of 10,000 Monte Carlo simulations were performed to quantify the uncertainty in ICER estimates and to calculate the likelihood that cadonilimab plus chemotherapy would be deemed cost-effective at different WTP thresholds.
Results
Base-case analysis
Over a 10-year time horizon, the base-case analysis indicated that patients receiving cadonilimab in combination with chemotherapy achieved 1.01 QALYs at a total cost of 11,730.98. This resulted in an incremental gain of 0.33 QALYs and an additional cost of 5,0582.10 per QALY for the combination therapy (Table 6).
When compared to China’s WTP threshold of 3,396.52, suggesting that cadonilimab plus chemotherapy is not cost-effective in the Chinese healthcare setting (Table 6).
In the U.S. scenario, the ICER for cadonilimab plus chemotherapy was estimated at 150,000.00. The corresponding INHB and INMB values were -0.41 QALYs and -$61,121.30, respectively, further supporting the conclusion that the combination regimen is not economically favorable under the current U.S. pricing assumptions (Table 6).
Subgroup analysis
Among patients with a PD-L1 CPS ≥5, the ICER for cadonilimab plus chemotherapy was 40,354.27 (Table 6). The corresponding INHB and INMB were 0.04 QALYs and $1,674.96, respectively, indicating that cadonilimab was cost-effective in this clinically responsive subgroup.
In contrast, for patients with a PD-L1 CPS <5, the ICER was 6,355.16, suggesting that cadonilimab was not cost-effective in this lower PD-L1 expression group (Table 6).
In the U.S. setting, the ICER for cadonilimab plus chemotherapy reached 398,852.61 per QALY in the CPS <5 group, both of which far exceeded the WTP threshold of 150,000.00 ([Table 6](#T6)). The corresponding INHBs were -0.38 and -0.43 QALYs, while the INMBs were -56,677.19 and -$64,728.99, respectively. These findings indicate that cadonilimab was not cost-effective in either subgroup within the U.S. healthcare context, despite differential clinical responsiveness.
Price simulation
Figure 8 illustrated the results of the price simulation analysis across a range of cadonilimab pricing scenarios. In China, the ICER increased proportionally as the price varied from 2,000 per 625 mg dose. A similar trend was observed in the United States, where the price range examined ranged from 10,000 per 750 mg dose.
Price simulation: (A) China, (B) The U.S.
According to the respective WTP thresholds, cadonilimab would be considered cost-effective in China if the price was below 826.46 per 125 mg.
Scenario analysis
Scenario analysis evaluating a 3% discount rate for China showed the ICER of cadonilimab plus chemotherapy decreased to $48,678.70 per QALY, though the reduction was minimal (Table 7). For this scenario, PSA results indicated a 29.57% probability that the regimen would be cost-effective at China’s defined WTP threshold. Under PPP-adjusted currency conversion, the ICER of the combination regimen was 25,374.68 per QALY—still exceeding the PPP−aligned WTP of 20,243.85 per QALY (Table 7). PSA findings for this scenario showed a 24.86% probability of cost-effectiveness at the defined WTP threshold.
Sensitivity analysis
The OWSA results for the overall population and all subgroups in both China and the U.S. are presented in Figures 9–11. The ICER was most sensitive to variations in the cost of cadonilimab, utility values for the PFS and PD health states, and the proportion of patients receiving targeted therapy during subsequent treatment. Despite these sensitivities, the differences in health outcomes between treatment strategies were sufficiently large that parameter variations did not alter the overall conclusions, except in the CPS ≥5 subgroup in China, where the ICER was influenced by changes in drug cost and health state utilities.
The tornado diagram of one-way sensitivity analysis: (A) China, (B) The U.S.
The tornado diagram of one-way sensitivity analysis in CPS ≥5 group: (A) China, (B) The U.S.
The tornado diagram of one-way sensitivity analysis in CPS <5 group: (A) China, (B) The U.S.
The PSA findings are shown in Figures 12–17. In a Chinese setting, the probability that cadonilimab plus chemotherapy would be cost-effective at the defined WTP threshold was 23.35% for the overall cohort, 64.37% for the CPS ≥5 subgroup, and 3.20% for the CPS <5 subgroup. In the U.S., the corresponding probabilities were 2.30% for the overall cohort, 1.48% for the CPS ≥5 subgroup, and 0.09% for the CPS <5 subgroup. These results further support the conclusion that cadonilimab plus chemotherapy offers limited economic value at the current price.
The cost-effectiveness acceptability curve: (A) China, (B) The U.S.
The cost-effectiveness acceptability curve in CPS ≥5 group: (A) China, (B) The U.S.
The cost-effectiveness acceptability curve in CPS <5 group: (A) China, (B) The U.S.
The cost-effectiveness probabilistic scatter plot: (A) China, (B) The U.S.
The cost-effectiveness probabilistic scatter plot in CPS ≥5 group: (A) China, (B) The U.S.
The cost-effectiveness probabilistic scatter plot in CPS <5 group: (A) China, (B) The U.S.
Discussion
Cadonilimab, the first PD-1/CTLA-4 bispecific antibody approved for solid tumors, demonstrated notable clinical efficacy in improving both OS and PFS in patients with unresectable or metastatic GC/GEJC, as shown in the COMPASSION-15 trial. Results from a Bayesian network meta-analysis further supported its superiority: cadonilimab plus chemotherapy offered the greatest OS and PFS benefits among various ICI-based regimens, including nivolumab, pembrolizumab, sintilimab, tislelizumab, and sugemalimab, for HER2-negative GC/GEJC patients with positive PD-L1 CPS (36). This advancement marks a significant milestone in the era of bispecific antibodies for solid tumor immunotherapy and may reshape the global immunotherapy landscape.
Despite this clinical promise, our cost-effectiveness analysis revealed that cadonilimab plus chemotherapy is not economically viable as first-line treatment for most GC/GEJC patient groups in China under current or projected pricing. This conclusion was validated by scenario analyses: both PPP-adjusted currency conversion and a 3% discount rate (as a sensitivity check) confirmed the robustness of the base-case findings. Notably, however, the combination regimen was cost-effective in the PD-L1 CPS ≥5 subgroup—with an ICER of 40,354.27. Corresponding INHB and INMB values were also positive, further supporting the use of cadonilimab in this clinically responsive population.
This subgroup-specific value is particularly relevant in the Chinese healthcare context, where cadonilimab has already undergone significant price reductions: following the 2024 national medical insurance negotiations, it was included in the 2025 national medical insurance catalog for cervical cancer (effective January 1, 2025). While GC/GEJC were not included in this round due to timing constraints, the rapid approval and price reduction of cadonilimab offer meaningful hope for GC/GEJC patients. Our findings provide strong evidence to support its future inclusion in medical insurance for GC/GEJC. This aligns with the broader landscape of ICIs’ cost-effectiveness analysis in China: nivolumab and pembrolizumab have been shown to be uneconomical (37–39), while the economic value of tislelizumab, sugemalimab, and sintilimab remains controversial (33, 40–44) —consistent with our results.
Conversely, in the United States, the ICERs were 240,877.66, and 150,000.00 WTP threshold. This is consistent with prior findings that pembrolizumab, nivolumab, and tislelizumab also lack economic viability in the U.S. GC/GEJC setting (39, 45–47). Notably, our ICER for cadonilimab is relatively closer to the U.S. WTP threshold than other ICIs, suggesting that further Network Meta-analyses or real-world studies may help clarify its comparative economic value.
Although cadonilimab has already undergone significant price reductions in China, its price remains undetermined in many other markets. Ongoing global trade tensions and tariff policies, particularly between China and the U.S., add to pricing uncertainty, potentially limiting access to high-value cancer therapies. Our price simulation provides important insights into pricing thresholds that could render cadonilimab cost-effective: below 4,958.77 per cycle in the U.S. Clinically, given its demonstrated safety and efficacy advantages (and lack of obvious economic disadvantages in select subgroups), we recommend that physicians tailor treatment plans to patients’ disease profiles (e.g., PD-L1 status) and financial capacities—prioritizing the most effective regimens when affordable. These findings can inform health insurance reimbursement adjustments and guide drug tiering in clinical practice guidelines.
Sensitivity analyses identified the cost of cadonilimab and utility values for PFS and PD as the most influential parameters on the ICER, highlighting the critical role of drug pricing and patient quality of life in determining economic value. The very low cost-effectiveness probabilities observed in the PSA further validated the robustness of our base-case conclusions.
To our knowledge, this study is the first to assess the cost-effectiveness of cadonilimab, a second-generation PD-1 inhibitor, combined with chemotherapy as a first-line therapy for GC/GEJC from both the U.S. and Chinese payer perspectives. Importantly, key model parameters (e.g., utility values, costs of best supportive care, and end-of-life care) were derived from GC/GEJC-specific studies to minimize input uncertainty.
Nonetheless, this study has several limitations that must be acknowledged. First, the clinical trial data used for modeling were derived exclusively from a Chinese population, which may limit their applicability to U.S. healthcare systems. Second, the model was based on data from a controlled clinical trial, which introduced inherent uncertainty. Although real-world patients often receive multiple lines of therapy, our model incorporates only up to second-line treatment, potentially introducing bias. Lastly, subsequent treatment proportions were reported at the single-agent level, which may have affected the accuracy of the post-progression cost estimates. Future studies that incorporate broader real-world data are required to validate and refine these findings.
Conclusions
In China, cadonilimab combined with chemotherapy was cost-effective in patients with PD-L1 CPS ≥5, with an ICER of 40,354.27 per QALY. However, at current or projected prices, the therapy exceeded the WTP thresholds for all other subgroups in both China and the United States. These findings highlight the need to align clinical innovations with economic value to inform rational and equitable oncological treatment decisions.
The reference list from the paper itself. Each links out to its DOI / PubMed record.
- 1Smyth EC Nilsson M Grabsch H Ivan Grieken NC Lordick F. Gastric cancer. Lancet. (2020) 396:635–48. doi: 10.1016/s 0140-6736(20)31288-5, PMID: 32861308 · doi ↗ · pubmed ↗
- 2Sung H Ferlay J Siegel RL Laversanne M Soerjomataram I Jemal A. Global cancer statistics 2020: globocan estimates of incidence and mortality worldwide for 36 cancers in 185 countries. CA Cancer J Clin. (2021) 71:209–49. doi: 10.3322/caac.21660, PMID: 33538338 · doi ↗ · pubmed ↗
- 3Han B Zheng R Zeng H Wang S Sun K Chen R. Cancer incidence and mortality in China, 2022. J Natl Cancer Cent. (2024) 4:47–53. doi: 10.1016/j.jncc.2024.01.006, PMID: 39036382 PMC 11256708 · doi ↗ · pubmed ↗
- 4Siegel RL Kratzer TB Giaquinto AN Sung H Jemal A. Cancer statistics, 2025. CA Cancer J Clin. (2025) 75:10–45. doi: 10.3322/caac.21871, PMID: 39817679 PMC 11745215 · doi ↗ · pubmed ↗
- 5Van Cutsem E Bang YJ Feng-Yi F Xu JM Lee KW Jiao SC. Her 2 screening data from toga: targeting her 2 in gastric and gastroesophageal junction cancer. Gastric Cancer. (2015) 18:476–84. doi: 10.1007/s 10120-014-0402-y, PMID: 25038874 PMC 4511072 · doi ↗ · pubmed ↗
- 6Abrahao-Ma Chado LF Scapulatempo-Neto C. Her 2 testing in gastric cancer: an update. World J Gastroenterol. (2016) 22:4619–25. doi: 10.3748/wjg.v 22.i 19.4619, PMID: 27217694 PMC 4870069 · doi ↗ · pubmed ↗
- 7Rha SY Oh DY Yañez P Bai Y Ryu MH Lee J. Pembrolizumab plus chemotherapy versus placebo plus chemotherapy for her 2-negative advanced gastric cancer (Keynote-859): A multicentre, randomised, double-blind, phase 3 trial. Lancet Oncol. (2023) 24:1181–95. doi: 10.1016/s 1470-2045(23)00515-6, PMID: 37875143 · doi ↗ · pubmed ↗
- 8Qiu MZ Oh DY Kato K Arkenau T Tabernero J Correa MC. Tislelizumab plus chemotherapy versus placebo plus chemotherapy as first line treatment for advanced gastric or gastro-oesophageal junction adenocarcinoma: rationale-305 randomised, double blind, phase 3 trial. Bmj. (2024) 385:e 078876. doi: 10.1136/bmj-2023-078876, PMID: 38806195 · doi ↗ · pubmed ↗