Causal Effect of Pulmonary Hypertension on Brain Structure: A Mendelian Randomization Study Combined With Brain Magnetic Resonance Imaging
Anqi Liu, Hongyi Wang, Linfeng Xi, Jie Du, Jianping Wang, Yifei Ni, Shuai Zhang, Peiyao Zhang, Min Liu

TL;DR
This study finds that different types of pulmonary hypertension cause specific changes in brain structure, possibly through effects on immune cells.
Contribution
The study uses Mendelian randomization and brain MRI to identify causal links between PH subtypes and brain changes.
Findings
CTEPH is linked to changes in the entorhinal and inferior parietal surfaces of the brain.
PAH is associated with a decrease in cerebral white matter volume over time.
Immune cell changes may mediate the effects of PH on brain structure.
Abstract
Background: The causal effect of pulmonary hypertension (PH) on brain structures remains unknown. Our objective is to study the causal association between pulmonary arterial hypertension (PAH), chronic thromboembolic pulmonary hypertension (CTEPH), and brain structures using a Mendelian randomization approach combined with brain magnetic resonance imaging (MRI) and to analyze the mechanism by which PH affects the brain. Methods: We analyzed genome-wide association study results from 1,970 patients and 10,363 controls and from 277 patients and 316,345 controls for genetically predicted CTEPH and PAH, respectively. Brain MRI data from the ENIGMA consortium were included as outcomes. Inverse-variance weighting was used to estimate causal associations among CTEPH, PAH, and brain changes, accounting for heterogeneity and pleiotropy. Furthermore, network mediation estimations were performed…
Genes, proteins, chemicals, diseases, species, mutations and cell lines named across the full text — each resolved to its canonical identifier and authoritative record.
Click any figure to enlarge with its caption.
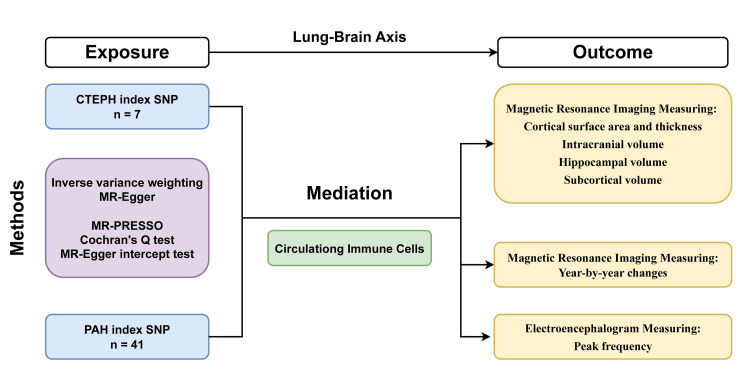 Figure 1
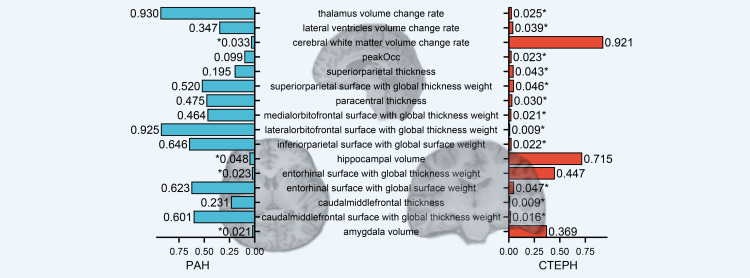 Figure 2
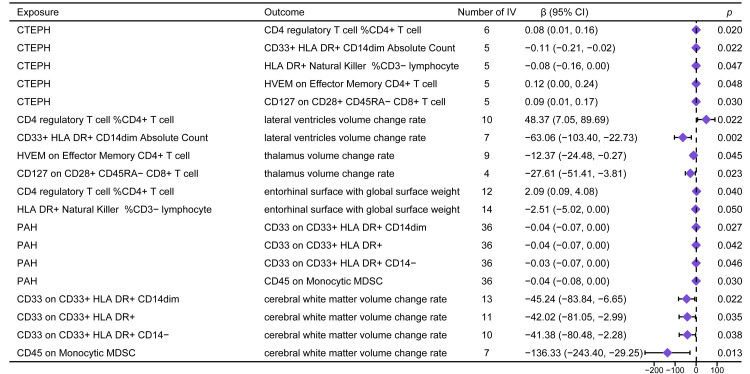 Figure 3
| Disease | SNP | Effect Allele | Other Allele | SE | P-value | Beta | EAF | Sample Size | R2 | F | Chromosome | Position | Gene |
| CTEPH | rs687289 | A | G | 0.05 | <0.001* | 0.59 | 0.66 | 12266 | 0.009 | 115.271 | 9 | 1.36E+08 | ABO |
| CTEPH | rs7659024 | A | G | 0.06 | <0.001* | 0.47 | 0.75 | 12266 | 0.006 | 69.166 | 4 | 1.56E+08 | FGG |
| CTEPH | rs2289252 | T | C | 0.05 | <0.001* | 0.26 | 0.60 | 12266 | 0.003 | 33.344 | 4 | 1.87E+08 | F11 |
| CTEPH | rs745849 | A | G | 0.05 | <0.001* | -0.27 | 0.57 | 12266 | 0.002 | 30.460 | 20 | 33572178 | MYH7B |
| CTEPH | rs17202899 | C | T | 0.09 | <0.001* | 0.47 | 0.90 | 12266 | 0.002 | 29.832 | 6 | 32434481 | HLA-DRA |
| CTEPH | rs78677622 | T | C | 0.07 | <0.001* | -0.36 | 0.87 | 12266 | 0.002 | 23.144 | 10 | 71196698 | TSPAN15 |
| CTEPH | rs2288904 | A | G | 0.06 | <0.001* | -0.27 | 0.79 | 12266 | 0.002 | 19.864 | 19 | 10742170 | SLC44A2 |
| PAH | rs2050070 | G | A | 0.08 | <0.001* | -0.35 | 0.64 | 316622 | <0.001 | 17.303 | 1 | 25178581 | RP4-706G24.1 |
| PAH | rs142224712 | A | C | 0.34 | <0.001* | 1.42 | 0.01 | 316622 | <0.001 | 17.800 | 1 | 42158536 | GUCA2B |
| PAH | rs115583922 | C | T | 0.34 | <0.001* | 1.43 | 0.01 | 316622 | <0.001 | 17.913 | 1 | 72730851 | RP4-660H19.1,RP4-660H19.2 |
| PAH | rs116489832 | C | T | 0.22 | <0.001* | -0.90 | 0.06 | 316622 | <0.001 | 17.237 | 1 | 1.03E+08 | RP5-936J12.1 |
| PAH | rs62197705 | A | G | 0.12 | <0.001* | 0.51 | 0.09 | 316622 | <0.001 | 17.833 | 2 | 1.87E+08 | ZC3H15 |
| PAH | rs13068772 | G | T | 0.09 | <0.001* | 0.39 | 0.22 | 316622 | <0.001 | 17.911 | 3 | 1.32E+08 | RP11-517B11.4 |
| PAH | rs13059247 | C | G | 0.10 | <0.001* | -0.43 | 0.24 | 316622 | <0.001 | 17.807 | 3 | 1.77E+08 | LINC00578 |
| PAH | rs74505239 | C | G | 0.13 | <0.001* | 0.52 | 0.09 | 316622 | <0.001 | 16.483 | 4 | 8107443 | ABLIM2 |
| PAH | rs10066505 | A | G | 0.11 | <0.001* | 0.46 | 0.13 | 316622 | <0.001 | 17.342 | 5 | 1.24E+08 | LINC01170 |
| PAH | rs55895438 | C | T | 0.19 | <0.001* | 0.86 | 0.03 | 316622 | <0.001 | 20.207 | 6 | 30615946 | PPP1R10 |
| PAH | rs56821023 | G | A | 0.08 | <0.001* | 0.35 | 0.38 | 316622 | <0.001 | 17.804 | 6 | 1.39E+08 | RP11-445F6.2 |
| PAH | rs55716205 | A | C | 0.09 | <0.001* | -0.38 | 0.72 | 316622 | <0.001 | 20.038 | 6 | 1.58E+08 | SNX9 |
| PAH | rs12666086 | G | T | 0.08 | <0.001* | -0.36 | 0.68 | 316622 | <0.001 | 18.910 | 7 | 1185888 | ZFAND2A-DT |
| PAH | rs6978470 | C | T | 0.09 | <0.001* | 0.37 | 0.24 | 316622 | <0.001 | 17.544 | 7 | 14131178 | DGKB |
| PAH | rs116997068 | T | G | 0.32 | <0.001* | 1.34 | 0.01 | 316622 | <0.001 | 17.535 | 7 | 24911277 | OSBPL3 |
| PAH | rs6955683 | C | T | 0.33 | <0.001* | 1.45 | 0.96 | 316622 | <0.001 | 18.846 | 7 | 81557568 | |
| PAH | rs141076809 | A | G | 0.33 | <0.001* | 1.41 | 0.01 | 316622 | <0.001 | 17.661 | 8 | 22383652 | SLC39A14 |
| PAH | rs185548465 | A | G | 0.20 | <0.001* | 0.90 | 0.04 | 316622 | <0.001 | 21.034 | 8 | 1.45E+08 | ARHGAP39 |
| PAH | rs68147517 | T | C | 0.12 | <0.001* | 0.47 | 0.11 | 316622 | <0.001 | 16.728 | 9 | 30090622 | ME2P1 |
| PAH | rs7079564 | C | T | 0.08 | <0.001* | 0.35 | 0.45 | 316622 | <0.001 | 17.840 | 10 | 1066326 | WDR37 |
| PAH | rs145221984 | T | C | 0.34 | <0.001* | 1.41 | 0.01 | 316622 | <0.001 | 17.713 | 10 | 8375042 | RP11-543F8.2 |
| PAH | rs72856766 | C | T | 0.14 | <0.001* | 0.57 | 0.07 | 316622 | <0.001 | 17.360 | 10 | 1.32E+08 | STK32C |
| PAH | rs59607164 | G | A | 0.13 | <0.001* | 0.54 | 0.07 | 316622 | <0.001 | 16.507 | 11 | 1.18E+08 | DSCAML1 |
| PAH | rs73084354 | G | A | 0.12 | <0.001* | -0.50 | 0.17 | 316622 | <0.001 | 16.656 | 12 | 27647471 | PPFIBP1 |
| PAH | rs144159880 | C | T | 0.70 | <0.001* | 2.89 | 0.00 | 316622 | <0.001 | 17.276 | 12 | 1.21E+08 | CAMKK2 |
| PAH | rs9510483 | T | C | 0.09 | <0.001* | 0.36 | 0.28 | 316622 | <0.001 | 17.119 | 13 | 22981200 | RP11-124N19.4 |
| PAH | rs9592653 | C | G | 0.13 | <0.001* | -0.58 | 0.16 | 316622 | <0.001 | 21.417 | 13 | 69749704 | KLHL1 |
| PAH | rs9590282 | C | T | 0.09 | <0.001* | 0.39 | 0.21 | 316622 | <0.001 | 17.249 | 13 | 95480236 | CLDN10,CLDN10-AS1 |
| PAH | rs79642892 | A | G | 0.19 | <0.001* | 0.79 | 0.03 | 316622 | <0.001 | 16.967 | 15 | 23470132 | GOLGA6L2 |
| PAH | rs2672691 | G | C | 0.12 | <0.001* | -0.49 | 0.90 | 316622 | <0.001 | 17.059 | 15 | 29288334 | FAM189A1 |
| PAH | rs117239581 | A | C | 0.27 | <0.001* | 1.12 | 0.01 | 316622 | <0.001 | 16.757 | 15 | 38116455 | RP11-346D14.1 |
| PAH | rs3826154 | G | A | 0.13 | <0.001* | -0.56 | 0.15 | 316622 | <0.001 | 18.784 | 16 | 69696652 | NFAT5 |
| PAH | rs139913752 | A | G | 0.37 | <0.001* | 1.56 | 0.00 | 316622 | <0.001 | 17.689 | 16 | 78317536 | WWOX |
| PAH | rs9901245 | G | C | 0.17 | <0.001* | 0.71 | 0.04 | 316622 | <0.001 | 17.278 | 17 | 1258809 | |
| PAH | rs150064101 | G | T | 0.31 | <0.001* | 1.32 | 0.01 | 316622 | <0.001 | 17.613 | 17 | 7917192 | RNF227 |
| PAH | rs141926054 | T | C | 0.18 | <0.001* | 0.79 | 0.03 | 316622 | <0.001 | 19.845 | 17 | 33960322 | ASIC2,CTC-304I17.6,RP11-17M24.3 |
| PAH | rs12949800 | T | A | 0.08 | <0.001* | -0.34 | 0.44 | 316622 | <0.001 | 17.070 | 17 | 73649150 | SDK2 |
| PAH | rs143202006 | G | A | 0.50 | <0.001* | 2.14 | 0.00 | 316622 | <0.001 | 18.581 | 18 | 25569497 | ZNF521 |
| PAH | rs116937793 | G | A | 0.27 | <0.001* | 1.11 | 0.01 | 316622 | <0.001 | 17.027 | 19 | 15856586 | CLEC4O |
| PAH | rs235370 | C | A | 0.15 | <0.001* | -0.63 | 0.11 | 316622 | <0.001 | 16.495 | 21 | 44870645 | PTTG1IP |
| PAH | rs9625243 | A | C | 0.09 | <0.001* | -0.40 | 0.75 | 316622 | <0.001 | 20.553 | 22 | 27484529 | RP11-46E17.6 |
| Outcome | IVW-Derived P-value | OR/β (95% CI) | Cochran's Q-derived P-value | MR Egger Intercept-Derived P-value | Global Test Derived From MR PRESSO |
| alphaCz | 0.911 | 0.00 (-0.04, 0.03) | 0.643 | 0.675 | 0.706 |
| alphaOcc | 0.920 | 0.00 (-0.04, 0.03) | 0.518 | 0.476 | 0.580 |
| betaCz | 0.966 | 0.00 (-0.04, 0.03) | 0.771 | 0.499 | 0.826 |
| deltaCz | 0.191 | -0.02 (-0.06, 0.01) | 0.996 | 0.984 | 0.998 |
| peakOcc | 0.023* | 0.04 (0.01, 0.08) | 0.370 | 0.353 | 0.434 |
| thetaCz | 0.363 | -0.02 (-0.05, 0.02) | 0.616 | 0.371 | 0.660 |
| hippocampal volume | 0.715 | 0.00 (-0.02, 0.01) | 0.275 | 0.090 | 0.292 |
| intracranial volume | 0.125 | -0.01 (-0.03, 0.00) | 0.137 | 0.530 | 0.212 |
| accumbens volume restricted | 0.811 | 0.00 (-0.03, 0.04) | 0.002* | 0.166 | 0.022* |
| accumbens volume unrestricted | 0.649 | 0.01 (-0.03, 0.05) | 0.003* | 0.190 | 0.037* |
| amygdala volume restricted | 0.379 | 0.01 (-0.02, 0.05) | 0.003* | 0.442 | 0.033* |
| amygdala volume unrestricted | 0.369 | 0.02 (-0.02, 0.06) | 0.001* | 0.495 | 0.031* |
| brainstem volume restricted | 0.795 | 0.00 (-0.02, 0.03) | 0.156 | 0.332 | 0.261 |
| brainstem volume unrestricted | 0.658 | 0.01 (-0.02, 0.04) | 0.053 | 0.251 | 0.114 |
| caudate volume restricted | 0.503 | 0.01 (-0.01, 0.02) | 0.604 | 0.189 | 0.559 |
| caudate volume unrestricted | 0.381 | 0.01 (-0.01, 0.03) | 0.364 | 0.112 | 0.398 |
| pallidum restricted | 0.765 | 0.00 (-0.02, 0.02) | 0.223 | 0.780 | 0.327 |
| pallidum unrestricted | 0.438 | 0.01 (-0.01, 0.03) | 0.225 | 0.661 | 0.364 |
| putamen restricted | 0.558 | 0.01 (-0.02, 0.04) | 0.006* | 0.759 | 0.041* |
| putamen unrestricted | 0.568 | 0.01 (-0.02, 0.05) | 0.004* | 0.587 | 0.036* |
| thalamus volume restricted | 0.444 | 0.01 (-0.01, 0.02) | 0.877 | 0.940 | 0.869 |
| thalamus volume unrestricted | 0.392 | 0.01 (-0.01, 0.03) | 0.739 | 0.811 | 0.711 |
| amygdala volume change rate from meta analysis | 0.182 | 0.88 (-0.41, 2.17) | 0.333 | 0.156 | 0.447 |
| caudate volume change rate from meta analysis | 0.758 | -0.26 (-1.95, 1.42) | 0.421 | 0.898 | 0.509 |
| cerebellum grey matter volume change rate from meta analysis | 0.663 | -4.63 (-25.46, 16.21) | 0.340 | 0.386 | 0.443 |
| cerebellum white matter volume change rate from meta analysis | 0.916 | 0.41 (-7.23, 8.05) | 0.532 | 0.834 | 0.461 |
| cerebral white matter volume change rate from meta analysis | 0.921 | -2.91 (-60.38, 54.55) | 0.776 | 0.435 | 0.661 |
| cortical grey matter volume change rate from meta analysis | 0.634 | 18.57 (-57.92, 95.07) | 0.587 | 0.130 | 0.499 |
| hippocampus volume change rate from meta analysis | 0.525 | 0.87 (-1.80, 3.54) | 0.052 | 0.152 | 0.102 |
| lateral ventricles volume change rate from meta analysis | 0.937 | 0.51 (-12.16, 13.19) | 0.404 | 0.076 | 0.384 |
| mean thickness from meta analysis | 0.452 | 0.14 (-0.23, 0.51) | 0.663 | 0.164 | 0.621 |
| nucleus accumbens volume change rate from meta analysis | 0.923 | -0.03 (-0.64, 0.58) | 0.961 | 0.472 | 0.966 |
| pallidum volume change rate from meta analysis | 0.951 | 0.04 (-1.34, 1.43) | 0.295 | 0.690 | 0.381 |
| putamen volume change rate from meta analysis | 0.120 | -2.03 (-4.58, 0.53) | 0.946 | 0.495 | 0.926 |
| surface area from meta analysis | 0.122 | -11.27 (-25.57, 3.02) | 0.929 | 0.420 | 0.933 |
| thalamus volume change rate from meta analysis | 0.395 | -1.17 (-3.85, 1.52) | 0.935 | 0.749 | 0.946 |
| total brain volume change rate from meta analysis | 0.495 | 42.07 (-78.87, 163.01) | 0.878 | 0.545 | 0.808 |
| amygdala volume change rate from meta regression using linear change | 0.813 | 0.49 (-3.59, 4.58) | 0.124 | 0.930 | 0.239 |
| caudate volume change rate from meta regression using linear change | 0.346 | -2.65 (-8.17, 2.86) | 0.039* | 0.502 | 0.090 |
| cerebellum grey matter volume change rate from meta regression using linear change | 0.695 | -9.53 (-57.13, 38.08) | 0.432 | 0.931 | 0.489 |
| cerebellum white matter volume change rate from meta regression using linear change | 0.561 | -5.52 (-24.14, 13.09) | 0.964 | 0.699 | 0.963 |
| cerebral white matter volume change rate from meta regression using linear change | 0.592 | -35.28 (-164.41, 93.85) | 0.713 | 0.648 | 0.711 |
| cortical grey matter volume change rate from meta regression using linear change | 0.495 | -114.13 (-441.98, 213.71) | 0.202 | 0.674 | 0.264 |
| hippocampus volume change rate from meta regression using linear change | 0.920 | -0.35 (-7.13, 6.43) | 0.015* | 0.156 | 0.048* |
| lateral ventricles volume change rate from meta regression using linear change | 0.039* | 22.56 (1.15, 43.97) | 0.798 | 0.801 | 0.830 |
| mean thickness from meta regression using linear change | 0.241 | -0.72 (-1.92, 0.48) | 0.641 | 0.876 | 0.664 |
| nucleus accumbens volume change rate from meta regression using linear change | 0.712 | -0.31 (-1.94, 1.33) | 0.500 | 0.190 | 0.586 |
| pallidum volume change rate from meta regression using linear change | 0.417 | -1.42 (-4.84, 2.01) | 0.525 | 0.373 | 0.443 |
| putamen volume change rate from meta regression using linear change | 0.861 | 0.54 (-5.52, 6.60) | 0.866 | 0.342 | 0.873 |
| surface area from meta regression using linear change | 0.209 | -27.64 (-70.81, 15.52) | 0.264 | 0.780 | 0.330 |
| thalamus volume change rate from meta regression using linear change | 0.025* | -7.64 (-14.31, -0.97) | 0.697 | 0.921 | 0.761 |
| total brain volume change rate from meta regression using linear change | 0.473 | -141.77 (-529.31, 245.77) | 0.296 | 0.684 | 0.349 |
| amygdala volume change rate from meta regression using quadratic change | 0.714 | 1.04 (-4.54, 6.63) | 0.430 | 0.226 | 0.507 |
| caudate volume change rate from meta regression using quadratic change | 0.309 | -3.58 (-10.46, 3.31) | 0.710 | 0.132 | 0.644 |
| cerebellum grey matter volume change rate from meta regression using quadratic change | 0.396 | -54.32 (-179.61, 70.98) | 0.019* | 0.574 | 0.060 |
| cerebellum white matter volume change rate from meta regression using quadratic change | 0.262 | -23.78 (-65.31, 17.75) | 0.260 | 0.086 | 0.311 |
| cerebral white matter volume change rate from meta regression using quadratic change | 0.664 | -63.20 (-348.62, 222.23) | 0.128 | 0.933 | 0.177 |
| cortical grey matter volume change rate from meta regression using quadratic change | 0.521 | -143.24 (-580.81, 294.33) | 0.745 | 0.987 | 0.751 |
| hippocampus volume change rate from meta regression using quadratic change | 0.951 | 0.36 (-11.00, 11.71) | 0.028* | 0.485 | 0.088 |
| lateral ventricles volume change rate from meta regression using quadratic change | 0.151 | 32.10 (-11.69, 75.88) | 0.505 | 0.871 | 0.598 |
| mean thickness from meta regression using quadratic change | 0.168 | -1.37 (-3.31, 0.58) | 0.975 | 0.602 | 0.976 |
| nucleus accumbens volume change rate from meta regression using quadratic change | 0.857 | -0.33 (-3.89, 3.24) | 0.161 | 0.144 | 0.201 |
| pallidum volume change rate from meta regression using quadratic change | 0.904 | -0.40 (-7.00, 6.19) | 0.348 | 0.450 | 0.440 |
| putamen volume change rate from meta regression using quadratic change | 0.764 | -2.20 (-16.57, 12.16) | 0.116 | 0.632 | 0.177 |
| surface area from meta regression using quadratic change | 0.847 | 8.20 (-75.24, 91.64) | 0.126 | 0.740 | 0.184 |
| thalamus volume change rate from meta regression using quadratic change | 0.127 | -9.15 (-20.90, 2.61) | 0.795 | 0.637 | 0.833 |
| total brain volume change rate from meta regression using quadratic change | 0.187 | -446.15 (-1109.33, 217.03) | 0.225 | 0.966 | 0.324 |
| bankssts surface | 0.869 | 0.31 (-3.32, 3.93) | 0.046* | 0.742 | 0.090 |
| bankssts thickness | 0.821 | 0.00 (0.00, 0.01) | 0.005* | 0.983 | 0.041* |
| caudalanteriorcingulate surface | 0.809 | 0.37 (-2.62, 3.36) | 0.082 | 0.750 | 0.160 |
| caudalanteriorcingulate thickness | 0.094 | 0.00 (-0.01, 0.00) | 0.740 | 0.896 | 0.662 |
| caudalmiddlefrontal surface | 0.986 | 0.06 (-6.50, 6.62) | 0.317 | 0.679 | 0.406 |
| caudalmiddlefrontal thickness | 0.009* | 0.00 (-0.01, 0.00) | 0.332 | 0.166 | 0.288 |
| cuneus surface | 0.113 | -2.90 (-6.49, 0.69) | 0.323 | 0.844 | 0.452 |
| cuneus thickness | 0.541 | 0.00 (0.00, 0.00) | 0.909 | 0.955 | 0.906 |
| entorhinal surface | 0.406 | 0.93 (-1.26, 3.11) | 0.008* | 0.964 | 0.045* |
| entorhinal thickness | 0.257 | 0.00 (-0.01, 0.00) | 0.737 | 0.316 | 0.772 |
| frontalpole surface | 0.447 | -0.34 (-1.21, 0.53) | 0.042* | 0.644 | 0.116 |
| frontalpole thickness | 0.919 | 0.00 (0.00, 0.00) | 0.413 | 0.185 | 0.420 |
| Full surface | 0.586 | -135.59 (-623.98, 352.79) | 0.002* | 0.963 | 0.017* |
| Full thickness | 0.204 | 0.00 (0.00, 0.00) | 0.474 | 0.316 | 0.563 |
| fusiform surface | 0.538 | -3.56 (-14.91, 7.78) | 0.008* | 0.966 | 0.048* |
| fusiform thickness | 0.926 | 0.00 (0.00, 0.00) | 0.228 | 0.444 | 0.284 |
| inferiorparietal surface | 0.750 | 3.21 (-16.55, 22.98) | 0.005* | 0.953 | 0.025* |
| inferiorparietal thickness | 0.345 | 0.00 (0.00, 0.00) | 0.810 | 0.552 | 0.864 |
| inferiortemporal surface | 0.844 | -1.46 (-15.99, 13.08) | 0.001* | 0.933 | 0.013* |
| inferiortemporal thickness | 0.764 | 0.00 (0.00, 0.00) | 0.761 | 0.251 | 0.811 |
| insula surface | 0.271 | -2.63 (-7.31, 2.05) | 0.272 | 0.701 | 0.370 |
| insula thickness | 0.622 | 0.00 (0.00, 0.00) | 0.048* | 0.089 | 0.102 |
| isthmuscingulate surface | 0.400 | -1.27 (-4.21, 1.68) | 0.276 | 0.883 | 0.348 |
| isthmuscingulate thickness | 0.872 | 0.00 (0.00, 0.00) | 0.428 | 0.792 | 0.533 |
| lateraloccipital surface | 0.340 | -6.61 (-20.20, 6.98) | 0.055 | 0.851 | 0.151 |
| lateraloccipital thickness | 0.380 | 0.00 (0.00, 0.00) | 0.386 | 0.495 | 0.484 |
| lateralorbitofrontal surface | 0.477 | -3.25 (-12.21, 5.71) | 0.005* | 0.821 | 0.044* |
| lateralorbitofrontal thickness | 0.271 | 0.00 (0.00, 0.00) | 0.518 | 0.137 | 0.458 |
| lingual surface | 0.152 | -4.83 (-11.44, 1.78) | 0.613 | 0.619 | 0.611 |
| lingual thickness | 0.389 | 0.00 (0.00, 0.00) | 0.711 | 0.764 | 0.752 |
| medialorbitofrontal surface | 0.520 | -2.52 (-10.22, 5.17) | 0.000* | 0.951 | 0.005* |
| medialorbitofrontal thickness | 0.157 | 0.00 (0.00, 0.00) | 0.863 | 0.400 | 0.873 |
| middletemporal surface | 0.652 | -2.50 (-13.35, 8.36) | 0.023* | 0.692 | 0.062 |
| middletemporal thickness | 0.853 | 0.00 (0.00, 0.00) | 0.737 | 0.442 | 0.808 |
| paracentral surface | 0.437 | -1.83 (-6.44, 2.78) | 0.082 | 0.454 | 0.165 |
| paracentral thickness | 0.030* | 0.00 (-0.01, 0.00) | 0.310 | 0.214 | 0.333 |
| parahippocampal surface | 0.382 | -1.04 (-3.36, 1.29) | 0.071 | 0.752 | 0.142 |
| parahippocampal thickness | 0.982 | 0.00 (-0.01, 0.01) | 0.002* | 0.765 | 0.024* |
| parsopercularis surface | 0.721 | 0.95 (-4.27, 6.17) | 0.085 | 0.973 | 0.172 |
| parsopercularis thickness | 0.707 | 0.00 (0.00, 0.00) | 0.381 | 0.681 | 0.396 |
| parsorbitalis surface | 0.529 | -0.95 (-3.91, 2.01) | 0.001* | 0.605 | 0.014* |
| parsorbitalis thickness | 0.213 | 0.00 (-0.01, 0.00) | 0.072 | 0.060 | 0.129 |
| parstriangularis surface | 0.928 | 0.24 (-4.96, 5.44) | 0.033* | 0.979 | 0.101 |
| parstriangularis thickness | 0.758 | 0.00 (0.00, 0.00) | 0.367 | 0.285 | 0.466 |
| pericalcarine surface | 0.343 | -2.03 (-6.21, 2.16) | 0.364 | 0.654 | 0.494 |
| pericalcarine thickness | 0.320 | 0.00 (0.00, 0.00) | 0.354 | 0.785 | 0.416 |
| postcentral surface | 0.545 | -3.69 (-15.63, 8.26) | 0.042* | 0.665 | 0.138 |
| postcentral thickness | 0.941 | 0.00 (0.00, 0.00) | 0.573 | 0.584 | 0.592 |
| posteriorcingulate surface | 0.527 | -1.70 (-6.99, 3.58) | 0.002* | 0.935 | 0.015* |
| posteriorcingulate thickness | 0.183 | 0.00 (-0.01, 0.00) | 0.155 | 0.094 | 0.205 |
| precentral surface | 0.914 | -0.74 (-14.24, 12.75) | 0.031* | 0.448 | 0.091 |
| precentral thickness | 0.532 | 0.00 (0.00, 0.00) | 0.438 | 0.304 | 0.459 |
| precuneus surface | 0.202 | -10.79 (-27.35, 5.78) | 0.000* | 0.630 | 0.001* |
| precuneus thickness | 0.683 | 0.00 (0.00, 0.00) | 0.950 | 0.807 | 0.939 |
| rostralanteriorcingulate surface | 0.339 | -2.30 (-7.00, 2.41) | 0.001* | 0.736 | 0.016* |
| rostralanteriorcingulate thickness | 0.322 | 0.00 (0.00, 0.01) | 0.661 | 0.659 | 0.781 |
| rostralmiddlefrontal surface | 0.459 | -8.05 (-29.35, 13.25) | 0.009* | 0.864 | 0.043* |
| rostralmiddlefrontal thickness | 0.134 | 0.00 (0.00, 0.00) | 0.742 | 0.631 | 0.684 |
| superiorfrontal surface | 0.412 | -8.42 (-28.55, 11.71) | 0.042* | 0.658 | 0.123 |
| superiorfrontal thickness | 0.103 | 0.00 (0.00, 0.00) | 0.394 | 0.208 | 0.392 |
| superiorparietal surface | 0.111 | -9.31 (-20.77, 2.15) | 0.296 | 0.557 | 0.366 |
| superiorparietal thickness | 0.043* | 0.00 (0.00, 0.00) | 0.998 | 0.972 | 0.998 |
| superiortemporal surface | 0.287 | -6.77 (-19.24, 5.70) | 0.006* | 0.920 | 0.042* |
| superiortemporal thickness | 0.798 | 0.00 (0.00, 0.00) | 0.086 | 0.731 | 0.175 |
| supramarginal surface | 0.704 | -3.37 (-20.78, 14.04) | 0.001* | 0.921 | 0.011* |
| supramarginal thickness | 0.080 | 0.00 (0.00, 0.00) | 0.650 | 0.332 | 0.660 |
| temporalpole surface | 0.901 | -0.09 (-1.46, 1.29) | 0.047* | 0.368 | 0.114 |
| temporalpole thickness | 0.400 | 0.00 (-0.01, 0.00) | 0.362 | 0.134 | 0.408 |
| transversetemporal surface | 0.604 | -0.39 (-1.88, 1.09) | 0.098 | 0.798 | 0.178 |
| transversetemporal thickness | 0.216 | 0.00 (-0.01, 0.00) | 0.244 | 0.105 | 0.240 |
| bankssts surface with global surface weight | 0.152 | 1.69 (-0.62, 4.01) | 0.220 | 0.725 | 0.342 |
| caudalanteriorcingulate surface with global surface weight | 0.116 | 1.40 (-0.34, 3.14) | 0.876 | 0.406 | 0.892 |
| caudalmiddlefrontal surface with global surface weight | 0.528 | 1.92 (-4.06, 7.91) | 0.133 | 0.712 | 0.191 |
| cuneus surface with global surface weight | 0.672 | -0.57 (-3.21, 2.07) | 0.528 | 0.876 | 0.614 |
| entorhinal surface with global surface weight | 0.047* | 1.13 (0.01, 2.25) | 0.405 | 0.800 | 0.472 |
| frontalpole surface with global surface weight | 0.850 | -0.06 (-0.65, 0.54) | 0.257 | 0.340 | 0.290 |
| fusiform surface with global surface weight | 0.788 | -0.60 (-4.98, 3.78) | 0.872 | 0.746 | 0.901 |
| inferiorparietal surface with global surface weight | 0.022* | 10.98 (1.59, 20.37) | 0.162 | 0.776 | 0.269 |
| inferiortemporal surface with global surface weight | 0.419 | 2.21 (-3.15, 7.58) | 0.324 | 0.535 | 0.380 |
| insula surface with global surface weight | 0.541 | -1.19 (-5.01, 2.63) | 0.145 | 0.490 | 0.254 |
| isthmuscingulate surface with global surface weight | 0.997 | 0.00 (-2.16, 2.15) | 0.326 | 0.807 | 0.390 |
| lateraloccipital surface with global surface weight | 0.689 | -1.35 (-7.94, 5.25) | 0.550 | 0.486 | 0.607 |
| lateralorbitofrontal surface with global surface weight | 0.318 | -1.64 (-4.85, 1.58) | 0.593 | 0.559 | 0.502 |
| lingual surface with global surface weight | 0.648 | -1.44 (-7.62, 4.74) | 0.237 | 0.581 | 0.344 |
| medialorbitofrontal surface with global surface weight | 0.605 | -0.71 (-3.41, 1.99) | 0.271 | 0.956 | 0.408 |
| middletemporal surface with global surface weight | 0.454 | 1.80 (-2.91, 6.50) | 0.304 | 0.734 | 0.442 |
| paracentral surface with global surface weight | 0.788 | -0.36 (-2.95, 2.24) | 0.453 | 0.207 | 0.453 |
| parahippocampal surface with global surface weight | 0.406 | -0.57 (-1.91, 0.77) | 0.967 | 0.688 | 0.962 |
| parsopercularis surface with global surface weight | 0.284 | 1.68 (-1.39, 4.76) | 0.679 | 0.820 | 0.654 |
| parsorbitalis surface with global surface weight | 0.624 | -0.34 (-1.71, 1.03) | 0.153 | 0.248 | 0.222 |
| parstriangularis surface with global surface weight | 0.339 | 1.39 (-1.46, 4.25) | 0.567 | 0.813 | 0.546 |
| pericalcarine surface with global surface weight | 0.890 | -0.28 (-4.27, 3.71) | 0.264 | 0.675 | 0.360 |
| postcentral surface with global surface weight | 0.951 | 0.17 (-5.25, 5.58) | 0.311 | 0.221 | 0.320 |
| posteriorcingulate surface with global surface weight | 0.955 | -0.06 (-2.23, 2.11) | 0.318 | 0.848 | 0.449 |
| precentral surface with global surface weight | 0.318 | 3.77 (-3.63, 11.18) | 0.154 | 0.091 | 0.204 |
| precuneus surface with global surface weight | 0.079 | -6.28 (-13.30, 0.73) | 0.079 | 0.187 | 0.157 |
| rostralanteriorcingulate surface with global surface weight | 0.243 | -1.20 (-3.21, 0.81) | 0.215 | 0.365 | 0.328 |
| rostralmiddlefrontal surface with global surface weight | 0.369 | -3.35 (-10.66, 3.96) | 0.367 | 0.636 | 0.397 |
| superiorfrontal surface with global surface weight | 0.715 | -1.31 (-8.34, 5.72) | 0.492 | 0.334 | 0.415 |
| superiorparietal surface with global surface weight | 0.551 | -3.07 (-13.14, 7.01) | 0.076 | 0.545 | 0.155 |
| superiortemporal surface with global surface weight | 0.501 | -1.83 (-7.17, 3.50) | 0.142 | 0.953 | 0.252 |
| supramarginal surface with global surface weight | 0.820 | 0.87 (-6.63, 8.36) | 0.128 | 0.895 | 0.206 |
| temporalpole surface with global surface weight | 0.507 | 0.31 (-0.61, 1.23) | 0.307 | 0.139 | 0.356 |
| transversetemporal surface with global surface weight | 0.947 | 0.03 (-0.86, 0.92) | 0.441 | 0.691 | 0.580 |
| bankssts surface with global thickness weight | 0.423 | 0.00 (0.00, 0.01) | 0.002* | 0.442 | 0.034* |
| caudalanteriorcingulate surface with global thickness weight | 0.188 | 0.00 (-0.01, 0.00) | 0.656 | 0.624 | 0.622 |
| caudalmiddlefrontal surface with global thickness weight | 0.016* | 0.00 (0.00, 0.00) | 0.401 | 0.353 | 0.365 |
| cuneus surface with global thickness weight | 0.644 | 0.00 (0.00, 0.00) | 0.616 | 0.419 | 0.681 |
| entorhinal surface with global thickness weight | 0.447 | 0.00 (-0.01, 0.00) | 0.452 | 0.176 | 0.519 |
| frontalpole surface with global thickness weight | 0.689 | 0.00 (0.00, 0.01) | 0.156 | 0.057 | 0.186 |
| fusiform surface with global thickness weight | 0.373 | 0.00 (0.00, 0.00) | 0.216 | 0.896 | 0.282 |
| inferiorparietal surface with global thickness weight | 0.721 | 0.00 (0.00, 0.00) | 0.781 | 0.914 | 0.815 |
| inferiortemporal surface with global thickness weight | 0.226 | 0.00 (0.00, 0.00) | 0.691 | 0.422 | 0.743 |
| insula surface with global thickness weight | 0.778 | 0.00 (0.00, 0.00) | 0.038* | 0.138 | 0.094 |
| isthmuscingulate surface with global thickness weight | 0.813 | 0.00 (0.00, 0.00) | 0.458 | 0.438 | 0.511 |
| lateraloccipital surface with global thickness weight | 0.816 | 0.00 (0.00, 0.00) | 0.293 | 0.829 | 0.429 |
| lateralorbitofrontal surface with global thickness weight | 0.009* | 0.00 (0.00, 0.00) | 0.603 | 0.216 | 0.553 |
| lingual surface with global thickness weight | 0.663 | 0.00 (0.00, 0.00) | 0.796 | 0.664 | 0.846 |
| medialorbitofrontal surface with global thickness weight | 0.021* | 0.00 (0.00, 0.01) | 0.970 | 0.660 | 0.974 |
| middletemporal surface with global thickness weight | 0.625 | 0.00 (0.00, 0.00) | 0.162 | 0.947 | 0.257 |
| paracentral surface with global thickness weight | 0.098 | 0.00 (0.00, 0.00) | 0.200 | 0.705 | 0.234 |
| parahippocampal surface with global thickness weight | 0.870 | 0.00 (-0.01, 0.01) | 0.003* | 0.608 | 0.041* |
| parsopercularis surface with global thickness weight | 0.576 | 0.00 (0.00, 0.00) | 0.398 | 0.794 | 0.429 |
| parsorbitalis surface with global thickness weight | 0.252 | 0.00 (0.00, 0.00) | 0.279 | 0.098 | 0.359 |
| parstriangularis surface with global thickness weight | 0.696 | 0.00 (0.00, 0.00) | 0.667 | 0.629 | 0.765 |
| pericalcarine surface with global thickness weight | 0.486 | 0.00 (0.00, 0.00) | 0.169 | 0.478 | 0.206 |
| postcentral surface with global thickness weight | 0.398 | 0.00 (0.00, 0.00) | 0.870 | 0.557 | 0.884 |
| posteriorcingulate surface with global thickness weight | 0.207 | 0.00 (0.00, 0.00) | 0.216 | 0.211 | 0.250 |
| precentral surface with global thickness weight | 0.907 | 0.00 (0.00, 0.00) | 0.755 | 0.831 | 0.685 |
| precuneus surface with global thickness weight | 0.384 | 0.00 (0.00, 0.00) | 0.630 | 0.218 | 0.628 |
| rostralanteriorcingulate surface with global thickness weight | 0.104 | 0.00 (0.00, 0.01) | 0.534 | 0.986 | 0.649 |
| rostralmiddlefrontal surface with global thickness weight | 0.533 | 0.00 (0.00, 0.00) | 0.765 | 0.803 | 0.765 |
| superiorfrontal surface with global thickness weight | 0.306 | 0.00 (0.00, 0.00) | 0.605 | 0.598 | 0.532 |
| superiorparietal surface with global thickness weight | 0.046* | 0.00 (0.00, 0.00) | 0.609 | 0.219 | 0.604 |
| superiortemporal surface with global thickness weight | 0.242 | 0.00 (0.00, 0.00) | 0.083 | 0.465 | 0.146 |
| supramarginal surface with global thickness weight | 0.249 | 0.00 (0.00, 0.00) | 0.220 | 0.762 | 0.330 |
| temporalpole surface with global thickness weight | 0.730 | 0.00 (-0.01, 0.00) | 0.322 | 0.230 | 0.374 |
| transversetemporal surface with global thickness weight | 0.439 | 0.00 (-0.01, 0.00) | 0.181 | 0.160 | 0.229 |
| Outcome | IVW-Derived P-value | β (95% CI) | Cochran's Q-Derived P-value | MR Egger Intercept-Derived P-value | Global Test Derived From MR PRESSO |
| alphaCz | 0.326 | -0.01 (-0.04, 0.01) | 0.408 | 0.142 | 0.533 |
| alphaOcc | 0.253 | -0.01 (-0.04, 0.01) | 0.724 | 0.475 | 0.824 |
| betaCz | 0.360 | -0.01 (-0.04, 0.01) | 0.647 | 0.458 | 0.738 |
| deltaCz | 0.246 | -0.02 (-0.05, 0.01) | 0.073 | 0.608 | 0.132 |
| peakOcc | 0.099 | 0.03 (-0.01, 0.06) | 0.066 | 0.286 | 0.151 |
| thetaCz | 0.464 | -0.01 (-0.04, 0.02) | 0.098 | 0.241 | 0.124 |
| hippocampal volume | 0.048* | 0.00 (0.00, 0.01) | 0.108 | 0.741 | 0.281 |
| intracranial volume | 0.702 | 0.00 (-0.00, 0.01) | 0.142 | 0.991 | 0.312 |
| accumbens volume restricted | 0.555 | 0.00 (-0.01, 0.02) | 0.003* | 0.752 | 0.030* |
| accumbens volume unrestricted | 0.506 | 0.00 (-0.01, 0.02) | 0.010* | 0.945 | 0.048* |
| amygdala volume restricted | 0.118 | 0.01 (-0.00, 0.02) | 0.074 | 0.495 | 0.117 |
| amygdala volume unrestricted | 0.021* | 0.01 (0.00, 0.02) | 0.378 | 0.378 | 0.435 |
| brainstem volume restricted | 0.886 | -0.00 (-0.01, 0.01) | 0.475 | 0.842 | 0.517 |
| brainstem volume unrestricted | 0.773 | 0.00 (-0.01, 0.01) | 0.264 | 0.840 | 0.356 |
| caudate volume restricted | 0.317 | 0.00 (-0.00, 0.01) | 0.571 | 0.499 | 0.461 |
| caudate volume unrestricted | 0.182 | 0.01 (-0.00, 0.02) | 0.328 | 0.623 | 0.218 |
| pallidum restricted | 0.415 | -0.00 (-0.01, 0.01) | 0.473 | 0.953 | 0.567 |
| pallidum unrestricted | 0.753 | -0.00 (-0.01, 0.01) | 0.452 | 0.884 | 0.491 |
| putamen restricted | 0.312 | 0.01 (-0.01, 0.02) | 0.013* | 0.575 | 0.048* |
| putamen unrestricted | 0.155 | 0.01 (-0.00, 0.03) | 0.004* | 0.700 | 0.014* |
| thalamus volume restricted | 0.758 | 0.00 (-0.01, 0.01) | 0.347 | 0.907 | 0.251 |
| thalamus volume unrestricted | 0.590 | 0.00 (-0.01, 0.01) | 0.322 | 0.847 | 0.252 |
| amygdala volume change rate from meta analysis | 0.998 | 0.00 (-0.84, 0.84) | 0.658 | 0.213 | 0.828 |
| caudate volume change rate from meta analysis | 0.736 | -0.32 (-2.18, 1.54) | 0.001* | 0.846 | 0.007* |
| cerebellum grey matter volume change rate from meta analysis | 0.631 | 3.37 (-10.38, 17.12) | 0.486 | 0.396 | 0.408 |
| cerebellum white matter volume change rate from meta analysis | 0.332 | -2.99 (-9.03, 3.05) | 0.237 | 0.197 | 0.124 |
| cerebral white matter volume change rate from meta analysis | 0.033 | -52.72 (-101.21, -4.24) | 0.121 | 0.496 | 0.186 |
| cortical grey matter volume change rate from meta analysis | 0.305 | 39.31(-35.82, 114.44) | 0.014* | 0.877 | 0.005* |
| hippocampus volume change rate from meta analysis | 0.183 | -0.91 (-2.26, 0.43) | 0.388 | 0.166 | 0.583 |
| lateral ventricles volume change rate from meta analysis | 0.236 | -5.43 (-14.42, 3.56) | 0.508 | 0.272 | 0.210 |
| mean thickness from meta analysis | 0.457 | 0.14 (-0.23, 0.52) | 0.008* | 0.586 | 0.001* |
| nucleus accumbens volume change rate from meta analysis | 0.496 | -0.15 (-0.57, 0.28) | 0.786 | 0.575 | 0.775 |
| pallidum volume change rate from meta analysis | 0.692 | -0.18 (-1.06, 0.71) | 0.423 | 0.291 | 0.461 |
| putamen volume change rate from meta analysis | 0.182 | 1.45 (-0.68, 3.59) | 0.118 | 0.710 | 0.083 |
| surface area from meta analysis | 0.653 | -2.49 (-13.35, 8.37) | 0.263 | 0.433 | 0.151 |
| thalamus volume change rate from meta analysis | 0.285 | 1.01 (-0.85, 2.87) | 0.753 | 0.580 | 0.665 |
| total brain volume change rate from meta analysis | 0.600 | 23.31 (-63.85, 110.46) | 0.385 | 0.319 | 0.175 |
| amygdala volume change rate from meta regression using linear change | 0.593 | 0.62 (-1.66, 2.91) | 0.757 | 0.264 | 0.573 |
| caudate volume change rate from meta regression using linear change | 0.925 | -0.15 (-3.15, 2.86) | 0.245 | 0.527 | 0.417 |
| cerebellum grey matter volume change rate from meta regression using linear change | 0.780 | -6.99 (-55.94, 41.97) | 0.022* | 0.641 | 0.060 |
| cerebellum white matter volume change rate from meta regression using linear change | 0.999 | -0.01 (-13.63, 13.62) | 0.818 | 0.139 | 0.895 |
| cerebral white matter volume change rate from meta regression using linear change | 0.100 | -81.00 (-177.49, 15.49) | 0.581 | 0.242 | 0.618 |
| cortical grey matter volume change rate from meta regression using linear change | 0.939 | 10.06 (-245.98, 266.10) | 0.086 | 0.590 | 0.095 |
| hippocampus volume change rate from meta regression using linear change | 0.055 | -3.09 (-6.24, 0.06) | 0.391 | 0.751 | 0.363 |
| lateral ventricles volume change rate from meta regression using linear change | 0.347 | -7.70 (-23.75, 8.36) | 0.633 | 0.595 | 0.506 |
| mean thickness from meta regression using linear change | 0.663 | 0.30 (-1.04, 1.64) | 0.006* | 0.836 | 0.012* |
| nucleus accumbens volume change rate from meta regression using linear change | 0.695 | -0.27 (-1.63, 1.09) | 0.198 | 0.464 | 0.313 |
| pallidum volume change rate from meta regression using linear change | 0.984 | -0.03 (-2.52, 2.47) | 0.971 | 0.604 | 0.975 |
| putamen volume change rate from meta regression using linear change | 0.877 | 0.48 (-5.57, 6.53) | 0.023* | 0.739 | 0.006* |
| surface area from meta regression using linear change | 0.643 | 6.80 (-21.98, 35.58) | 0.378 | 0.364 | 0.378 |
| thalamus volume change rate from meta regression using linear change | 0.930 | 0.22 (-4.61, 5.04) | 0.944 | 0.317 | 0.901 |
| total brain volume change rate from meta regression using linear change | 0.928 | -14.83 (-338.48, 308.82) | 0.105 | 0.689 | 0.170 |
| amygdala volume change rate from meta regression using quadratic change | 0.564 | 1.39 (-3.33, 6.11) | 0.150 | 0.772 | 0.082 |
| caudate volume change rate from meta regression using quadratic change | 0.176 | 3.44 (-1.54, 8.42) | 0.673 | 0.290 | 0.727 |
| cerebellum grey matter volume change rate from meta regression using quadratic change | 0.459 | -21.98 (-80.18, 36.22) | 0.839 | 0.487 | 0.922 |
| cerebellum white matter volume change rate from meta regression using quadratic change | 0.720 | -4.76 (-30.76, 21.24) | 0.772 | 0.373 | 0.641 |
| cerebral white matter volume change rate from meta regression using quadratic change | 0.702 | -45.17 (-276.50, 186.15) | 0.020* | 0.147 | 0.059 |
| cortical grey matter volume change rate from meta regression using quadratic change | 0.601 | 105.23 (-289.04, 499.50) | 0.122 | 0.188 | 0.263 |
| hippocampus volume change rate from meta regression using quadratic change | 0.087 | -4.71 (-10.09, 0.68) | 0.579 | 0.692 | 0.758 |
| lateral ventricles volume change rate from meta regression using quadratic change | 0.167 | -26.09 (-63.11, 10.92) | 0.234 | 0.598 | 0.087 |
| mean thickness from meta regression using quadratic change | 0.361 | 0.88 (-1.00, 2.76) | 0.057 | 0.546 | 0.110 |
| nucleus accumbens volume change rate from meta regression using quadratic change | 0.368 | -0.95 (-3.00, 1.11) | 0.969 | 0.821 | 0.994 |
| pallidum volume change rate from meta regression using quadratic change | 0.715 | 0.83 (-3.64, 5.30) | 0.735 | 0.241 | 0.779 |
| putamen volume change rate from meta regression using quadratic change | 0.549 | 2.96 (-6.72, 12.63) | 0.097 | 0.218 | 0.050 |
| surface area from meta regression using quadratic change | 0.369 | 25.81 (-30.45, 82.06) | 0.128 | 0.082 | 0.178 |
| thalamus volume change rate from meta regression using quadratic change | 0.225 | 5.20 (-3.19, 13.60) | 0.790 | 0.765 | 0.539 |
| total brain volume change rate from meta regression using quadratic change | 0.884 | 38.53 (-477.26, 554.32) | 0.116 | 0.132 | 0.203 |
| bankssts surface | 0.146 | 0.95 (-0.33, 2.23) | 0.824 | 0.462 | 0.792 |
| bankssts thickness | 0.733 | 0.00 (-0.00, 0.00) | 0.623 | 0.598 | 0.706 |
| caudalanteriorcingulate surface | 0.769 | 0.17 (-0.96, 1.30) | 0.428 | 0.728 | 0.549 |
| caudalanteriorcingulate thickness | 0.947 | 0.00 (-0.00, 0.00) | 0.048* | 0.765 | 0.150 |
| caudalmiddlefrontal surface | 0.329 | 2.17 (-2.19, 6.52) | 0.007* | 0.769 | 0.011* |
| caudalmiddlefrontal thickness | 0.231 | 0.00 (-0.00, 0.00) | 0.061 | 0.686 | 0.120 |
| cuneus surface | 0.080 | 1.56 (-0.19, 3.30) | 0.825 | 0.811 | 0.879 |
| cuneus thickness | 0.640 | 0.00 (-0.00, 0.00) | 0.048* | 0.942 | 0.114 |
| entorhinal surface | 0.959 | 0.02 (-0.69, 0.73) | 0.236 | 0.603 | 0.427 |
| entorhinal thickness | 0.070 | -0.00 (-0.01, 0.00) | 0.462 | 0.347 | 0.404 |
| frontalpole surface | 0.239 | 0.20 (-0.13, 0.53) | 0.209 | 0.135 | 0.391 |
| frontalpole thickness | 0.566 | 0.00 (-0.00, 0.00) | 0.810 | 0.436 | 0.659 |
| Full surface | 0.216 | 90.96 (-53.29, 235.20) | 0.264 | 0.502 | 0.450 |
| Full thickness | 0.226 | 0.00 (-0.00, 0.00) | 0.273 | 0.939 | 0.472 |
| fusiform surface | 0.297 | 1.81 (-1.59, 5.22) | 0.620 | 0.859 | 0.785 |
| fusiform thickness | 0.838 | 0.00 (-0.00, 0.00) | 0.778 | 0.785 | 0.784 |
| inferiorparietal surface | 0.682 | 1.18 (-4.45, 6.80) | 0.671 | 0.717 | 0.675 |
| inferiorparietal thickness | 0.102 | 0.00 (-0.00, 0.00) | 0.934 | 0.830 | 0.920 |
| inferiortemporal surface | 0.157 | 3.39 (-1.30, 8.08) | 0.050 | 0.809 | 0.105 |
| inferiortemporal thickness | 0.381 | 0.00 (-0.00, 0.00) | 0.587 | 0.280 | 0.447 |
| insula surface | 0.306 | 1.15 (-1.06, 3.37) | 0.430 | 0.337 | 0.471 |
| insula thickness | 0.997 | 0.00 (-0.00, 0.00) | 0.634 | 0.380 | 0.756 |
| isthmuscingulate surface | 0.202 | 1.00 (-0.54, 2.54) | 0.190 | 0.058 | 0.375 |
| isthmuscingulate thickness | 0.484 | 0.00 (-0.00, 0.00) | 0.090 | 0.595 | 0.114 |
| lateraloccipital surface | 0.373 | 2.50 (-3.00, 8.01) | 0.154 | 0.401 | 0.345 |
| lateraloccipital thickness | 0.638 | 0.00 (-0.00, 0.00) | 0.557 | 0.991 | 0.799 |
| lateralorbitofrontal surface | 0.459 | 0.97 (-1.59, 3.52) | 0.644 | 0.927 | 0.808 |
| lateralorbitofrontal thickness | 0.490 | 0.00 (-0.00, 0.00) | 0.488 | 0.150 | 0.538 |
| lingual surface | 0.181 | 2.36 (-1.10, 5.83) | 0.793 | 0.685 | 0.925 |
| lingual thickness | 0.509 | 0.00 (-0.00, 0.00) | 0.983 | 0.377 | 0.985 |
| medialorbitofrontal surface | 0.425 | 0.89 (-1.29, 3.06) | 0.146 | 0.909 | 0.285 |
| medialorbitofrontal thickness | 0.877 | -0.00 (-0.00, 0.00) | 0.028* | 0.280 | 0.121 |
| middletemporal surface | 0.545 | 1.20 (-2.69, 5.10) | 0.238 | 0.695 | 0.390 |
| middletemporal thickness | 0.237 | 0.00 (-0.00, 0.00) | 0.320 | 0.895 | 0.350 |
| paracentral surface | 0.097 | 1.73 (-0.32, 3.78) | 0.098 | 0.412 | 0.122 |
| paracentral thickness | 0.475 | 0.00 (-0.00, 0.00) | 0.132 | 0.803 | 0.076 |
| parahippocampal surface | 0.491 | 0.34 (-0.63, 1.30) | 0.248 | 0.687 | 0.145 |
| parahippocampal thickness | 0.830 | -0.00 (-0.00, 0.00) | 0.934 | 0.672 | 0.570 |
| parsopercularis surface | 0.749 | 0.32 (-1.64, 2.28) | 0.705 | 0.629 | 0.686 |
| parsopercularis thickness | 0.111 | 0.00 (-0.00, 0.00) | 0.762 | 0.268 | 0.690 |
| parsorbitalis surface | 0.716 | 0.14 (-0.60, 0.87) | 0.568 | 0.855 | 0.721 |
| parsorbitalis thickness | 0.758 | 0.00 (-0.00, 0.00) | 0.293 | 0.715 | 0.340 |
| parstriangularis surface | 0.983 | -0.02 (-1.76, 1.72) | 0.466 | 0.844 | 0.656 |
| parstriangularis thickness | 0.248 | 0.00 (-0.00, 0.00) | 0.525 | 0.292 | 0.634 |
| pericalcarine surface | 0.272 | 1.26 (-0.99, 3.51) | 0.288 | 0.933 | 0.342 |
| pericalcarine thickness | 0.268 | 0.00 (-0.00, 0.00) | 0.631 | 0.137 | 0.708 |
| postcentral surface | 0.099 | 3.52 (-0.66, 7.70) | 0.693 | 0.710 | 0.873 |
| postcentral thickness | 0.403 | 0.00 (-0.00, 0.00) | 0.746 | 0.801 | 0.836 |
| posteriorcingulate surface | 0.819 | 0.17 (-1.26, 1.59) | 0.709 | 0.657 | 0.803 |
| posteriorcingulate thickness | 0.050 | 0.00 (-0.00, 0.00) | 0.522 | 0.646 | 0.597 |
| precentral surface | 0.316 | 2.63 (-2.52, 7.77) | 0.153 | 0.098 | 0.217 |
| precentral thickness | 0.741 | 0.00 (-0.00, 0.00) | 0.248 | 0.893 | 0.385 |
| precuneus surface | 0.128 | 3.63 (-1.04, 8.29) | 0.167 | 0.242 | 0.291 |
| precuneus thickness | 0.114 | 0.00 (-0.00, 0.00) | 0.202 | 0.963 | 0.339 |
| rostralanteriorcingulate surface | 0.429 | 0.55 (-0.82, 1.92) | 0.158 | 0.825 | 0.324 |
| rostralanteriorcingulate thickness | 0.697 | -0.00 (-0.00, 0.00) | 0.021* | 0.010* | 0.059 |
| rostralmiddlefrontal surface | 0.675 | 1.36 (-4.99, 7.71) | 0.831 | 0.327 | 0.926 |
| rostralmiddlefrontal thickness | 0.233 | 0.00 (-0.00, 0.00) | 0.774 | 0.500 | 0.900 |
| superiorfrontal surface | 0.473 | 2.84 (-4.90, 10.58) | 0.195 | 0.442 | 0.372 |
| superiorfrontal thickness | 0.995 | -0.00 (-0.00, 0.00) | 0.064 | 0.273 | 0.106 |
| superiorparietal surface | 0.500 | 1.87 (-3.57, 7.31) | 0.479 | 0.406 | 0.729 |
| superiorparietal thickness | 0.195 | 0.00 (-0.00, 0.00) | 0.298 | 0.843 | 0.322 |
| superiortemporal surface | 0.981 | 0.05 (-4.14, 4.24) | 0.159 | 0.794 | 0.317 |
| superiortemporal thickness | 0.161 | 0.00 (-0.00, 0.00) | 0.226 | 0.458 | 0.110 |
| supramarginal surface | 0.961 | -0.14 (-5.89, 5.60) | 0.034* | 0.621 | 0.076 |
| supramarginal thickness | 0.216 | 0.00 (-0.00, 0.00) | 0.863 | 0.559 | 0.944 |
| temporalpole surface | 0.928 | 0.02 (-0.46, 0.51) | 0.422 | 0.680 | 0.554 |
| temporalpole thickness | 0.866 | 0.00 (-0.00, 0.00) | 0.021* | 0.202 | 0.061 |
| transversetemporal surface | 0.980 | 0.01 (-0.68, 0.70) | 0.074 | 0.878 | 0.161 |
| transversetemporal thickness | 0.518 | 0.00 (-0.00, 0.00) | 0.611 | 0.837 | 0.688 |
| bankssts surface with global surface weight | 0.395 | 0.48 (-0.63, 1.59) | 0.284 | 0.093 | 0.316 |
| caudalanteriorcingulate surface with global surface weight | 0.543 | -0.28 (-1.19, 0.63) | 0.574 | 0.269 | 0.576 |
| caudalmiddlefrontal surface with global surface weight | 0.715 | 0.63 (-2.74, 3.99) | 0.005* | 0.913 | 0.011* |
| cuneus surface with global surface weight | 0.225 | 0.86 (-0.53, 2.24) | 0.650 | 0.712 | 0.780 |
| entorhinal surface with global surface weight | 0.623 | -0.16 (-0.79, 0.47) | 0.265 | 0.755 | 0.398 |
| frontalpole surface with global surface weight | 0.594 | 0.09 (-0.24, 0.41) | 0.082 | 0.260 | 0.132 |
| fusiform surface with global surface weight | 0.705 | -0.47 (-2.92, 1.98) | 0.309 | 0.869 | 0.439 |
| inferiorparietal surface with global surface weight | 0.646 | -1.10 (-5.81, 3.60) | 0.076 | 0.921 | 0.105 |
| inferiortemporal surface with global surface weight | 0.357 | 1.50 (-1.69, 4.70) | 0.057 | 0.798 | 0.085 |
| insula surface with global surface weight | 0.593 | 0.43 (-1.14, 2.00) | 0.851 | 0.494 | 0.800 |
| isthmuscingulate surface with global surface weight | 0.504 | 0.39 (-0.76, 1.55) | 0.245 | 0.066 | 0.354 |
| lateraloccipital surface with global surface weight | 0.774 | 0.52 (-3.02, 4.05) | 0.388 | 0.766 | 0.628 |
| lateralorbitofrontal surface with global surface weight | 0.612 | -0.43 (-2.10, 1.24) | 0.638 | 0.355 | 0.824 |
| lingual surface with global surface weight | 0.599 | 0.74 (-2.03, 3.51) | 0.556 | 0.848 | 0.685 |
| medialorbitofrontal surface with global surface weight | 0.799 | 0.19 (-1.24, 1.62) | 0.139 | 0.431 | 0.214 |
| middletemporal surface with global surface weight | 0.682 | -0.47 (-2.73, 1.79) | 0.509 | 0.872 | 0.609 |
| paracentral surface with global surface weight | 0.329 | 0.83 (-0.83, 2.49) | 0.064 | 0.657 | 0.069 |
| parahippocampal surface with global surface weight | 0.940 | 0.03 (-0.73, 0.79) | 0.335 | 0.987 | 0.152 |
| parsopercularis surface with global surface weight | 0.682 | -0.33 (-1.93, 1.27) | 0.867 | 0.216 | 0.831 |
| parsorbitalis surface with global surface weight | 0.648 | -0.14 (-0.76, 0.47) | 0.254 | 0.322 | 0.344 |
| parstriangularis surface with global surface weight | 0.520 | -0.49 (-1.97, 1.00) | 0.602 | 0.512 | 0.830 |
| pericalcarine surface with global surface weight | 0.510 | 0.70 (-1.39, 2.80) | 0.157 | 0.921 | 0.165 |
| postcentral surface with global surface weight | 0.214 | 1.67 (-0.96, 4.30) | 0.882 | 0.746 | 0.918 |
| posteriorcingulate surface with global surface weight | 0.303 | -0.55 (-1.60, 0.50) | 0.704 | 0.764 | 0.771 |
| precentral surface with global surface weight | 0.875 | 0.24 (-2.81, 3.30) | 0.601 | 0.061 | 0.807 |
| precuneus surface with global surface weight | 0.126 | 2.12 (-0.60, 4.84) | 0.350 | 0.381 | 0.476 |
| rostralanteriorcingulate surface with global surface weight | 0.801 | 0.13 (-0.90, 1.16) | 0.118 | 0.505 | 0.208 |
| rostralmiddlefrontal surface with global surface weight | 0.363 | -1.69 (-5.34, 1.95) | 0.658 | 0.584 | 0.802 |
| superiorfrontal surface with global surface weight | 0.532 | -1.17 (-4.84, 2.50) | 0.486 | 0.396 | 0.661 |
| superiorparietal surface with global surface weight | 0.789 | -0.58 (-4.78, 3.63) | 0.174 | 0.717 | 0.351 |
| superiortemporal surface with global surface weight | 0.272 | -1.25 (-3.49, 0.98) | 0.401 | 0.512 | 0.676 |
| supramarginal surface with global surface weight | 0.459 | -1.52 (-5.56, 2.51) | 0.015* | 0.141 | 0.023* |
| temporalpole surface with global surface weight | 0.693 | -0.09 (-0.52, 0.35) | 0.444 | 0.323 | 0.542 |
| transversetemporal surface with global surface weight | 0.488 | -0.19 (-0.71, 0.34) | 0.179 | 0.888 | 0.326 |
| bankssts surface with global thickness weight | 0.599 | -0.00 (-0.00, 0.00) | 0.565 | 0.972 | 0.724 |
| caudalanteriorcingulate surface with global thickness weight | 0.664 | -0.00 (-0.00, 0.00) | 0.227 | 0.863 | 0.437 |
| caudalmiddlefrontal surface with global thickness weight | 0.601 | 0.00 (-0.00, 0.00) | 0.003* | 0.538 | 0.012* |
| cuneus surface with global thickness weight | 0.982 | 0.00 (-0.00, 0.00) | 0.379 | 0.820 | 0.621 |
| entorhinal surface with global thickness weight | 0.023 | -0.00 (-0.01, -0.00) | 0.843 | 0.237 | 0.684 |
| frontalpole surface with global thickness weight | 0.901 | -0.00 (-0.00, 0.00) | 0.666 | 0.481 | 0.309 |
| fusiform surface with global thickness weight | 0.282 | -0.00 (-0.00, 0.00) | 0.526 | 0.955 | 0.393 |
| inferiorparietal surface with global thickness weight | 0.157 | 0.00 (-0.00, 0.00) | 0.564 | 0.514 | 0.420 |
| inferiortemporal surface with global thickness weight | 0.679 | -0.00 (-0.00, 0.00) | 0.074 | 0.262 | 0.023* |
| insula surface with global thickness weight | 0.487 | -0.00 (-0.00, 0.00) | 0.291 | 0.552 | 0.474 |
| isthmuscingulate surface with global thickness weight | 0.718 | 0.00 (-0.00, 0.00) | 0.074 | 0.538 | 0.052 |
| lateraloccipital surface with global thickness weight | 0.581 | -0.00 (-0.00, 0.00) | 0.823 | 0.690 | 0.911 |
| lateralorbitofrontal surface with global thickness weight | 0.925 | 0.00 (-0.00, 0.00) | 0.507 | 0.194 | 0.518 |
| lingual surface with global thickness weight | 0.793 | 0.00 (-0.00, 0.00) | 0.763 | 0.268 | 0.757 |
| medialorbitofrontal surface with global thickness weight | 0.464 | -0.00 (-0.00, 0.00) | 0.036* | 0.236 | 0.079 |
| middletemporal surface with global thickness weight | 0.838 | 0.00 (-0.00, 0.00) | 0.285 | 0.969 | 0.416 |
| paracentral surface with global thickness weight | 0.814 | -0.00 (-0.00, 0.00) | 0.104 | 0.591 | 0.011* |
| parahippocampal surface with global thickness weight | 0.554 | -0.00 (-0.00, 0.00) | 0.990 | 0.528 | 0.782 |
| parsopercularis surface with global thickness weight | 0.358 | 0.00 (-0.00, 0.00) | 0.427 | 0.229 | 0.236 |
| parsorbitalis surface with global thickness weight | 0.611 | -0.00 (-0.00, 0.00) | 0.226 | 0.660 | 0.319 |
| parstriangularis surface with global thickness weight | 0.759 | 0.00 (-0.00, 0.00) | 0.221 | 0.356 | 0.425 |
| pericalcarine surface with global thickness weight | 0.405 | 0.00 (-0.00, 0.00) | 0.919 | 0.093 | 0.961 |
| postcentral surface with global thickness weight | 0.764 | 0.00 (-0.00, 0.00) | 0.223 | 0.534 | 0.360 |
| posteriorcingulate surface with global thickness weight | 0.077 | 0.00 (-0.00, 0.00) | 0.728 | 0.612 | 0.715 |
| precentral surface with global thickness weight | 0.408 | -0.00 (-0.00, 0.00) | 0.117 | 0.548 | 0.213 |
| precuneus surface with global thickness weight | 0.330 | 0.00 (-0.00, 0.00) | 0.219 | 0.800 | 0.383 |
| rostralanteriorcingulate surface with global thickness weight | 0.451 | -0.00 (-0.00, 0.00) | 0.096 | 0.003* | 0.131 |
| rostralmiddlefrontal surface with global thickness weight | 0.314 | 0.00 (-0.00, 0.00) | 0.928 | 0.292 | 0.960 |
| superiorfrontal surface with global thickness weight | 0.178 | -0.00 (-0.00, 0.00) | 0.255 | 0.248 | 0.364 |
| superiorparietal surface with global thickness weight | 0.520 | 0.00 (-0.00, 0.00) | 0.480 | 0.861 | 0.491 |
| superiortemporal surface with global thickness weight | 0.165 | 0.00 (-0.00, 0.00) | 0.519 | 0.438 | 0.231 |
| supramarginal surface with global thickness weight | 0.185 | 0.00 (-0.00, 0.00) | 0.985 | 0.776 | 0.997 |
| temporalpole surface with global thickness weight | 0.635 | -0.00 (-0.00, 0.00) | 0.007* | 0.125 | 0.029* |
| transversetemporal surface with global thickness weight | 0.893 | -0.00 (-0.00, 0.00) | 0.462 | 0.634 | 0.574 |
| Brain Structures | CTEPH, β (95% Confidence Interval) | P-value | PAH, β (95% Confidence Interval) | P-value |
| cerebral white matter volume change rate, mm3/year | -2.91 (-60.38, 54.55) | 0.921 | -52.72 (-101.21, -4.24) | 0.033* |
| lateral ventricles volume change rate, mm3/year | 22.56 (1.15, 43.97) | 0.039* | -7.70 (-23.75, 8.36) | 0.347 |
| thalamus volume change rate, mm3/year | -7.64 (-14.31, -0.97) | 0.025* | 0.22 (-4.61, 5.04) | 0.930 |
| entorhinal surface, mm2/year | 1.13 (0.01, 2.25) | 0.047* | -0.16 (-0.79, 0.47) | 0.623 |
| inferiorparietal surface, mm2/year | 10.98 (1.59, 20.37) | 0.022* | -1.10 (-5.81, 3.60) | 0.646 |
| peakOcc, Hz | 0.04 (0.01, 0.08) | 0.023* | 0.03 (-0.01, 0.06) | 0.099 |
Peer Reviews
No public reviews on file for this paper yet. If you reviewed it on a platform where reviews are public (OpenReview, ICLR, NeurIPS, ICML), you can paste yours below so the community can read it here.
Videos
No videos yet. Explain this paper in a talk, walkthrough, or lecture? Add one.
Taxonomy
TopicsLiver Disease Diagnosis and Treatment · Pulmonary Hypertension Research and Treatments · Genetic Associations and Epidemiology
Introduction
Chronic thromboembolic pulmonary hypertension (CTEPH) and pulmonary arterial hypertension (PAH) are different subtypes of pulmonary hypertension (PH) and have been reported as risk factors for neuropsychiatric disorders [1-4]. Neuropsychiatric disorders are associated with low life quality and high mortality in patients with CTEPH or PAH [5,6]. Although both CTEPH and PAH lead to elevated pulmonary artery pressure, right heart failure, and death [7], CTEPH is caused by pulmonary thromboembolism (PTE), while PAH is characterized by pulmonary arterial remodeling.
Furthermore, patients with CTEPH and PAH have distinct demographic characteristics [8,9] and different frequencies of neuropsychiatric disorders [2,6,10], indicating that these two subtypes of PH may have distinct patterns and mechanisms that affect the lung-brain axis. Early evidence that cortical thickness and surface area of the brain are altered in patients with PAH [11]. However, whether CTEPH and PAH are causally linked to distinct patterns of brain structure or function remains unexplored.
Moreover, studies have shown that CTEPH and PAH patients have elevated levels of inflammatory cytokines [12]. But whether circulating immune cells explain the different impacts on the brain needs to be uncovered. Recently, a large-scale genome-wide association study (GWAS) revealed CTEPH is a partially heritable polygenic disease [13]. This genetic evidence may be used to explain the common or unique effects of CTEPH and PAH on the brain. Mendelian randomization [14-17] employs genetic tools as proxies for exposure to risk factors associated with diseases. These exposures are randomly assigned at the time of pregnancy, serving as a representation of exposure, thereby overcoming the inherent confounding biases present in observational studies.
Thus, we design a two-sample Mendelian randomization study using brain MRI data to document patterns of CTEPH and PAH in brain structure. Furthermore, to analyze the intrinsic mechanisms affecting the lung-brain axis associated with CTEPH and PAH, we search for circulating immune cells as potential mediators of the relationship between CTEPH or PAH and brain structures.
Materials and methods
Study design
The present study used GWAS results derived from published studies, and approval was obtained from the appropriate ethics committees for the conduct of these studies; therefore, separate ethical approval was not required for this study. Figure 1 shows the study flowchart of the lung-brain axis between CTEPH, PAH, and brain structures on brain MRI.
Flowchart of the Mendelian randomization study.Study flowchart of the Mendelian randomization study revealing the causal relationship between PAH, CTEPH, and the brain cortical surface area, thickness, intracranial volume, hippocampal volume, subcortical volume, longitudinal changes (year-by-year changes) with aging, defined using brain MRI, and the electric activity of the brain measured by peak frequency of electroencephalogram.PAH: pulmonary arterial hypertension; CTEPH: chronic thromboembolic pulmonary hypertension; MR: Mendelian randomization; SNP: single-nucleotide polymorphism; MR-PRESSO: Mendelian randomization pleiotropy residual sum and outlier.Flowchart created by the authors.
The data source for CTEPH and PAH
CTEPH data were obtained from the latest Durham University study, which included 1,970 CTEPH cases and 10,363 controls from a European population with 4,655,481 single-nucleotide polymorphisms (SNPs) [13]. Moreover, we collected summary-level GWAS data on PAH comprising 277 cases and 316,345 controls from the most recent FinnGen data release (June 24, 2024, 11th Release) [18].
Brain structure data on MRI
The cortical surface area and thickness, intracranial volume, hippocampal volume, and subcortical volume in this study are the result of GWAS after quantification of whole-brain MRI by the ENIGMA consortium (https://enigma.ini.usc.edu/research/download-enigma-gwas-results/). They included 51,665 individuals across 60 cohorts and used FreeSurfer MRI processing software to quantitatively analyze T1-weighted (T1WI) sequences. The reported anatomical structures of the gyri were used to determine cortical boundaries, and the Desikan-Killiany map was used to divide the 34 regions of the cerebral cortex. This study used only European-ancestry meta-analysis results, which included two groups: globally corrected and uncorrected. Globally corrected cortical surface area and thickness data exclude the effects of whole-brain surface area or thickness on the surface area or thickness of specific regions. Moreover, GWAS results on the peak frequency of the electroencephalogram and year-by-year changes in brain structure were obtained from the ENIGMA consortium.
Selection of genetic instrument variables
CTEPH and PAH were receptively used as the main exposure, whereas brain structure on brain MRI was used as the outcome. First, we selected SNPs associated with CTEPH and PAH using a significance p-value less than 5×10⁻⁵. Next, we excluded a subset of SNPs based on exposure sample and outcome sample allele identity, palindromic allele, or linkage disequilibrium. The calculated threshold for linkage disequilibrium was 0.001, and linkage disequilibrium was verified within 1 MB upstream and downstream of each SNP. Then, we used LDlink (https://ldlink.nci.nih.gov/?tab=ldtrait) to ensure that no SNP was associated with potential confounding factors, including age, sex, smoking, obesity, and psychiatric disorders. Finally, we calculate the F-value to assess the strength of the selected SNPs as instrumental variables.
Mendelian randomization analyses
Random-effects inverse-variance weighting (IVW) was used as the primary outcome to assess the potential causal relationship among CTEPH, PAH, and cortical structural abnormalities. IVW is a common method used in MR studies to estimate the causal effect by combining the results from multiple genetic instruments. It assumes that the genetic instruments are valid (i.e., they are associated with the exposure, independent of confounders, and affect the outcome only through the exposure). The IVW method provides a weighted average of the causal estimates from each genetic instrument. MR-Egger and weighted median methods were used to further validate the results of IVW in case the instrumental variables had undetected potential pleiotropy or there were potentially invalid instrumental variables. MR-Egger regression tests for directional pleiotropy by fitting a linear regression model to the causal estimates and their standard errors. The weighted median method provides a robust estimate by taking the median of the causal estimates from the genetic instruments, weighted by their precision.
Network mediation analysis
Network mediation analysis was performed to identify potential mediators of the relationship between PH subtypes and brain structures. This method estimates the direct and indirect effects of the exposure on the outcome through potential mediators. We first scanned for circulation immune cells derived from the OpenGwas platform (https://gwas.mrcieu.ac.uk/) to find potential mediators with significant causal effects from CTEPH or PAH to brain structure using twice two-sample Mendelian randomization. Then, we validated the mediation effects through the effect sizes and standard errors based on network Mendelian randomization [15-17].
Statistical analysis
All analyses were performed with R software, version 4.2.2 (The R Foundation, Vienna, Austria). Mendelian randomization analyses were performed primarily with the use of the TwoSampleMR package (version 0.6.2, developed by Stephen Burgess, Cambridge, United Kingdom) and the MRPRESSO package (version 1.0, developed by Tom Palmer, Bristol, United Kingdom). Gene enrichment used a hypergeometric test, and Benjamini-Hochberg's method was used to control the false-positive rate due to multiple tests. Two-sided p-values of less than 0.05 were considered significant.
Data sharing statement
All data can be accessed publicly through the URLs specified in the methods section.
Results
Instrumental variable selection
We identified seven SNPs as genetic proxies for CTEPH with F-values greater than 10, indicating that these SNPs avoided weak instrumental variable bias as instrumental variables. Meanwhile, we identified 41 valid instrumental variables for PAH (Table 1).
**Table 1: Instrumental variable information in this study*P<0.05.Results in this
Impacts of CTEPH and PAH on the brain structure and electrical activity
At the global level, there was no significant association between CTEPH and either full cortical surface area (IVW p=0.586) or thickness (IVW p=0.204) (Table 2). Moreover, PAH did not show a significant effect on full cortical surface area or thickness either (Table 3).
Table 2: Mendelian randomization estimates from CTEPH on genetical brain structure*P<0.05. All surfaces or thicknesses can be measured, regardless of whether the global surface or thickness is adjusted to highlight specific regional changes.CTEPH, Chronic thromboembolic pulmonary hypertension; IVW, Inverse-variance weighted; MR, Two-sample Mendelian randomization; CI, Confidence interval; PRESSO, Mendelian randomization pleiotropy residual sum and outlier; alphaCz: Alpha power at the vertex electrode; alphaOcc: Alpha power at the occipital; betaCz: Beta power at the vertex electrode; deltaCz: Delta power at the vertex electrode; peakOcc: Alpha peak at the occipital; thetaCz: Theta power at the vertex electrode.
Table 3: Mendelian randomization estimates from PAH on genetical brain structure*P<0.05. All surfaces or thicknesses can be measured with or without adjusting the global surface or thickness to highlight specific region changes.PAH, pulmonary arterial hypertension; IVW, inverse-variance weighted; MR, two-sample Mendelian randomization; CI, confidence interval; PRESSO, Mendelian randomization pleiotropy residual sum and outlier; alphaCz: alpha power at the vertex electrode; alphaOcc: alpha power at the occipital; betaCz: beta power at the vertex electrode; deltaCz: delta power at the vertex electrode; peakOcc: alpha peak at the occipital; thetaCz: theta power at the vertex electrode.
At the functional region-level analysis, we found a series of structural alterations on brain MRI linked to CTEPH, including the entorhinal surface (β: 1.13 mm², IVW p: 0.047) and the inferior parietal surface (β: 10.98 mm², IVW p: 0.022) with global weight (Figure 2, Tables 2, 4). It appears that the inferior parietal surface with global surface weight had resulted from CTEPH (β: 10.98 mm², IVW p: 0.022) but not PAH (β: -1.10 mm², IVW p: 0.646). Compared with PAH (β: -0.16 mm², IVW p: 0.623), the effects of CTEPH (β: 1.13 mm², IVW p: 0.047) on the entorhinal surface were relatively specific (Figure 2, Tables 2-4). For PAH, the entorhinal thickness with global thickness weight (β: -0.003, IVW p: 0.023) and hippocampal volume (β: -0.005, IVW p: 0.048) were altered specifically (Table 3).
IVW-estimating p from CTEPH and PAH on brain structure on brain magnetic resonance imaging and electroencephalogram.: p<0.05.IVW, inverse-variance weighted; CTEPH, chronic thromboembolic pulmonary hypertension; PAH, pulmonary arterial hypertension; peakOcc: occipital alpha peak frequency (associated with cognition or depression).*
Table 4: β estimates from CTEPH and PAH on genetical brain structures by Mendelian randomization using IVW*P<0.05.IVW, inverse-variance weighted; CTEPH, chronic thromboembolic pulmonary hypertension; PAH, pulmonary arterial hypertension; peakOcc: occipital alpha peak frequency.
Furthermore, CTEPH altered the thalamus (β: -7.64 mm³/year, IVW p: 0.025) or lateral ventricle (β: 22.56 mm³/year, IVW p: 0.039) volume changing rate with aging (Figure 2, Table 1). However, there was no significant evidence of the effects of PAH (β: 0.22 mm³/year, IVW p: 0.930) on the thalamus volume aging rate or lateral ventricles volume aging rate (β: -7.70 mm³/year, IVW p: 0.347). Moreover, we also found that CTEPH was associated with the electrical activity in EEG (β: 0.04 Hz, IVW p: 0.023), but PAH had no similar association (β: 0.03 Hz, IVW p: 0.099). PAH can affect the cerebral white matter volume change rate (β: -52.72 mm³/year, IVW p: 0.033), which is different from that in patients with CTEPH.
According to Cochran's Q test, we did not find significant heterogeneity in the association between CTEPH or PAH and brain structures or electric activity mentioned above (Tables 2, 3). The MR-Egger intercept test and global test P-value derived from MR-PRESSO confirmed no horizontal pleiotropy in the causal effects of CTEPH or PAH and those brain structures or electric activity (Tables 2, 3).
Mediators of the different impacts of CTEPH and PAH on the brain structure
Mediation pathways are graphically represented in Figure 3. CTEPH affected the absolute count of CD33+ HLA DR+ CD14dim (β: -0.11, IVW p: 0.022) and the cell count was significantly correlated with the volume change rate of the lateral ventricles (β: -63.06, IVW p: 0.002) with the mediation effect of 4.09 (confidence interval: 0.09 to 10.16). Conversely, PAH displayed a negative association with the count of CD33+ HLA DR+ CD14dim immune cells (β: -0.04, IVW p: 0.027) that was related to cerebral white matter volume change rate (β: -45.24, IVW p: 0.022) with a significant mediation effect (1.74, confidence interval: 0.01 to 4.39). Although not all mediation effects were significant in Figure 3, we observed the percentage of CD4 regulatory T cells in CD4+ T cells, the percentage of HLA DR+ natural killer cells in CD3-lymphocytes, the amount of HVEM on effector memory CD4+ T cells, and the amount of CD127 on CD28+ CD45RA-CD8+ T cells were causally changed by CTEPH, and those immune cells altered the brain structures related to CTEPH. Similarly, the amount of CD33 on CD33+ HLA DR+ cells, the amount of CD33 on CD33+ HLA DR+ CD14- cells, and the amount of CD45 on monocytic myeloid-derived suppressor cells were potential mediators of the association between PAH and the cerebral white matter volume change rate.
A Forest plot of potential mediators of the association between CTEPH or PAH and brain structures.β and p were derived from the inverse-variance weighted method.CTEPH, chronic thromboembolic pulmonary hypertension; PAH, pulmonary arterial hypertension; IV, instrumental variable; CI, confidence interval; MDSC, myeloid-derived suppressor cells.
Discussion
This is the first to reveal the causal effects of CTEPH and PAH on brain structures with Mendelian randomization and brain MRI. We found that both PAH and CTEPH affected brain structure and brain aging rate in two different patterns. Furthermore, our results demonstrate that circulating immune cells may mediate the association between CTEPH, PAH, and brain structures, and that immune cell activation in CTEPH patients is strongly associated with changes in brain structure distinct from those in PAH.
Earlier studies reported that PAH was associated with the inferior parietal, insula, lateral occipital, parsopercularis, parstriangularis, rostral middle frontal, and superior parietal regions [11]. Our results revealed several heterogeneous associations, likely due to data updates in the FinnGen project. The previous study used 125 PAH cases and 162837 healthy controls. In contrast, our study employed 277 cases and 316,345 controls. Although the genome-wide significance threshold in the previous study was identical to ours, the final genetic instrument variables differed substantially. Our study indicated that PAH affects hippocampal volume and amygdala volume with relatively small effect sizes. The hippocampus has been related to memory and cognition in aging diseases [19]. Since it contains high levels of glucocorticoid receptors, the hippocampus is more vulnerable to long-term stress than most other brain areas and is highly involved in severe depression [20,21]. The amygdala is activated under the conditions of fear or aggression, and it has also been linked to depression [22]. Keener et al. reported that individuals with bipolar disorder had greater amygdala activity [23]. Besides, we found that PAH decreases the rate of change in cerebral white matter volume with aging, a finding that may be similar to cognitive decline in Sturge-Weber syndrome [24]. These previous clues inspire us to conclude that our findings are evidence supporting the lung-brain axis and causal effects between PAH and affective disorders.
Previous studies [25-27] reported that the entorhinal cortex was associated with Alzheimer's disease (AD) and stable mild cognitive impairment, and the medial thalamus was associated with cognitive impairment. Our study showed that CTEPH changes the entorhinal and inferior parietal surfaces on brain T1WI MRI. CTEPH also altered the rate of change in thalamic volume with aging. Moreover, some studies have indicated that thalamic and lateral ventricular volumes naturally change with age [28], but CTEPH alters the rate of this change. Therefore, our study suggests that CTEPH promotes brain structural aging, but the details of the underlying interaction remain unclear.
PAH and CTEPH lead to right heart failure, but our data show that their impacts on the brain are different. To further study the possible mechanisms, we analyzed circulating immune cells in the effects of CTEPH and PAH on brain structural changes. T-cell activation was highlighted in the association of CTEPH and brain structures. The role of T cells in CTEPH has been highlighted in single-cell RNA sequencing and a series of human studies [29]. However, it remains unclear whether T cells can promote brain restructuring. Monocytes were implicated in the association of PAH and brain structures. Recently, monocytes have been reported to activate within pulmonary arterial subendothelial and adventitial regions, influencing vascular remodeling across PAH subtypes [30]. Our findings provide novel insights into how the lung-brain crosstalk works, inspiring future studies to validate and apply them to clinical interventions.
Combining Mendelian randomization with a brain MRI dataset is novel because it integrates genetic evidence with detailed brain structural data. This approach allows us to infer causal relationships between PH subtypes and specific brain structural changes, overcoming confounding biases present in traditional observational studies. It provides a unique opportunity to visualize and quantify how genetic predispositions to PH manifest in brain structure, offering deeper insights into the lung-brain axis. But there are limitations to this study, including the fact that the study population included only individuals of European ancestry, which makes it difficult to apply the results to other ancestral origins. As there is only one GWAS in CTEPH, future meta-analyses would be helpful to further refine the conclusions. Moreover, we studied only the effects of CTEPH and PAH on brain structure, evaluated on T1WI, and there is a lack of analysis of their effects on brain function and metabolism. Future studies may need to conduct multivariable Mendelian randomization to estimate the effects of PH on brain function using functional MRI and on metabolism using positron emission tomography.
Conclusions
Both CTEPH and PAH can causally affect specific brain regions and electrical activity, but their impacts on functional brain regions and electrical activity differ due to their distinct etiologies and immune activations. These findings help us to understand the heterogeneity of the lung-brain axis in different subtypes of PH.
The reference list from the paper itself. Each links out to its DOI / PubMed record.
- 1Anxiety, depression, and health-related QOL in patients diagnosed with PAH or CTEPH Lung Pfeuffer E Krannich H Halank M Wilkens H Kolb P Jany B Held M 75976819520172899387710.1007/s 00408-017-0052-z · doi ↗ · pubmed ↗
- 2Prevalence of mental disorders in patients with chronic thromboembolic pulmonary hypertension Front Psychiatry Dering MR Lepsy N Fuge J 8214661320223530887810.3389/fpsyt.2022.821466 PMC 8925996 · doi ↗ · pubmed ↗
- 3Anxiety and depression in patients with pulmonary arterial hypertension and chronic thromboembolic pulmonary hypertension: results from a Chinese survey Exp Ther Med Zhou X Shi H Yang Y Zhang Z Zhai Z Wang C 312431321920203225680010.3892/etm.2020.8566 PMC 7086277 · doi ↗ · pubmed ↗
- 4Clinical characteristics and prognosis in patients with chronic thromboembolic pulmonary hypertension and a concomitant psychiatric disorder Pulm Circ Tajima H Kasai H Tanabe N 9201910.1177/2045894019836420 PMC 641039230777485 · doi ↗ · pubmed ↗
- 5Anxiety, depression and quality of life in pulmonary hypertension: a comparison of incident and prevalent cases Respiration Pfeuffer-Jovic E Joa F Halank M Krannich JH Held M 78479210120223547716110.1159/000524369 PMC 9533438 · doi ↗ · pubmed ↗
- 6Cognitive dysfunction in patients with pulmonary hypertension Am J Respir Crit Care Med Yuan P Li J Liu J 1289129320620223590442610.1164/rccm.202204-0726 LEPMC 9746847 · doi ↗ · pubmed ↗
- 7Risk factors and basic mechanisms of chronic thromboembolic pulmonary hypertension: a current understanding Eur Respir J Lang IM Pesavento R Bonderman D Yuan JX 4624684120132270083910.1183/09031936.00049312 · doi ↗ · pubmed ↗
- 8Anxiety and depression in patients with pulmonary arterial hypertension and chronic thromboembolic pulmonary hypertension after the removal of COVID-19 pandemic restrictions J Clin Med Wieteska-Miłek M Witowicz A Szmit S Florczyk M Peller M Dzienisiewicz M Kurzyna M 13202410.3390/jcm 13123532 PMC 1120454738930062 · doi ↗ · pubmed ↗