Analysis of engineering data with an innovative generalization of the Lomax distribution
Hibah Alnashri, Hanan Baaqeel, Dawlah Alsulami, Lamya Baharith

TL;DR
This paper introduces a new statistical distribution, LKME, to improve the modeling of engineering data, especially for reliability and lifetime analysis.
Contribution
The novel LKME distribution combines the Lomax and Kavya Manoharan exponential distributions for enhanced adaptability in modeling failure rates.
Findings
LKME distribution can model various density shapes and hazard rate functions, making it highly flexible.
Monte Carlo simulations showed classical estimation methods perform well with LKME.
LKME outperformed other distributions in fitting five engineering datasets using goodness-of-fit metrics.
Abstract
As the amount and complexity of engineering data that need to be analyzed and interpreted continue to increase, the development of new distributions with outstanding adaptability is necessary. The aim of this work is to improve the precision of data modeling, particularly with respect to reliability and lifetime analyses. In this regard, a novel distribution called the Lomax Kavya Manoharan exponential (LKME) distribution derived from the exponential form of a hazard rate function is proposed. The introduction of the Kavya Manoharan exponential distribution with the properties of the Lomax distribution promotes the adaptability to capture different patterns of failure rates, thereby providing a better fit for lifetime data. The LKME distribution is highly flexible and accommodates almost all possible forms of densities, including symmetric, skewed, and inverted J-shaped, as well as…
Genes, proteins, chemicals, diseases, species, mutations and cell lines named across the full text — each resolved to its canonical identifier and authoritative record.
Click any figure to enlarge with its caption.
 Figure 1
 Figure 2
 Figure 3
 Figure 4
 Figure 5
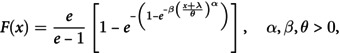 Figure 6
 Figure 7
 Figure 8
 Figure 9
 Figure 10
 Figure 11
 Figure 12
 Figure 13
 Figure 14
 Figure 15
 Figure 16
 Figure 17
 Figure 18
 Figure 19
 Figure 20
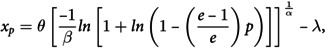 Figure 21
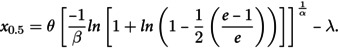 Figure 22
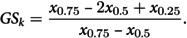 Figure 23
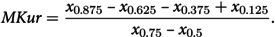 Figure 24
 Figure 25
 Figure 26
 Figure 27
 Figure 28
 Figure 29
 Figure 30
 Figure 31
 Figure 32
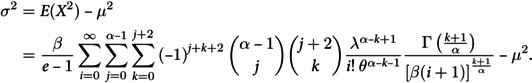 Figure 33
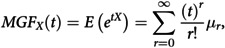 Figure 34
 Figure 35
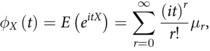 Figure 36
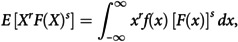 Figure 37
 Figure 38
 Figure 39
 Figure 40
 Figure 41
 Figure 42
 Figure 43
 Figure 44
 Figure 45
 Figure 46
 Figure 47
 Figure 48
 Figure 49
 Figure 50
Peer Reviews
No public reviews on file for this paper yet. If you reviewed it on a platform where reviews are public (OpenReview, ICLR, NeurIPS, ICML), you can paste yours below so the community can read it here.
Videos
No videos yet. Explain this paper in a talk, walkthrough, or lecture? Add one.
Taxonomy
TopicsStatistical Distribution Estimation and Applications · Probabilistic and Robust Engineering Design · Financial Risk and Volatility Modeling