Evaluating the Cauchy combination test for count data
Huda Alsulami, Silvia Liverani

TL;DR
This study evaluates the performance of the Cauchy combination test with count data under different correlation structures and finds that it manages type 1 error rates effectively under certain conditions.
Contribution
The novel contribution is evaluating the CCT's performance with correlated count data modeled via copulas and comparing it to existing methods.
Findings
The number of tests, success parameter, and sample size affect the CCT's type 1 error rate.
The CCT better controls type 1 error rates with stronger Gumbel-Hougaard copula correlations.
Copula choice and correlation strength significantly influence error rates for CCT and MinP tests.
Abstract
The Cauchy combination test (CCT) is a p-value combination method used in multiple-hypothesis testing and is robust under dependence structures. This study aims to evaluate the CCT for independent and correlated count data where the individual p-values are derived from tests based on normal approximation to the negative binomial distribution. The correlated count data are modelled via copula methods. The CCT performance is evaluated in a simulation study to assess the type 1 error rate and the statistical power, and compare it with existing methods. Our results indicate that the number of combined tests, the negative binomial success parameter, and sample size significantly affect the type 1 error rate of the CCT under independence or moderate correlation. The CCT has more control over managing the type 1 error rate as the strength increases in the Gumbel-Hougaard copula. In general,…
Genes, proteins, chemicals, diseases, species, mutations and cell lines named across the full text — each resolved to its canonical identifier and authoritative record.
Click any figure to enlarge with its caption.
 Figure 1
 Figure 2
 Figure 3
 Figure 4
 Figure 5
 Figure 6
 Figure 7
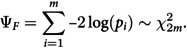 Figure 8
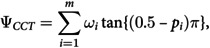 Figure 9
 Figure 10
 Figure 11
 Figure 12
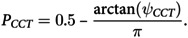 Figure 13
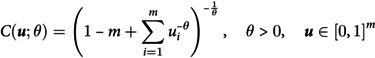 Figure 14
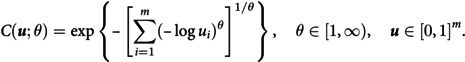 Figure 15
 Figure 16
 Figure 17
 Figure 18
 Figure 19
 Figure 20
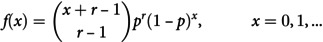 Figure 21
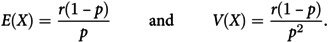 Figure 22
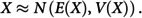 Figure 23
 Figure 24
 Figure 25
 Figure 26
 Figure 27
 Figure 28
 Figure 29
 Figure 30
 Figure 31
 Figure 32
 Figure 33
 Figure 34
 Figure 35
 Figure 36
 Figure 37
 Figure 38
 Figure 39
 Figure 40
 Figure 41
 Figure 42
 Figure 43
 Figure 44
 Figure 45
 Figure 46
 Figure 47
 Figure 48
 Figure 49
 Figure 50
Peer Reviews
No public reviews on file for this paper yet. If you reviewed it on a platform where reviews are public (OpenReview, ICLR, NeurIPS, ICML), you can paste yours below so the community can read it here.
Videos
No videos yet. Explain this paper in a talk, walkthrough, or lecture? Add one.
Taxonomy
TopicsStatistical Methods in Clinical Trials · Statistical Methods and Bayesian Inference · Statistical Distribution Estimation and Applications