Survey of clot waveform analysis of normal activated partial thromboplastin time in patients with cirrhosis and sepsis at Le Van Thinh hospital
Tran Qui Phuong Linh, Nguyen Thi Nhan, Le Minh Thuan, Le Trung Phuong, Kovuri Umadevi, Kovuri Umadevi, Kovuri Umadevi, Kovuri Umadevi, Kovuri Umadevi

TL;DR
This study explores clot waveform analysis to detect coagulation issues in patients with cirrhosis and sepsis, even when standard aPTT results are normal.
Contribution
The study introduces Bayesian ANOVA with Bayes factors to analyze clot waveform parameters in cirrhosis and sepsis patients.
Findings
Max1, Max2, and delta-OD indices effectively reflect coagulation disorders in cirrhosis and sepsis patients.
There is compelling evidence for Max1 differences between sepsis and control groups.
Delta-OD values are significantly higher in sepsis compared to control and cirrhosis groups.
Abstract
This study aimed to establish the correlation between activated partial thromboplastin time (aPTT) in seconds and ratio, first derivative peak (Max1), second derivative peak (Max2), second derivative minimum peak (Min2), and delta-OD of clot waveform analysis in patients diagnosed with cirrhosis, sepsis, and a control group. The study involved a series of cases using the Bayesian ANOVA model with Bayes factor (BF) estimated using the Markov Chain Monte Carlo sampling method with 2 chains. Each chain consisted of 10 000 repetitions and started 5 000 times to predict the variables aPTT (s), aPTT (ratio), Max1, Max2, Min2, and delta-OD respectively across the 3 study groups. The model used was variable ~ stage – 1. This analysis illustrates the adjustment of the posterior proportion for multiple testing by setting the prior probability of the initial hypothesis to 0.5 for all comparisons.…
Genes, proteins, chemicals, diseases, species, mutations and cell lines named across the full text — each resolved to its canonical identifier and authoritative record.
Click any figure to enlarge with its caption.
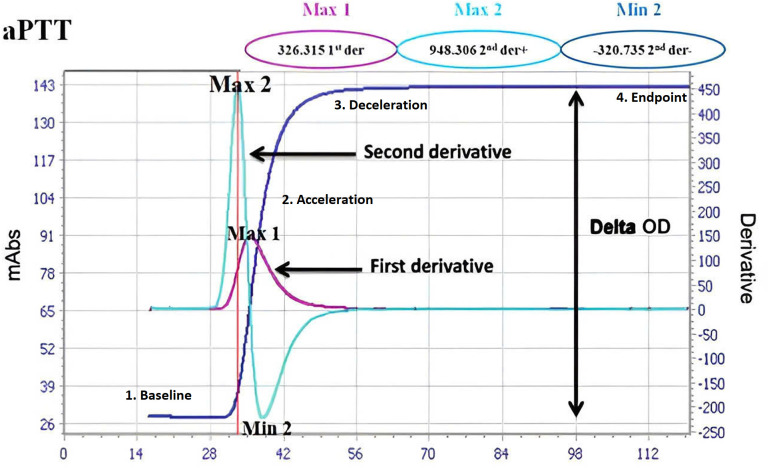 Figure 1
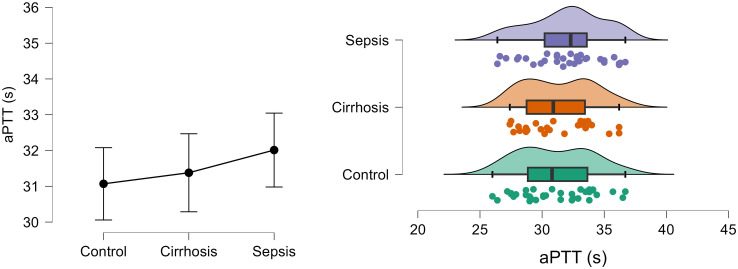 Figure 2
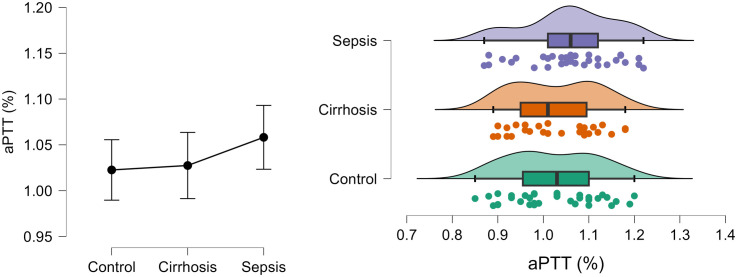 Figure 3
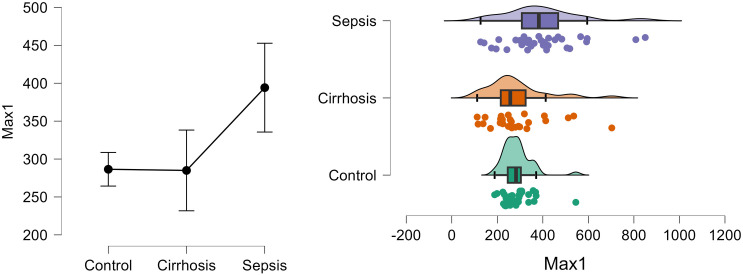 Figure 4
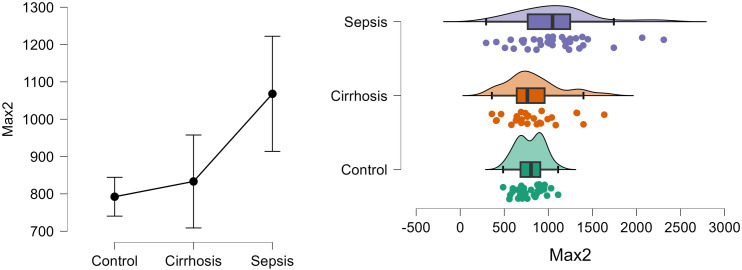 Figure 5
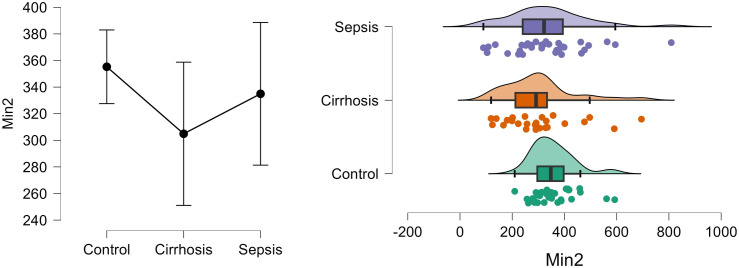 Figure 6
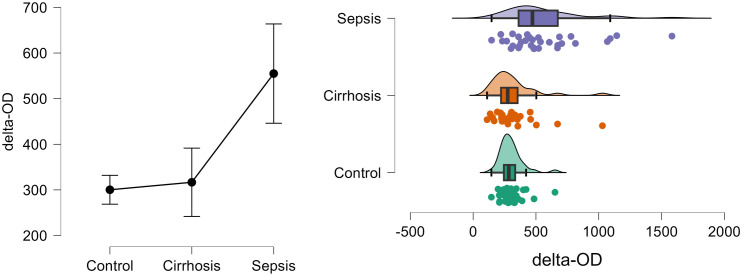 Figure 7
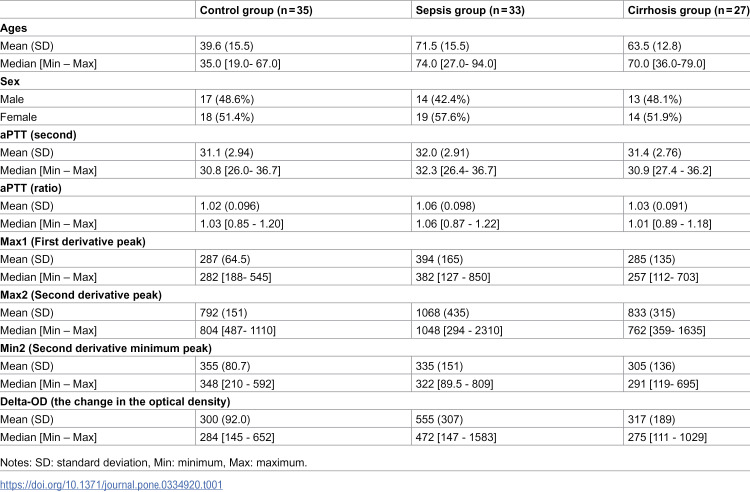 Figure 8
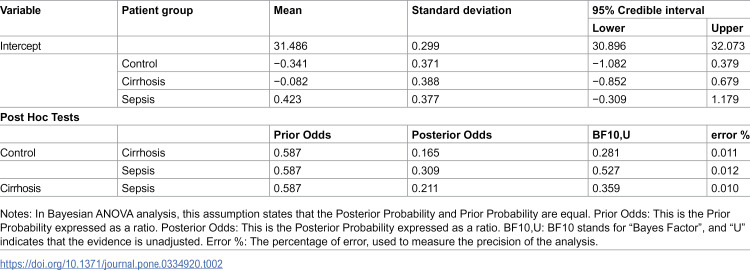 Figure 9
 Figure 10
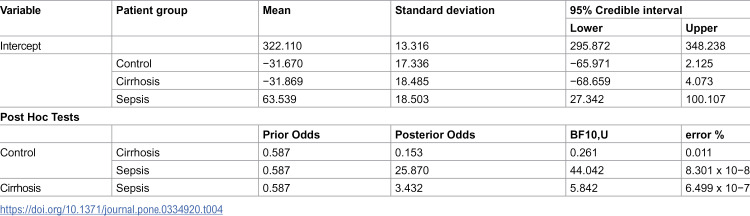 Figure 11
 Figure 12
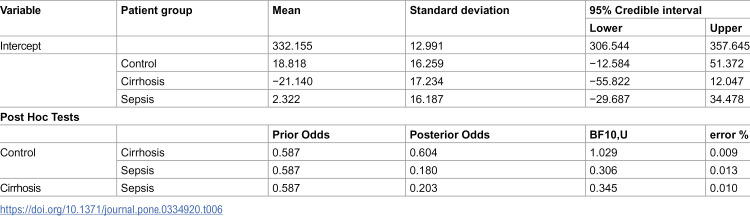 Figure 13
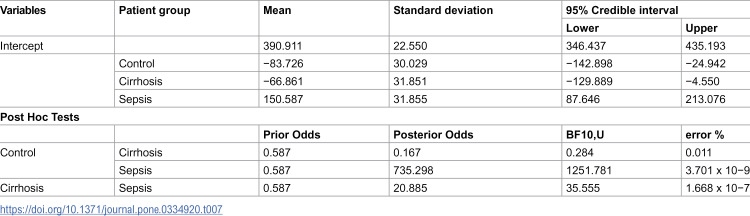 Figure 14
Peer Reviews
No public reviews on file for this paper yet. If you reviewed it on a platform where reviews are public (OpenReview, ICLR, NeurIPS, ICML), you can paste yours below so the community can read it here.
Videos
No videos yet. Explain this paper in a talk, walkthrough, or lecture? Add one.
Taxonomy
TopicsBlood properties and coagulation · Liver Disease Diagnosis and Treatment