Primordial germ cell specification and early developmental cell states in Pacific oyster
Mackenzie R. Gavery, Lauren E. Vandepas, Lauren M. Saunders, Brent Vadopalas, J. Adam Luckenbach, Cole Trapnell, Steven Roberts

TL;DR
This study identifies genes involved in the early development of germ cells in Pacific oysters, offering insights into reproductive biology and potential applications in aquaculture.
Contribution
The study provides the first single-cell transcriptomic atlas of early developmental stages in a lophotrochozoan bivalve, focusing on germ cell specification.
Findings
Gastrula-stage vasa-positive cells likely represent primordial germ cells in Pacific oysters.
Candidate genes involved in transcriptional repression, chromatin architecture, and DNA repair are uniquely expressed in these germ cells.
Some novel, non-homologous genes are also uniquely expressed in the germ cell lineage.
Abstract
Primordial germ cells (PGCs) are the precursor cells of gametes and pivotal in understanding reproductive and developmental biology. Importantly, having a thorough understanding of PGC specification is leading to critical advances in sterility induction in aquaculture species. In shellfish, however, the ability to develop these approaches is hampered by the lack of information available regarding germ cell specification. The goal of this study was to identify genes uniquely expressed in these earliest germ cells of the economically and ecologically important bivalve mollusc, the Pacific oyster (Crassostrea (Magallana) gigas). To capture specification of the PGCs - which represent a rare cell type - during embryonic development, we analyzed single-cell transcriptomes during cleavage, blastula, and gastrulation stages of C. gigas development. We identified cells in gastrulae that likely…
Genes, proteins, chemicals, diseases, species, mutations and cell lines named across the full text — each resolved to its canonical identifier and authoritative record.
Click any figure to enlarge with its caption.
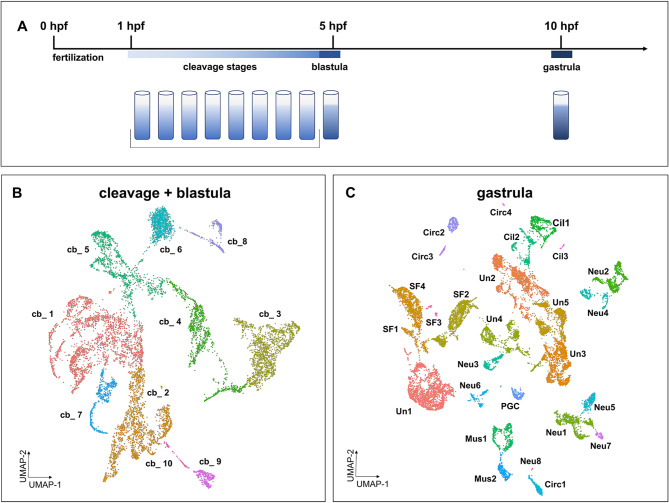 Figure 1
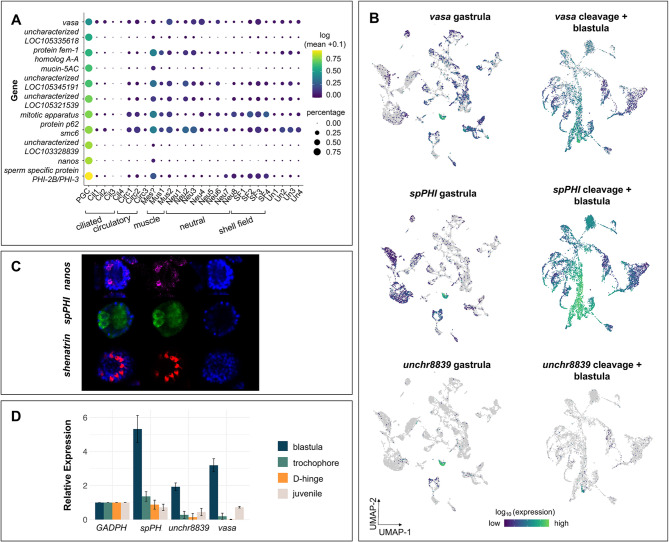 Figure 2
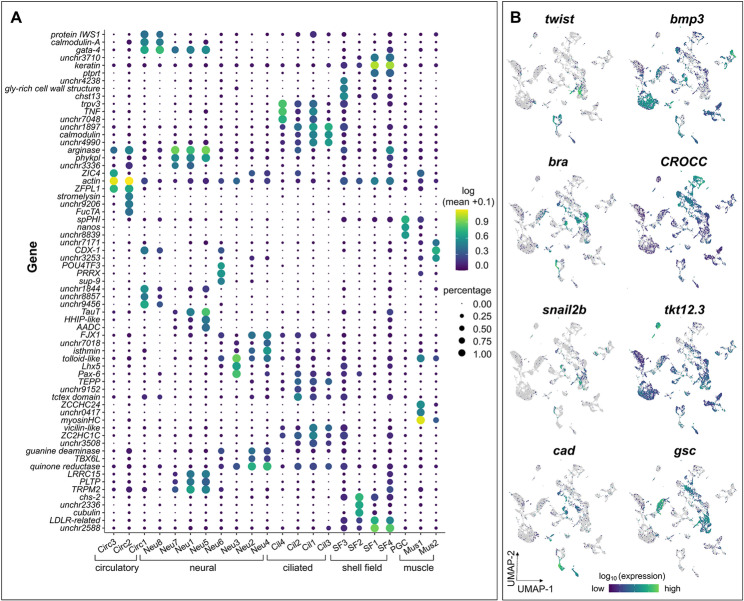 Figure 3
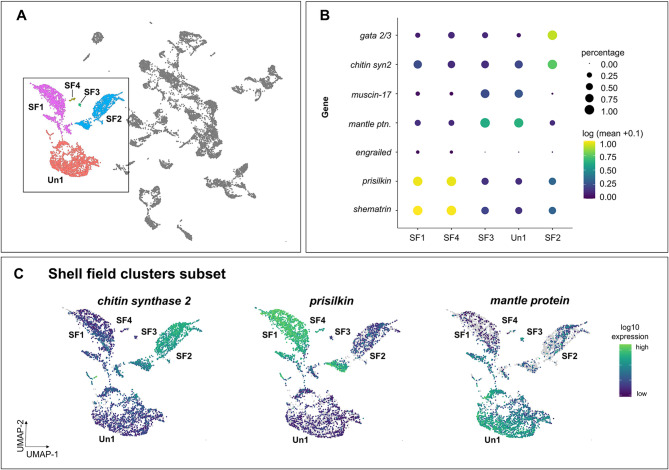 Figure 4
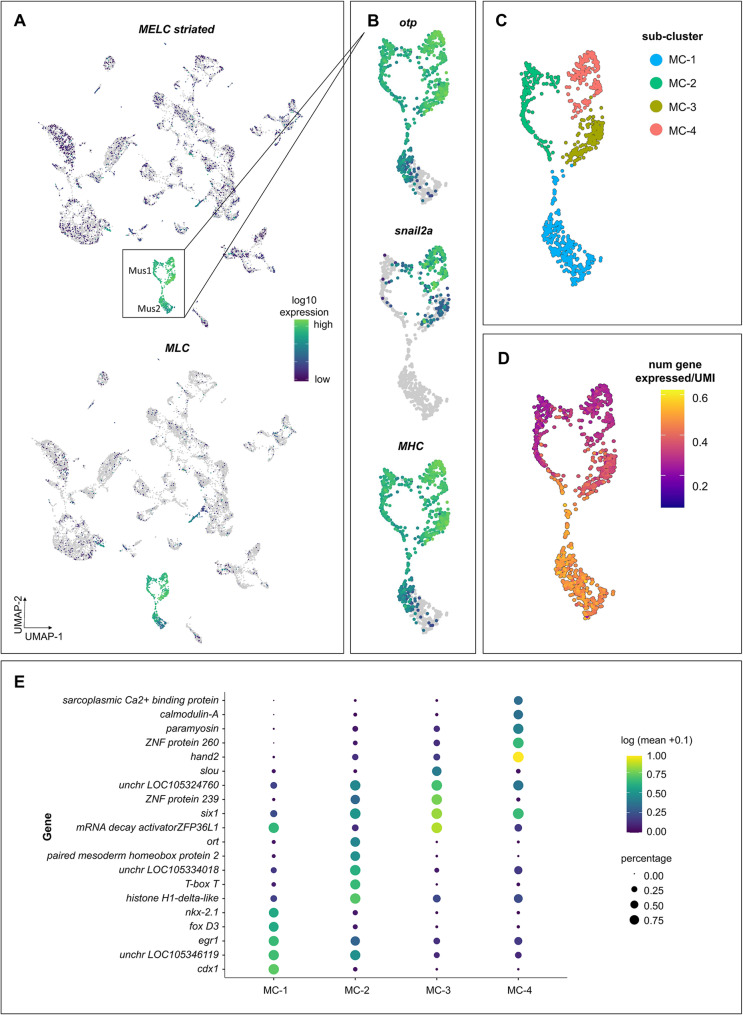 Figure 5
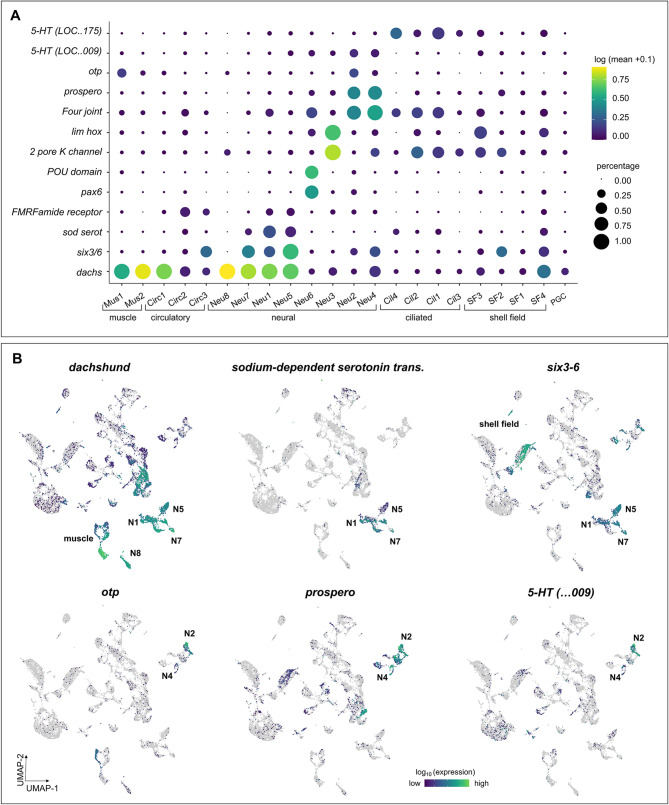 Figure 6
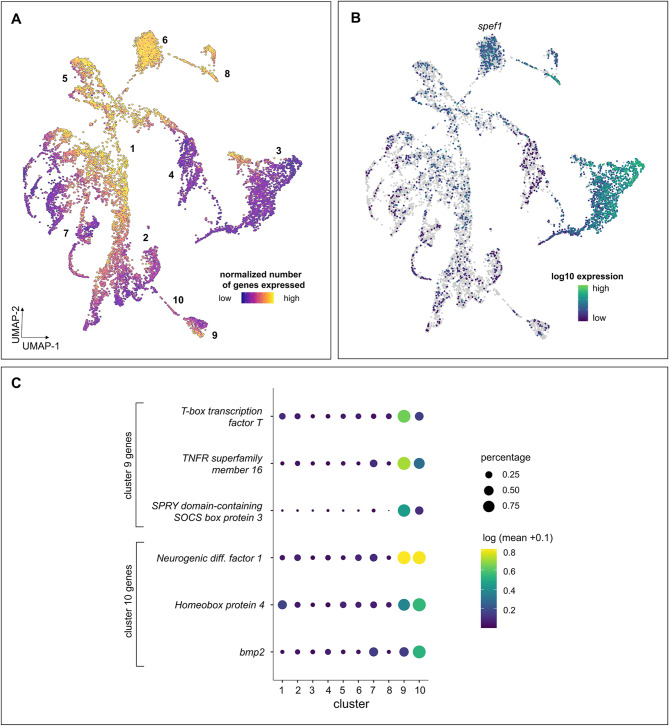 Figure 7
- —NOAA, Office of Aquaculture
- —https://doi.org/10.13039/100005799Washington Sea Grant, University of Washington
Peer Reviews
No public reviews on file for this paper yet. If you reviewed it on a platform where reviews are public (OpenReview, ICLR, NeurIPS, ICML), you can paste yours below so the community can read it here.
Videos
No videos yet. Explain this paper in a talk, walkthrough, or lecture? Add one.
Taxonomy
TopicsMarine Bivalve and Aquaculture Studies · Marine Biology and Environmental Chemistry · Marine Ecology and Invasive Species
Background
Primordial germ cells (PGCs) are specialized cells that give rise to self-renewing germinal stem cells (GSCs; germline), which subsequently differentiate into gametes in the gonad. Because disruption of germline development can result in sterility, perturbation of PGC development is being explored as a means to produce sterile animals for use in aquaculture [1–4]. Sterile or non-reproductive shellfish are both a market-driven need and an ecologically sustainable approach to increasing food production via aquaculture. Sterility has clear advantages in shellfish aquaculture including the ability to improve rates of growth and meat quality, prevent accidental establishment of non-native species into the environment, and preclude genetic contamination of wild, native bivalve populations by farmed conspecifics [5, 6].
The Pacific oyster Crassostrea (Magallana) gigas ([7]; but see [8, 9]) is one of the world’s most economically important bivalves, approaching a million metric tons farmed annually [10]. Crassostrea sp. are also among the best characterized molluscan model systems for evolution and development (evo-devo), genetics, and cell biology (reviewed in [11]) and provide important ecosystem services [12]. Efforts to generate sterile oysters for aquaculture to date have involved creation of triploid (3n) individuals [5, 13, 14]. The shellfish aquaculture industry produces triploid oysters due to their reduced gonad development, year-round marketability, and improved performance traits when farmed [15–19]. Although use of triploids in aquaculture has been widely adopted, increasing reports of triploid mortality under environmentally stressful conditions [20–22] highlight the critical need for alternative methods to induce sterility in farmed oysters.
An alternative approach to achieving sterility in bivalves, that has the potential to avoid production issues associated with triploidy, is the induction of sterility via perturbation of genes essential for PGC formation. The power of this biotechnological approach has been realized recently in finfish species, where suppression of the germ-cell specific gene, dead end (dnd), produced several fish species with no detectable germ cells [1, 23, 24]. However, gaining a thorough understanding of the genetic programs underlying germ cell fate is a critical step toward controlling reproduction through molecular approaches such as these. In bivalves, PGC development is largely uncharacterized beyond descriptions of expression of the conserved germline marker gene vasa [25–28], a deadbox RNA helicase [29–31]. While other known marker genes for vertebrate PGCs and germline such as dnd [32] are not present in molluscs, previous studies in C. gigas have demonstrated that vasa is highly expressed in PGCs and necessary for normal oyster PGC development [25–27]. Gene expression analysis in early germ cells is challenging to assess because the germline is sequestered from somatic cells early in embryonic development in most animals (reviewed in [33]) and typically has relatively low amounts of transcriptional activity to protect it from introduction of mutations [34]. Identification of genes involved in oyster PGC specification has been elusive due to a lack of targeted sequencing efforts with sufficient cell-level resolution, as germ cell precursors make up only a small fraction of the cells in developing embryos.
Single-cell RNA-seq (scRNA-seq) has emerged as a powerful technique to identify and molecularly characterize rare cell populations in developing organisms, including other marine invertebrates [35–38], revealing transcriptional signatures associated with early specification and differentiation of cell types including of PGCs [35, 39–41]. In invertebrate gastrulae, scRNA-seq has been an effective technique to identify cell-type differentiation trajectories, discover novel genes associated with developing tissues, and better understand gene regulatory networks [35, 36, 42, 43]. While there are single-cell transcriptomic resources for oyster trochophore larvae [38] and a variety of adult tissues [44, 45], earlier developmental time points have not previously been reported in oysters or other lophotrochozoan taxa.
Here, we apply scRNA-seq to profile C. gigas early cleavage stages, blastulae, and gastrulae to comprehensively identify and characterize single-cell gene expression in whole developing animals with a primary focus on PGC specification. We show that PGC sequestration occurs prior to gastrulation and identify novel PGC-specific genes that will be used as candidates for future gene knockdown/silencing experiments to develop sterile shellfish for aquaculture efforts. We present the earliest single cell developmental time series atlas for a lophotrochozoan, data which provide novel insights into formation of a variety of larval tissues in the model bivalve C. gigas. We posit that these datasets are robust resources for exploring transcriptional activities, cell states, and cell-type differentiation early in oyster embryonic development.
Methods
Experimental design and C. gigas sampling
Gravid adult C. gigas were generously provided by Taylor Shellfish Hatchery (Quilcene, WA, USA). All steps were conducted at room temperature (approximately 20℃). Male or female gonad tissues were submerged in filtered seawater (FSW) (0.2 μm filter, salinity ~ 29 ppt.) and gametes gently removed by agitating the tissue using a lab spatula. Isolated oocytes were passed through a 90 μm filter, then collected with a 20 μm filter to remove debris. Oocytes were then allowed to hydrate for 1 h in FSW. Oocytes were visually assessed with a microscope to ensure complete hydration prior to fertilization. Spermatozoa were separated from the gonad of a male oyster using a lab spatula in approximately 20 mL of FSW. Sperm were observed with a microscope to qualitatively confirm motility. A small volume of sperm suspension was mixed with eggs to initiate fertilization (at 1:200 sperm solution to eggs). Mixed gametes were incubated for 10 min at room temperature. Fertilized oocytes were again screened on a 20 µM filter and rinsed with FSW to remove excess spermatozoa, and subsequently maintained in FSW during development.
To measure genes uniquely expressed in C. gigas PGCs and/or PGC precursors, we collected embryos at the earliest reported developmental stages for the expression of vasa [26]. We collected early embryos from 8 time-points representing a continuum of development from cleavage- to blastula-stage embryos (Fig. 1A). Development in oysters can be asynchronous and samples were visually assessed to ensure that the majority (>50%) of embryos were at similar developmental stages. To collect cleavage-stage embryos, samples were taken after each cell division (~ 35 min) and placed on ice to arrest further development. Embryos were counted and 10,000 embryos for each of the first four cleavage samples, and 100,000 embryos for the remaining four cleavage samples (to account for the smaller proportion of cells that may represent the putative germ cells in the later cleavage-stage embryos) were pooled for cell dissociation and library preparation. To collect blastula-stage embryos, a sample was taken approximately 35 min after the last cleavage stage (approximately 6.5 h-post fertilization (hpf)). Approximately 300,000 blastula-stage embryos were collected in FSW for cell dissociation and library preparation. To collect gastrulae, embryos were sampled 10 hpf [46]. Approximately 40,000 gastrulae were collected in FSW for cell dissociation and library preparation.
Fig. 1. Single-cell transcriptional heterogeneity of early C. gigas embryos increases with developmental time. (A) Sampling design: cleavage-stage embryos were pooled into a single sample representing all cleavage stages. A sample of blastula-stage embryos were collected and sequenced in a separate library to allow the identification of the developmentally oldest cells in the pool. Gastrula-stage embryos sampled at 10 hpf for reference. (B) UMAP visualization of single-cell clustering of the cleavage (pre-blastula) + blastula stage (cb) that revealed 10 putative clusters. (C) UMAP visualization of single-cell clustering of the gastrula stage. Twenty-seven putative clusters representing broad cell types were resolved using UMAP clustering analysis (Cil, ciliated cells; Circ, circulatory system-related; Mes, undefined mesodermal derivatives; Mus, muscle-related; Neu, neuronal; PGC, primordial germ cell; SF, shell field; Un, undefined)
Cell dissociation and scRNA-seq library preparation
Gastrula-stage embryos were rinsed three times, while gradually decreasing the salinity: first in FSW, next in 0.75x calcium- and magnesium-free artificial seawater, salinity ~ 30 ppt (ASW), then in 0.5x ASW, and then finally in 0.3x ASW. Embryos were dissociated to single-cell suspensions with 500 µL of 10 mg/mL protease (Native Bacillus licheniformis protease; Creative Enzymes, Catalog Number: NATE0633) in 0.3x ASW incubated at room temperature for 15 min with intermittent gentle pipetting with a P1000 pipette. Cells were visualized on a microscope to monitor dissociation efficiency. The dissociation reaction was halted by transferring cells to ice-cold Dulbecco’s phosphate-buffered saline (dPBS, ThermoFisher; Catalog Number: 14190144, pH 7.0-7.3) containing 10% fetal bovine serum (FBS; Thermo Fisher; Catalog Number A4736401). The dissociated cells were filtered through a 30 μm filter into a 15 mL tube, centrifuged (600 rcf, 5 min at room temperature) and resuspended in 5 mL 0.3x ASW. This rinse was repeated, followed by resuspension in 200 µL 0.3x ASW. Cells were counted and viability assessed using 0.2% Trypan blue (HyClone; Catalog Number: SV30084) on a Bright-Line Hemacytometer (Hausser Scientific, Catalog Number: 3110). To process cleavage-stage and blastula samples, cell dissociation was performed similarly with the exception that embryos were rinsed once in room temperature FSW and then resuspended directly in dPBS for subsequent dissociation, filtering, and rinsing steps.
Cells were prepared for sequencing using the 10X Genomics Chromium platform [47]. Single-cell mRNA libraries were prepared using the Chromium Next GEM Single Cell 3’ GEM, Library & Gel Bead Kit v3.1 (10x Genomics, Pleasanton, CA, USA). Approximately 24,000 cells (split equally across 4 reactions) were targeted for the gastrula sample, approximately 18,000 cells (split equally across 3 reactions) were targeted for capture for the cleavage pool and 6,000 cells were targeted for the blastula sample. Quality control and quantification assays were performed using a Qubit fluorometer (Thermo Fisher, Catalog Number: Q33238) and a D1000 Screentape Assay (Agilent, Catalog Number:5067–5582). Libraries were sequenced on two Illumina NextSeq 500 75-cycle, high output kits (v2.5; Illumina, Catalog Number: 20024906).
Processing of scRNA-seq reads
Sequencing reads were processed using the Cell Ranger pipeline (v3.1.0, 10X Genomics). A custom C. gigas STAR genome index was built using gene annotations from the “cggigas_uk_roslin_v1” version of the genome (GenBank: GCA_902806645.1) and filtered for protein-coding genes using the mkref command. Cell barcodes and unique molecular identifiers (UMIs) were determined using the Cell Ranger count command. To ensure accurate calling of cells, a more stringent filter requiring 2000 UMIs per cell was applied to cell calling from Cell Ranger (Fig. S1). GitHub repo with code: https://github.com/RobertsLab/pgc-edc-oyster.
In total, approximately 8 × 10^8^ GB of sequencing data were generated across the cleavage-stage, blastulae and gastrulae libraries (NCBI SRA: PRJNA906172). Post-filtering, a total of 18,511 cells (9,314 median UMIs and a median 2,828 genes per cell) were analyzed for the gastrulae, 7,658 cells (4,056 median UMIs and 1,949 median genes per cell) for the cleavage-stage embryos, and 2,836 cells (5,232 median UMIs and 2,277 median genes per cell) for the blastulae embryos. Mapping was consistent across libraries with 80–85% of reads mapping to the C. gigas genome. See Table S1 for additional sequencing and mapping information. Data for cleavage-stage and blastula cells were combined for downstream analysis.
Dimensionality reduction, clustering and cell-type annotation
After cell calling and quality control, single cell data analysis was performed using Monocle3 [48] (v1.3.4), following a standard processing pipeline: (1) log normalization of gene counts and PCA analysis with retention of the 20 top principal components for (2) projection of data into two dimensions with Uniform Manifold Approximation and Projection (UMAP) [49] (umap.min_dist = 0.2,* umap.n_neighbors = 15 L*) and (3) Leiden clustering to group cells. UMAP visualization and clustering was performed separately for the gastrulae, and combined for the cleavage-stage and blastula embryos. The function align_cds [50] was used to minimize batch effects of replicate libraries in low dimensional space. All genes were provided as input into Principal Component Analysis (PCA). For cell clustering, we manually adjusted the resolution parameter towards modest overclustering. Genes that were highly expressed and specific to a particular cluster (referred to here as ‘marker genes’) were identified in order to facilitate the annotation of cell clusters to a particular cell type. Specifically, the function top_markers (group_cells_by = “cluster”, reference cells = 1000 (Monocle3 v.1.3.4 [47, 51] was used to identify the genes most specifically expressed in each cluster. The 25 most specifically expressed genes by “marker_score” (a value between 0 and 1 based on the fraction of cells expressing the gene scaled by a measure of how specific the gene’s expression is to the cluster) are reported in Tables S2-S4.
Annotation of C. gigas genes to homologs in model invertebrates
In order to facilitate direct comparisons of C. gigas marker genes identified here to those in other model marine invertebrates, an iterative BLAST was performed to Caenorhabditis elegans,* Drosophila melanogaster* and Strongylocentrotus purpuratus databases (the top BLAST hit and corresponding e-value reported in Tables S2-S4). Specifically, the full set of C. gigas genes (GCF_902806645.1_cgigas_uk_roslin_v1_translated_cds.faa) was compared to SwissProt database (20210613_ncbi_sp_v5/swissprot (blastp)), C. elegans protein database (Caenorhabditis_elegans.WBcel235.pep (blastp)), D. melanogaster nucleotide database (dmel-all-CDS-r6.37 (tblastn)) and the S. purpuratus protein database (ProteinsSpur5.0 (blastp)) using NCBI BLAST [52]. Marker genes used to assign cell or tissue identities to UMAP clusters were manually screened using iterative reciprocal protein BLAST to assess predicted gene homology.
Semi-quantitative PCR
RNA was extracted from pooled embryos (6 hpf blastula) or larvae (18 hpf trochophore, 26 hpf D-hinge) and whole tissue from 8-month-old juveniles using Tri Reagent (ThermoFisher, Catalog Number: 15596018), following the manufacturer’s protocol. The amount of cDNA was normalized and 200 ng of cDNA were loaded into each PCR reaction. PCR amplifications were performed in a 25 mL reaction volume consisting of 9.5 µL nuclease-free water, 12.5 µL GoTaq master mix (Promega, Catalog Number: M7122), 1 µL 10 µM forward primer, 1 µL 10 µM reverse primer, 1 µL cDNA template. Amplification was performed on a T100 Thermal Cycler (Bio-Rad): initial denaturation, 2 m at 95 °C, followed by 35 cycles of 30 s at 95 °C for denaturation, 30 s at 60 °C annealing, 60 s at 72 °C for extension, and final extension at 72 °C for 10 min. The PCR products were then assessed by gel electrophoresis at 100 V for 30 min in a 1.25% (w/v) agarose gel in 1 x TAE buffer using SYBR Safe (Thermo Fisher, Catalog Number: S33102).
GAPDH was used as a housekeeping control gene and expression of PGC-related genes nanos,* vasa*,* sperm-specific protein PHI-2B/PHI-3* (spPHI), uncharacterized gene LOC105328839 were assessed using semi-quantitative PCR (Table S5). Two biological replicates (either pooled larvae from different parent crosses or individual juvenile oysters) and at least two technical replicates were performed for each timepoint for each gene. Gel band quantification was performed using FIJI software [53].
Hybridization chain reaction (HCR)
We performed HCR on oyster gastrula (10–14 hpf) following the cephalopod HCR protocol (HCR 3.0, Molecular Instruments, Los Angeles, CA, United States; [54, 55], with the following modifications. Samples were fixed in 4% paraformaldehyde in FSW overnight at 4 °C, washed thoroughly with PBS + 0.1% Tween-20 (PTw), and proceeded immediately without exposure to methanol. HCRs were performed in a 24-well flat-bottomed culture plate. Probes for oyster HCR were as follows: shematrin (LOC105342064; 20-probe set; Amplifier B4; Fluorophore 546), spPHI (LOC105327445; 20-probe set; Amplifier B3; Fluorophore 488), and nanos (LOC105347430; 20-probe set; Amplifier B2; Fluorophore 647). Following hairpin incubation, samples were washed 6 times in 5X SSC + 0.1% Tween-20, counterstained with DAPI, and imaged. Imaging was performed on a Nikon Ti (Eclipse) inverted microscope with Ultraview Spinning Disc (CSU-X1) confocal scanner (Perkin Elmer). Images were captured with an Orca-ER Camera using Volocity (Quorum technologies) and processed using FIJI [53].
Results
We applied single-cell transcriptomics to analyze gene expression profiles in C. gigas early developmental stages: combined early cleavage-stages through blastulae and gastrulae (Fig. 1A). A total of 7,658 and 2,836 cells for the cleavage-stage and blastulae embryos respectively and 18,511 cells were analyzed for the gastrulae. Due to maternal mRNAs and undifferentiated cell states [56, 57], sequencing data from the earliest developmental stages (cleavage + blastula embryos) yielded few distinct cell clusters (Fig. 1B). In contrast, gastrula stage embryos showed a high degree of heterogeneity (Fig. 1C) and we identified early genes associated with tissue progenitors such as PGCs, shell field, muscle, and neurons (Table 1; Fig S2; Table S6).
Table 1. Gastrulae cluster identification.** ‘**Selected informative expressed genes’ were identified using a combination of highly conserved bilaterian marker genes, previously identified genes expressed in specific tissues or cells in other molluscs, and genes identified from the top marker analysis (see table S6 and Fig. S2 for gene identification numbers and visual representation of expression respectively)UMAPClusterClusterNameSelected Informative Expressed GenesAssociated Germ LayerAssociated Tissue or Cell Type1Un1HoxA7, HoxA1, HoxA5, HoxB7, eve, bmp1, bmp3, HTRmesodermundefined2Un2myosin ii HC, gsc, cdx, bmp2/4, gata2/3endomesodermundefined3Un3foxA, gsc, twist, chordin, dachshund, six3/6, bmp2/4, sox2, caveolin-3ectomesodermundefined4SF1HoxA5, keratin, shematrin, prisilkin-39, bmp1ectodermshell field5Un5brachyury, cdx, foxAmesoderm?gut-associated?6SF2bmp1, bmp2/4, bmp3, chs2, keratin, shematrin, prisilkin-39, gsc, sox2, gata2/3, HoxA5ectodermshell field7Un4brachyury, cdx, snail2b, gata2/3, myosin LC, HoxB7, bmp3, sox2ectomesodermundefined8Neu1six3/6, TRPM2, FMRFaR, sox2, foxAectodermneural9Neu2otp, gsc, HoxA1, bmp3, six3/6, prospero, sox2, FMRFaR, HTR, VMAT, four-jointedectodermneural10Cil1zinc finger C2HC domain-containing protein 1 C, CFAP44, CROCC, DNAH7, CFAP77, four-jointedectodermciliated cells11Mus1bmp3, myosin LC, myosin HC, dachshund, brachyury, snail2a, snail2b, twist, otpendomesodermmuscle12Cil2TUBA1A, RSPH1, HTR1, four-jointedectodermciliated cells13Neu3pax6, LHX5, bmp1, PCDH11, myosin HC II-likeectodermneural, sensory14Neu4snail2b, six3/6, neurogenin-1, HTR, four-jointed, sox11ectodermneural15Neu5six3/6, DOPA decarboxylase, HHIPL1, gat3, dachshund, SERTectodermneural16Circ1dachshund, foxA, caudal, criptoectomesodermcirculatory17Neu6PRRX2, sup-9, homeobox unc-42, caudal, VMATectomesodermneural18Mus2dachshund, myosins, bmp3, caudal, sox11endomesodermmuscle19PGCnanos, vasaPGCsgerm cells20Circ2fli-1, nkx2.5mesoderm?circulatory21Circ3myophilin, ZIC-4, rax, SBSB3, FMRFaR, nkx2.5mesoderm?circulatory22Neu7six3/6, dachshund, foxQ2, FMRFaR, SERTectodermneural23Cil3myosin HC II/trichohylin, foxJectodermciliated cells24Cil4HTR1ectodermciliated cells25SF3sodium-dependent glucose transporter 1 A, mucin-17, HoxA5ectodermshell field26SF4shematrin, cytoskeletal keratins, HoxA5ectodermshell field27Neu8dachshund, DUXB, sox11, cdx, foxAectodermneural, sensory
Early developmental origins of PGCs in the oyster C. gigas
PGCs are transcriptionally distinct by the gastrula stage in the oyster C. gigas
To identify PGCs in developing C. gigas embryos and determine co-expressed genes that may be important for oyster PGC specification we first searched our datasets for potential PGCs using the previously characterized oyster germline marker gene vasa (Fig. 2; Table 2) [25, 26]. In our C. gigas gastrulae dataset, one cell cluster showed both high expression of vasa and also had the highest proportion of vasa-expressing cells within the cluster (Fig. 2A-B). Although vasa expression was relatively specific to this cluster at this developmental stage and one of its top 25 marker genes, nanos, an evolutionarily conserved repressor of transcription shown to be expressed exclusively in the oyster germline [58, 59] showed even higher cluster specificity, providing further support that the cells in this cluster represent developing PGCs (Fig. 2A-B; Table 2). The specific expression of both vasa and nanos indicates that this single cluster of cells likely represents PGCs in oyster gastrulae (Fig. 2).
Fig. 2. Tracing the expression of vasa identifies a single putative PGC cluster in C. gigas gastrulae. (A) Dot plot heat map displaying the expression of marker genes identified in the PGC cluster in gastrulae across all clusters. Dot color represents expression level and dot size represents fractional representation of cells expressing a gene. (B) UMAP visualization of expression of select PGC marker genes in gastrulae (left) and cleavage + blastula embryos (right): vasa expression is primarily limited to a single cluster in the gastrula stage whereas expression is broader in the earlier cleavage + blastula stages (top); spPHI shows high specificity to the PGC cluster in gastrulae, while expression is widespread in cleavage + blastulae embryos (middle); an uncharacterized oyster-specific gene (LOC105328839) shows high levels of expression specifically in PGC cluster in gastrulae, but is only expressed in a small number of cells in cleavage + blastula embryos (bottom). (C) HCR localization of expression of candidate PGC genes spPHI and nanos, and a shell field gene shematrin. Samples were counterstained with Hoechst. (D) Expression of selected genes that are highly expressed in the putative PGC cluster in gastrulae: spPHI (LOC105327445), uncharacterized protein (LOC105328839), and vasa (LOC105335166) across life history stages from whole tissues as determined by semi-quantitative PCR. Results were normalized to GAPDH (LOC105340512) expression
Table 2. Top 10 marker genes for the PGC cluster in C. gigas gastrulaeGene IDGene NameMarker ScoreSwiss Prot IDConserved DomainsProtein IDsLOC105328839uncharacterized LOC1053288390.73N/AN/AXP_034312373.1LOC105347430protein nanos0.70P60321zinc finger - Nanos superfamily (cl05351)XP_011454832.3LOC105327445sperm-specific protein PHI-2B/PHI-30.63Q3HNG7linker histone 1/5 domain (cl00073)XP_011426236.2LOC105318512mucin-5AC0.63N/AN/AXP_011413998.2LOC105335618uncharacterized LOC1053356180.60N/AN/AXP_034338648.1LOC105321539uncharacterized LOC1053215390.51N/AN/AXP_011418154.2LOC105345191uncharacterized LOC1053451910.36Q93075metallo-dependent_hydrolases (cl00281)XP_011451571.2LOC105321610structural maintenance of chromosomes protein 60.35Q6P9I7RecF/RecN/SMC N terminal domain (cl37666), Smc (cl34174)XP_034314486.1LOC105346676mitotic apparatus protein p620.34P91753Nucleoplasmin-like domain (cl03870)XP_034328868.1LOC109619157protein fem-1 homolog A-A0.32Q7T3P8Ankyrin repeats (cl39094)XP_034314173.1Marker Score = the fraction of cells expressing the gene scaled by specificity
This cluster (which we will hereafter refer to as PGCs) also specifically expressed genes involved in transcriptional silencing, stemness, germline and gamete development, and chromatin remodeling and maintenance (Fig. 2A; Table 2). Many genes uniquely expressed in the oyster gastrula PGC cluster have previously been associated with germline development and maintenance in other animals, a pattern that has been described previously [58]. For example, the gene with the highest overall expression in the PGC cluster is a protamine-like histone variant, annotated as ‘sperm-specific protein PHI-2B/PHI-3’ (spPHI) (Fig. 2; Table 2). An orthologous gene has been described in the bivalve Mytilus californianus, where it is uniquely expressed in spermatozoa [60]. Interestingly, there are also genes uniquely expressed in the PGC cluster with unknown germline functions (Fig. 2A; Table 2). These include an uncharacterized C. gigas gene LOC105328839 (Fig. 2A-B; Table 2), a mollusc-specific protein that exhibits some amino acid sequence homology to mucins.
We also performed spatial gene expression (HCR) in mid-to-late stage gastrulae to localize the expression of select PGC-associated genes (nanos and spPHI). To spatially orient the embryonic patterns of gene expression in gastrulae, we additionally performed HCR for the shell field gene shematrin (Fig. 2C). The spPHI gene, described here in oysters for the first time, is most highly expressed in PGCs in our gastrulae sequencing data and shows lower levels of expression in shell field and muscle clusters. HCR images of spPHI show several areas of expression, appearing as lobe-like circles on both regions of the embryos. We found that nanos has biased expression in one area of the embryo in two small groupings of cells, in agreement with previously reported expression data by Xu et al. [59] who observed two clusters of nanos expression in gastrula and later larval stages. Shematrin expression is localized to the developing dorsal side of the embryo, similar to patterns of shell field-associated genes described previously in oyster trochophores [38].
These data taken together support the identification of a specific cluster of cells in our single-cell sequencing analysis that likely represents PGCs in C. gigas gastrulae.
Some genes associated with PGCs are expressed prior to gastrulation
Cells from the earliest cleavage stages (2- to 512-cell) through the blastula stage were analyzed together to identify genes uniquely expressed in the earliest germ cells and to potentially track PGC formation in C. gigas (Figs. 1B and 2B). Genes associated with PGC development were expressed at these early developmental stages. Early embryos display wide expression of vasa; however, some clusters show relatively elevated levels of vasa expression (Fig. 2B). Many marker genes identified as being uniquely expressed in the gastrula PGC cluster were either not detected or showed broad expression in the cleavage-blastula cells (Fig. S3). Interestingly, spPHI, was co-expressed in vasa-expressing cells in these early embryos (Fig. 2B).
To temporally assess expression of selected PGC marker genes identified through our sequencing analysis, we performed semi-quantitative PCR on pooled blastulae, trochophores, and early D-hinge larvae, as well as individual 8-month-old juveniles. Expression of spPHI, uncharacterized gene LOC105328839, and vasa is relatively high in blastula but decreases significantly as larval development progresses (Fig. 2D).
Single-cell transcriptomics highlights tissue-specific progenitors in C. gigas gastrulae
While gene expression atlases are not as well defined for bivalves compared to more established invertebrate developmental models like sea urchin [35, 36] and Drosophila [42], we were able to broadly define oyster gastrula cell clusters by assessing expression of evolutionarily conserved metazoan marker genes. These include identification of cell populations corresponding to highly ciliated cells, muscle, shell field, epidermis, neuronal precursors, and some undifferentiated cells (Fig. 3A-B; Table 1). To annotate these 27 clusters with putative cell-type information (Fig. 1C), we queried the dataset using a combination of highly conserved bilaterian marker genes and previously identified genes expressed in specific tissues or cells in other molluscs (Table 1; Fig S2; Table S6).
Fig. 3. Single-cell transcriptomics highlights tissue-specific progenitors in C. gigas gastrulae defined by expression of evolutionarily conserved germ layer markers and novel genes identified via cluster analysis. (A) Dot plot illustrating expression of the top 3 marker genes (by marker_score) associated with each UMAP cluster. Dot color represents expression level and dot size notes fractional representation of cells expressing a gene. (B) Expression patterns of select genes associated with developmental markers in UMAP space
Evolutionarily conserved germ layer and ciliated cell markers are expressed in C. gigas gastrulae
Bivalve embryos and larvae are often highly ciliated, with prototroch precursors developing during the gastrula stage [61]. We identified multiple clusters representing putative ciliated cells with high levels of expression of well-established ciliary genes (Cil1-4; Table 1; Fig. 3). For example, we found that rootletin (CROCC (Ciliary Rootlet Coiled-Coil)) is one of the most specifically expressed genes in the ciliated cell clusters, along with trichohyalin, dynein, tektin, foxJ, and multiple tubulins, which are expressed in ciliated cell types in other bilaterian larvae [37, 38, 62, 63]. Interestingly, caveolin, shown to be expressed in the developing prototroch of Dreissena trochophore larvae [37], is one of the most specifically expressed genes in cluster Un3, which also has other ectomesodermal expression signatures (Table 1).
In C. gigas gastrulae, expression of mesodermal markers bra,* twist*, and snail2 expression is high in portions of some undefined clusters (Un2-5), as well as some cells in shell field cluster SF2 and muscle cluster Mus1 (Fig. 3B), indicating that these clusters likely represent mesodermal derivatives. Bone morphogenetic protein 3 (bmp3), which is expressed in endomesodermal tissues in larval pearl oyster [64], shows widespread expression in putative endomesodermal clusters in C. gigas gastrulae, including portions of putative muscle precursors (Fig. 3B). Hemocyte marker transketolase-like protein 2 (tktl2.3) [38] is highly expressed in putative circulatory-associated cluster Circ2, with lower expression in shell field clusters (Fig. 3B). In C. gigas gastrulae, caudal (cad/cdx), an ectomesodermal marker in other mollusc embryos [65–67] is expressed in clusters Neu6, Circ1, Mus2, and portions of undefined clusters Un2-5 (Fig. 3B; Table 1).
Biomineralization and ectodermal genes define shell field progenitors
We found that C. gigas gastrulae have multiple cell clusters expressing genes associated with developing shell field, with biomineralization pathway components being highly expressed in clusters SF1, SF2 and SF4 (Fig. 4; Table S2). Additionally, homeobox transcription factor goosecoid (gsc), which is expressed in both the adult mantle and larval shell field in gastropods [68] is highly expressed in SF2 as well as undefined clusters 2,3,5 (Fig. 3B). Gastrula shell field clusters also express sox2, gata2/3, and engrailed, other known genes involved in the developing shell field in C. gigas trochophores and veligers (Table 1) [69–71]. Hox1, which is expressed in the shell field of freshwater mussel trochophores [72] shows high levels of expression in clusters Un-1, as well as Neu4.
Fig. 4. Multiple clusters expressing biomineralization and ectodermal genes suggest tissue-level shell field organization is becoming defined by the mid-gastrula stage. (A) UMAP color inset coded by clusters associated with the developing shell field in C. gigas gastrula embryos. (B) Dot plot illustrating expression of genes expressed in shell field subclusters. Dot color represents expression level and dot size represents fractional representation of cells expressing a gene. (C) Expression patterns of select genes associated with shell field clusters in UMAP space
Interestingly, even at this early developmental stage, expression patterns of mantle or shell field-associated genes show differences between shell field clusters (Fig. 4B, C). For example, genes involved in chitin synthesis are highly expressed in SF2, while shematrin and prisilkin-39 are expressed in SF1 and SF4 (Fig. 4B, C; Fig. S2), suggesting that these tissue-level shell field distinctions are becoming defined by the mid-gastrula stage. SF3 shows preferential expression of mucin-17; mucins have been shown to be involved in biomineralization processes in mussels [73]. Interestingly, mantle protein (LOC105326721) is expressed at a higher level in Un1 and SF3 compared to the other putative shell field clusters, though these two clusters do not have substantial expression of biomineralization genes.
Muscle precursors
Two gastrula cell clusters show expression of known muscle marker genes including myosin, troponin, and twist, indicating that these clusters likely represent muscle precursors (Mus1, Mus2; Fig. 5A; Table S2). Myosin essential light chain (MELC; striated adductor muscle; LOC105317061), which has been demonstrated by in-situ hybridization to be expressed as early as blastula stage in C. gigas [74], is highly expressed in both clusters Mus1, Mus2 (Fig. 5A). An additional MELC associated with smooth adductor muscle (LOC105320997) also shows high levels of expression in the putative muscle precursor clusters. In C. gigas gastrulae, twist, a basic helix-loop-helix (bHLH) transcription factor essential for development of the mesoderm, is expressed in cluster Mus1, with highest expression observed in portions of putative ectomesodermal cluster Un3 (Fig. 3B). Within the clusters of muscle precursors, there appear to be some further separation of cells based on gene expression differences. For example, otp is expressed in only half of cluster Mus1 (Fig. 5B). Myosin heavy chain (mhc, LOC105338907) is highly expressed in cluster Mus1, with some expression of adjacent cells in cluster Mus2 (Fig. 5B).
Fig. 5. Two clusters expressing genes associated with the development of larval muscle in C. gigas gastrulae.** (A**) Expression of myosin essential light chain - striated muscle (MELC striated) and myosin light chain (MLC) are highest in the two putative muscle-associated clusters of gastrulae in UMAP space. (B) Expression of muscle-related genes otp, snail2a and MHC show variation in expression within each putative muscle cluster. (C) Sub-cluster analysis of muscle-associated clusters identified four sub-clusters. (D) Visualizing the number of genes expressed per cell suggests a potential developmental trajectory, with cells from cluster Mus1 representing the developmentally oldest cells. (E) Dot plot illustrating expression of muscle-associated marker genes of each associated sub-cluster. Dot color represents expression level and dot size represents fractional representation of cells expressing a gene
To assess developing muscle cell progression through the differentiation process, we performed focused clustering and pseudotime analyses of clusters Mus1 and EnM-Mus2. These two clusters subsequently yielded four sub-clusters (MC 1–4) and a potential developmental trajectory based on the number of genes expressed per cell, which can be used as a proxy for developmental progress [75] (Fig. 5C-D). Muscle cluster-1 is defined by high expression of transcription factors associated with endomesodermal and muscle specification (Fig. 5E), consistent with an analysis showing a relatively higher number of genes expressed per cell suggestive of a “younger” developmental age [75] (Fig. 5D). Mus3 shows slightly fewer genes expressed per cell compared to Mus1, but cells in this cluster also express genes associated with muscle tissue differentiation. For example, a homolog of the Drosophila gene slouch (LOC105345169) - a homeodomain-containing protein involved in muscle specification [76] - is one of the defining marker genes for Mus3 (Fig. 5E).
Putative neural and sensory cell precursors
In gastrula-stage samples, we identified multiple cell clusters expressing conserved neuronal or sensory-related genes (Neu1-8; Fig. 6; Table 1). Strikingly, we detected disparate clusters of putative neural or sensory cells based on distinct patterns of neural gene expression, even at this relatively early embryonic stage (Fig. 6). These include clusters of cells expressing the neuronal transcription factor prospero (highest in clusters Un3, Neu2, Neu4) [77], four-jointed box kinase (four-jointed; clusters Neu2, Neu4, Cil1, Cil2) [78], sodium-dependent serotonin transporter (clusters Neu1, Neu5, Neu7), and the neural and eye-associated nuclear protein dachshund (clusters Neu1, Neu5, Neu7, Neu8, as well as muscle and some portions of undefined clusters) [79].
Fig. 6. Multiple cell clusters expressing conserved neuronal or sensory-related genes are present in C. gigas gastrulae. Dot plot (A) and UMAP (B) representation of expression of select genes associated with neural clusters. For the dot plot and UMAPs, dot color represents expression level, and for the dot plot, dot size represents fractional representation of cells expressing a gene. For the UMAP, clusters with a high proportion of cells expressing a given gene are labeled for orientation
The 5-hydroxytryptamine receptor (5-HTR; LOC105348009, LOC105345175), associated with the developing apical organ in oyster trochophores [80], shows high levels of expression in clusters Neu1, Neu4, and Cil1 (Fig. 6A-B). Orthopedia (otp) is a homeodomain-containing transcription factor expressed during nervous system development in diverse clades including molluscs [65, 81]. Interestingly, we detected otp expression in only one neural-associated cluster (Neu2). We found that homeodomain-containing transcription factor six3/6 is expressed in most predicted neuronal or sensory cell clusters, as well as in some shell field clusters (Fig. 6).
The FMRFamide receptor gene shows some expression in our gastrulae dataset, though at relatively low levels (Fig. 6A; Fig. S4). Some known neural genes such as hex (LOC105339244) are expressed in other mollusc larvae but were not detected in our cleavage + blastula (Fig. S4) or gastrula datasets, possibly because these genes are not expressed until later in larval development.
Early signatures of transcriptional states of cleavage-stage and blastula embryos
Developmental ordering of cells from cleavage-stage and blastula embryos, which represent a continuum of the earliest stages of embryonic development, showed that we could identify a developmental progression of cells that is consistent with their transcriptional continuity in low dimensional space. Visualization of cells expressing the fewest genes (which are predicted to be the most differentiated cells relative to progenitors [75]) (Fig. 7A) and by visualization of the blastula cells in UMAP space (Fig. S5), showed that cluster cb_9 and portions of cluster cb_3 are likely to be some of the developmentally oldest cells. While cell-type cluster annotation is challenging at this early developmental stage, top marker analysis showed signatures of ciliated cells in cluster cb_3, which were expressing genes such as sperm flagellar protein 1 (spef1; LOC105339310) and EF-hand calcium binding domain-containing protein 6 (efcab6; LOC105337196) (Fig. 7B, Table S3). Additionally, a marker gene analysis showed clusters cb_9 and cb_10 had the highest specificity of all the clusters (Table S3) and many of these specific genes were transcription factors or other regulatory proteins (Fig. 7C, Table S3). Blastula cells were also analyzed separately. Clustering analysis identified 8 distinct clusters (Fig. S6). Marker gene analysis of blastulae only shows enrichment for diverse transcription factor families (Table S4), an indication of embryonic genome activation [30, 82, 83].
Fig. 7. Early signatures of transcriptional states of cleavage-stage and blastula embryos, representing a continuum of the earliest stages of embryonic development in C. gigas.(A) UMAP of cleavage + blastula color-coded by the normalized number of genes expressed per cell (i.e. number of genes expressed/number of UMI per cell). (B) UMAP representation of expression of select gene associated with the ciliated cluster of cleavage + blastula cells. (C) Dot plot representation of expression of top 3 marker genes associated with cluster 9 and 10 of the cleavage + blastula cells. Dot color represents expression level and for the dot plot dot size represents fractional representation of cells expressing a gene
Discussion
Sterile shellfish are both a market-driven need and an ecologically sustainable approach to increase food production via aquaculture. Technological advances in sterility induction, via inactivation of genes essential for germ cell formation and development in finfish aquaculture [1, 3, 23, 24], have poised the shellfish industry to incorporate this approach, but the lack of knowledge of the genes essential for PGC specification remains a significant barrier. To overcome this limitation, we have applied scRNA-seq to early stages of Pacific oyster embryos to identify genes involved in PGC specification. We present a robust suite of early developmental gene expression data using scRNA-seq in C. gigas. In gastrulae, though no discrete tissues are formed and the trochophore body plan is not yet defined, we identified cell clusters expressing evolutionarily conserved marker genes associated with bivalve larval tissues or cell types including muscle, shell field, neuronal cells, ciliated cells, and PGCs. We show that the molecular identity of oyster PGCs is defined by gastrula-stage, and identified and localized a number of novel genes expressed in these putative PGCs. These data also provide a rich transcriptional atlas that can be mined to address both basic and applied research questions in Pacific oyster, an emerging molluscan model species with significant commercial and ecological importance.
Characterization of genes associated with PGC formation
We were particularly interested in the unique transcriptomic signatures associated with formation of PGCs in C. gigas. The early developmental stages sequenced in this study were selected to focus on initial characterization of genes potentially involved in PGC specification, a biological process that occurs very early in embryonic development. Using the conserved germline marker genes vasa and nanos to initially select cells in oyster gastrula that likely represent PGCs, we then detected transcriptomic signatures in these cells that include both novel and previously described germline-associated genes in other invertebrates.
A gene highly expressed in the PGC cluster is a histone variant, sperm-specific protein PHI-2B/PHI-3 (spPHI), which has not been functionally characterized in C. gigas but exhibits sequence similarity to a protamine-like gene uniquely expressed in spermatozoa of Mytilus californianus [60]. It is interesting to consider the role for a protamine-like or H1 linker gene in germ cell specification in C. gigas as many animals have embryo and germline-specific H1 linker proteins [84]. In C. gigas, spPHI is broadly expressed in the earliest embryos, but its highest expression is restricted to the PGC cluster by gastrulation. This pattern is similar to expression patterns in Drosophila, in which the embryonic H1 (dBigH1) gene is expressed only in the germline, where it acts to maintain transcriptional quiescence [84]. A thorough spatial, temporal, and functional characterization of the spPHI transcripts in C. gigas is necessary to determine the role of spPHI in embryogenesis and germline formation in oysters. The gene fem-1 homolog A-A (fem-1), a stem-loop binding protein involved in processing translation and degradation of replication dependent histone mRNAs, is also expressed in the PGC cluster (Fig. 2A; Table 2). First identified in Caenorhabditis elegans, fem-1 plays a vital role in sex determination in diverse taxa, including bivalves [85–87]. Also specifically expressed in the oyster gastrula PGC cluster is structural maintenance of chromatin protein 6 (smc6) (Fig. 2A; Table 2), which has been shown to play a role in maintaining germline integrity in C. elegans [88]. Similarly, ATRX chromatin remodeler (ATRX) is expressed highly in female gonad tissue in another oyster species, Crassostrea hongkongensis [89].
In addition to known candidate genes involved in germline identity in other animals, this study sought to identify mollusc- or oyster-specific PGC genes that may not have been detected using a candidate approach. Indeed, an uncharacterized gene LOC105328839 has the highest expression specificity to the PGC cluster in C. gigas gastrulae. This gene appears to be bivalve-specific and has few conserved protein domains that may suggest a specific molecular characterization and role in the embryo. Importantly, for both spPHI and LOC105328839, we show via semi-quantitative PCR that expression peaks early in development, prior to the larval trochophore stage and remains relatively low through the juvenile stage, suggesting their embryonic functions may be exclusively associated with the developing germline.
Interestingly, with the exception of nanos and vasa, our study did not identify many previously identified gonad-specific genes reported in a single-cell sequencing analysis of C. gigas adult gonadal tissue [44]. It is possible that there may be few shared genes involved in both embryonic PGC specification and adult germinal stem cell populations in C. gigas, although differences in methodologies and detection between studies (i.e. sequencing depth) may be a confounding factor [90]. Nevertheless, our identification of genes associated with PGCs in C. gigas may help with future characterization of GSCs and processes related to gametogenesis in oysters.
In addition to providing information about potential genes involved in PGC specification in bivalves, the experimental design employed here allows for some insight into mechanisms of specification. There is a general lack of consensus in the literature on whether molluscan PGCs are specified via preformation or epigenesis [91, 92]. At the molecular level, previous work in C. gigas showed vasa expression to be asymmetrically localized in cleavage-stage embryos, suggesting that the oyster germline is specified via preformation [25]. Our results are generally consistent with that supposition, as vasa expression is widespread in cleavage and blastula-stage embryos; however, cells with the highest abundance of vasa transcripts are concentrated within a smaller region of cluster 2 (Fig. 2). These vasa transcripts potentially represent maternal transcripts undergoing sequestration to the presumptive germline. More recently, however, a study evaluating embryonic expression of nanos in Pacific oysters led to speculation that the process of formation of PGCs in C. gigas may involve elements of both epigenesis and preformation, perhaps in an evolutionarily transitional state [59].
In our study, nanos expression was highly specific to the PGC cluster in gastrulae but not highly expressed in any cluster of the cleavage-blastula stages. Other evidence, such as the expression of PGC cluster-specific genes, suggests PGC formation in oysters is occurring via induction of signaling and transcriptomic activity from the embryo. Interestingly, even in well-characterized model systems such as Drosophila, the traditional paradigm of exclusivity with regards to whether preformation or epigenesis yields formation of PGCs is being questioned as new data emerge suggesting both maternal and inductive signals are important [30]. While the results here represent a transcriptional snapshot in developmental time, and we cannot definitively resolve the mechanism of PGC formation in C. gigas, they imply the importance of both maternal and zygotically-derived cell differentiation factors.
Early signatures of larval tissue formation in C. gigas
Gastrulation is a fundamental morphogenic process during early development that results in a reorganization of a hollow epithelial ball of cells into a multilayered embryo, and establishes the generation of tissues and cell types preceding organogenesis. Gastrulae sequencing detected expression of conserved genes involved in germ layer specification, a morphogenetic and intensive cell signaling event that occurs during gastrulation to define germ layers - endoderm, ectoderm, mesoderm - and leads to the establishment of the gut [93, 94]. In spiralian lophotrochozoan species like oysters, mesoderm develops from both ectodermal and endodermal-associated bipotential precursor cells, with ectomesodermal cells located near the blastopore [65]. We found gene expression signatures in gastrulae coinciding with the establishment of germ layers and tissue types. For example, brachyury (bra) is a conserved T-box transcription factor with mesodermal expression across bilaterian taxa, including in the gastropod Crepidula [65] and the mussel Dreissena [95], as well as in the developing shell field of gastropod larvae [96, 97]. We detected bra most highly in “undefined” clusters and portions of shell field and muscle clusters, indicating that these represent developing endomesoderm or mesodermal derivatives. Similarly, caudal (cad/cdx), a homeobox-containing transcription factor important for gastrulation, anterior/posterior axis specification, and shown previously to be expressed in ectodermal and ectomesodermal cells in mollusc embryos [65–67], was expressed primarily in undefined and portions of one of the muscle clusters. Some typical mesodermal genes like hes and mox [98] were not detected in any of our datasets, possibly due to the early developmental stages targeted. In bivalve molluscs, specific cell types are defined by an early larval stage - the trochophore - but the gene expression signatures preceding the establishment of this larval body plan during gastrulation, including those associated with neural, muscle, shell-secretion, and primordial germ cells are not well established. In invertebrate gastrulae, single-cell sequencing has been an effective technique to identify cell-type differentiation trajectories, discover novel genes associated with developing tissues, and better understand gene regulatory networks [35, 36, 42, 43]. We identified putative cell clusters associated with multiple developing larval tissues or cell types, including ciliated cells, muscles, sensory or neural cells, and shell gland.
Gastrulae sequencing data revealed several distinct cell clusters that express genes known to be involved in mollusc shell formation [99]. Mollusc shells are composed primarily of calcium carbonate (CaCO3), with smaller proportions of organic compounds like chitin and glycoproteins (reviewed in [100]). Larval molluscs have a structure called the shell field or shell gland that secretes shell material [101, 102]. The shell field first appears as a visually identifiable structure during the gastrula stage as a thickened cap of ectoderm on the embryo’s dorsal side [103]. Genes involved in synthesis of mollusc shell matrix have been identified in C. gigas [104] and shown to be expressed in late trochophore larvae [38].
Even at this early developmental stage, we identified four clusters associated with the developing shell field as well as a fifth cluster that highly expresses mantle protein (Fig. 4). Our findings are consistent with the results of Liu et al. [105], who identified multiple defined cell populations from the shell gland of C. gigas gastrulae using in-situ hybridization for individual known mollusc mantle genes. Embryonic insights into the sequestration of distinct regions of developing mantle tissues can inform evolutionary mechanisms driving the observed array of mollusc shell morphologies [99, 106, 107]. Additionally, these data can inform how larval shell formation may be perturbed by environmental stressors, such as ocean acidification. Ocean acidification can impact many physiological systems in marine invertebrates, but larval shell formation has been shown to be particularly sensitive [108]. Transcriptomic studies of whole bivalve larvae have hinted at mechanisms underlying developmental delays observed upon ocean acidification exposure [109, 110]. The data provided here, at single-cell resolution, could provide additional information to identify potential transcriptomic targets to gain further insights into this process.
The oyster larval nervous system – an apical sensory organ and some identifiable nerves - begins to appear during the trochophore stage, though trochophore larvae possess fewer defined neural structures compared to the later veliger larval stage [38, 111, 112]. Here we identified multiple clusters in C. gigas gastrulae that are expressing genes known to be present in early peripheral sensory cells and other neural progenitors, including 5-hydroxytryptamine receptor and otp, which are expressed in cells associated with the apical organ in oyster trochophores [80, 81]. The homeodomain-containing transcription factor six3/6, which we found in this study is expressed in some gastrulae neural-associated clusters, is involved in the development of sensory structures in diverse metazoans, and has been shown to be expressed in the neural structures of mollusc embryos and larvae [65, 113]. Planktonic larvae, particularly in species with feeding (planktotrophic) larvae such as Pacific oyster, must be able to sense their environment, control swimming direction through phototaxis and gravity sensing, and locate prey. It is perhaps not unexpected that even at the gastrula stage, gene expression for developing sensory cells and neurons was detected in our data.
Oyster gastrulae may inform evolutionary questions about developmental processes during embryogenesis
Collectively, our data represent transcriptomes from the earliest developmental time-points sequenced at the single-cell level in a lophotrochozoan species. This single-cell resolution during major early developmental milestones can potentially reveal the transcriptional signatures within trajectories of cell state transitions that lead to the lineage commitment of germ layers and discrete tissue types in an evolutionarily fascinating model bivalve mollusc. Additionally, gene expression insights from oyster gastrula may be useful for studies exploring the comparative evolution of developmental processes and tissue patterning both within lophotrochozoans and between ecdysozoan taxa and deuterostomes. By identifying genes uniquely expressed within each grouping of putative differentiating cell or tissue types including both evolutionarily conserved marker genes and uncharacterized mollusc-specific genes, these data can be a resource for pairing newly discovered genes with those known to be involved in cell-type or tissue information. Indeed, similar efforts have yielded insights into the genes driving embryonic and larval body plan patterning in other invertebrates, including detection of previously elusive progenitor cells [38, 63, 114].
Conclusions
These sequencing data and cell-type atlases provide a rich dataset exploring transcriptional activities and cell-type differentiation during early oyster development. The gastrula single-cell atlas presented here should also inform future studies exploring cell-type identity and developmental trajectories in larval bivalves. Notably, we have identified a suite of candidate genes that can be explored for their role in oyster PGC specification and to advance efforts to develop methods to achieve reproductive sterility via germ cell elimination in cultured Pacific oysters and potentially other shellfish species. Taken together, this dataset shows the utility of scRNA-seq to describe cell type differentiation and PGC specification during mollusc development, a group that has been understudied from this perspective.
Supplementary Information
Supplementary Tables
Supplementary Figures
The reference list from the paper itself. Each links out to its DOI / PubMed record.
- 1Gustafson EA, Wessel GM. Vasa genes: emerging roles in the germ line and in multipotent cells. Bioessays. 2010;32(7):626-37.10.1002/bies.201000001 PMC 309067320586054 · doi ↗ · pubmed ↗
- 2Colonnetta MM, Schedl P, Deshpande G. Germline/soma distinction in Drosophila embryos requires regulators of zygotic genome activation. Elife. 2023;12:e 78188.10.7554/e Life.78188 PMC 981240736598809 · doi ↗ · pubmed ↗
- 3de La Forest Divonne S, Pouzadoux J, Romatif O, Montagnani C, Mitta G, Destoumieux-Garzon D, Gourbal B, Charrière GM, Vignal E. Diversity and functional specialization of oyster immune cells uncovered by integrative single cell level investigations. Bio Rxiv. 2024;23:2024–07.10.7554/e Life.102622 PMC 1206417740343849 · doi ↗ · pubmed ↗
- 4Mc Innes L, Healy J, Melville J. UMAP: Uniform Manifold Approximation and Projection for dimension reduction. 2018. Preprint at https://arxiv.org/abs/1802.03426
- 5Ahuja N, Hwaun E, Pungor JR, Rafiq R, Nemes S, Sakmar T, Vogt MA, Grasse B, Quiroz JD, Montague TG, Null RW. Creation of an albino squid line by CRISPR-Cas 9 and its application for in vivo functional imaging of neural activity. Current Biology. 2023;33(13):2774-83.10.1016/j.cub.2023.05.066PMC 1262884237343558 · doi ↗ · pubmed ↗
- 6Lartillot N, Le Gouar M, Adoutte A. Expression patterns of fork head and goosecoid homologues in the mollusc Patella vulgata supports the ancestry of the anterior mesendoderm across Bilateria. Development genes and evolution. 2002;212(11):551-61.10.1007/s 00427-002-0274-812459924 · doi ↗ · pubmed ↗