Overview of historical formaldehyde occupational exposure in China
Jia Nie, Calvin B Ge, Nathaniel Rothman, Wei Hu, Qing Lan, Roel Vermeulen, Susan Peters

TL;DR
This paper summarizes formaldehyde exposure trends among Chinese workers from 1979 to 2023, showing a decline over time but remaining risks in certain industries.
Contribution
The study provides a comprehensive historical overview of formaldehyde exposure in Chinese occupational settings using a large dataset.
Findings
Formaldehyde exposure levels in China have decreased over time, with a notable decline after 2011.
The highest exposure was found in the 'Manufacture of veneer sheets and wood-based panels' industry and among 'Metal moulders and coremakers'.
Abstract
Formaldehyde is a known human carcinogen related to leukemia and nasopharyngeal cancer. As China is the world’s largest producer and consumer of formaldehyde, occupational exposure to formaldehyde may pose potential health risks to workers. We aimed to describe occupational exposure to formaldehyde over time in China. Occupational formaldehyde exposure measurements were extracted from Chinese and English scientific publications as well as routine occupational hazard monitoring datasets. A weighted mean concentration was calculated by occupation and industry. We extracted over 20,447 individual measurements from 73 industries and 70 occupations during 1979 to 2023 across China. The majority of measurements (19%) were from the industry “Manufacture of veneer sheets and wood-based panels,” with a pooled mean task-based concentration of 0.69 (0.02 to 4.98) mg/m3. Among occupations with…
Genes, proteins, chemicals, diseases, species, mutations and cell lines named across the full text — each resolved to its canonical identifier and authoritative record.
Click any figure to enlarge with its caption.
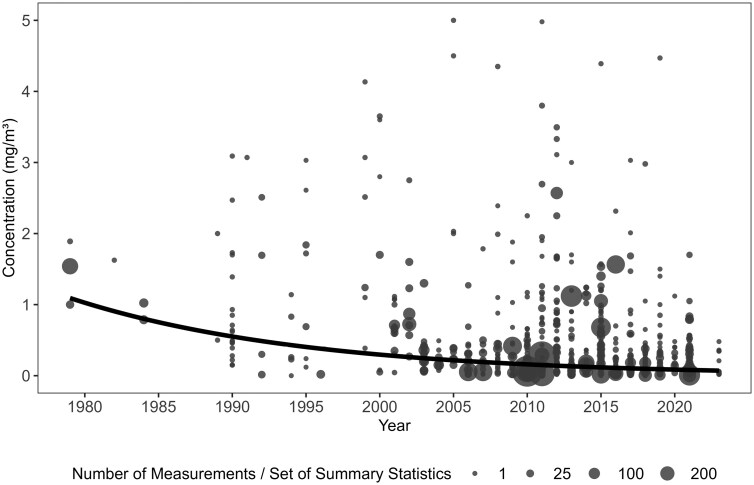 Figure 1
| Job Title (ISCO88) | Task-based | No. measurements | Full-shift | No. measurements |
|---|---|---|---|---|
| Life science and health professionals (2200) | 0.26 (0.14–1.79) | 49 | ||
| Pharmacologists, pathologists, and related professionals (2212) | 0.92 (0.02–12.0) | 512 | 0.51 (0.51–0.51) | 2 |
| Librarians and related information professionals (2432) | 0.07 (0.00–0.08) | 230 | ||
| Office clerks (4100) | 0.06 (0.02–0.27) | 1098 | 0.08 (0.07–0.40) | 42 |
| Stock clerks (4131) | 0.63 (0.05–1.62) | 100 | ||
| Personal and protective services workers (5100) | 0.08 (0.07–0.13) | 50 | ||
| Travel attendants and travel stewards (5111) | 0.01 (0.00–0.07) | 833 | ||
| Waiters, waitresses, and bartenders (5123) | 0.06 (0.01–0.09) | 87 | ||
| Hairdressers, barbers, beauticians, and related workers (5141) | 0.05 (0.02–0.10) | 1383 | ||
| Stall and market salespersons (5230) | 0.12 (0.01–1.11) | 1659 | ||
| Stone splitters, cutters, and carvers (7113) | 0.74 (0.72–1.10) | 25 | ||
| Building finishers and related trade workers not elsewhere classified (7130) | 0.30 (0.29–1.27) | 1094 | ||
| Plumbers and pipe fitters (7136) | 0.03 (0.03–0.03) | 896 | ||
| Painters and related workers (7141) | 1.12 (1.12–1.12) | 602 | ||
| Varnishers and related painters (7142) | 0.32 (0.00–1.70) | 40 | 0.33 (0.07–4.70) | 174 |
| Metal moulders and coremakers (7211) | 1.40 (0.04–1.99) | 368 | 0.30 (0.07–0.56) | 23 |
| Upholsterers and related workers (7437) | 0.17 (0.02–0.32) | 36 | ||
| Well drillers and borers and related workers (8113) | 3.75 (0.00–5.80) | 47 | ||
| Glass and ceramics kiln and related machine operators (8131) | 1.37 (0.04–2.31) | 32 | ||
| Wood-processing-plant operators (8141) | 0.68 (0.02–4.98) | 3569 | 0.62 (0.09–1.48) | 20 |
| Chemical-processing-plant operators (8150) | 0.50 (0.01–5.00) | 434 | 1.55 (0.98–1.57) | 405 |
| Crushing-, grinding- and chemical-mixing-machinery (8151) | 0.19 (0.03–0.52) | 43 | 0.38 (0.07–1.87) | 19 |
| Still and reactor operators (except petroleum and natural gas) (8154) | 2.09 (0.00–9.10) | 36 | 7.84 (0.15–8.80) | 10 |
| Incinerator, water treatment, and related plant operators (8163) | 0.95 (0.00–1.56) | 852 | ||
| Pharmaceutical-and toiletry-products machine operators (8221) | 0.21 (0.01–2.70) | 233 | ||
| Metal finishing-, plating-, and coating-machine operators (8223) | 0.02 (0.02–0.02) | 72 | ||
| Rubber-products machine operators (8231) | 0.46 (0.02–2.00) | 120 | ||
| Plastic-products machine operators (8232) | 0.72 (0.02–9.90) | 257 | 0.94 (0.13–8.70) | 42 |
| Wood-products machine operators (8240) | 0.33 (0.05–3.80) | 560 | 0.07 (0.07–0.07) | 3 |
| Printing-machine operators (8251) | 0.15 (0.03-0.56) | 69 | ||
| Fibre-preparing, spinning- and winding-machine operators (8261) | 0.95 (0.22–5.59) | 69 | ||
| Bleaching-, dyeing- and cleaning-machine operators (8264) | 0.09 (0.03–0.10) | 124 | ||
| Food and related products machine operators (8270) | 0.09 (0.06–0.12) | 144 | ||
| Brewers, wine, and other beverage machine operators (8278) | 0.06 (0.06–0.06) | 30 | ||
| Mechanical-machinery assemblers (8281) | 2.68 (0.17–-8.30) | 13 | 0.24 (0.03–0.56) | 386 |
| Electronic-equipment assemblers (8283) | 0.26 (0.00–1.30) | 289 | ||
| Metal-, rubber- and plastic-products assemblers (8284) | 0.18 (0.18–0.18) | 96 | ||
| Wood and related products assemblers (8285) | 0.74 (0.03–3.33) | 41 | 0.18 (0.12–0.32) | 5 |
| Other machine operators and assemblers (8290) | 0.70 (0.01–4.50) | 30 | 0.23 (0.07–1.20) | 8 |
| Helpers and cleaners in offices, hotels, and other establishments (9132) | 0.06 (0.03–0.09) | 1537 | ||
| Hand packers and other manufacturing labourers (9322) | 0.43 (0.07–0.75) | 49 |
| Job Title (3-digit ISCO-88) | Year period | Task-based | No. measurements | Full-shift | No. measurements |
|---|---|---|---|---|---|
| All | 1990 and earlier | 1.60 (0.15–6.14) | 500 | 4.48 (0.15–8.70) | 9 |
| 1991–2000 | 1.12 (0.00–12.8) | 267 | 0.24 (0.01–0.98) | 99 | |
| 2001–2010 | 0.24 (0.00–9.10) | 6688 | 0.79 (0.03–8.80) | 994 | |
| 2011 and after | 0.41 (0.00-12.0) | 11314 | 0.23 (0.03–0.67) | 576 | |
| Life Science Professionals (221) | Overall | 0.92 (0.02–-12.0) | 512 | 0.51 (0.51–0.51) | 2 |
| 2011 and after | 0.90 (0.02–12.0) | 497 | |||
| 2001–2010 | 1.66 (0.29–4.35) | 11 | |||
| 1991–2000 | 1.50 (0.12–3.03) | 4 | 0.51 (0.51–0.51) | 2 | |
| Archivists, Librarians and Related Information Professionals (243) | Overall | 0.07 (0.00–0.08) | 230 | ||
| 2011 and after | 0.07 (0.00–0.08) | 216 | |||
| 1991–2000 | 0.05 (0.05–0.05) | 14 | |||
| Material-recording and Transport Clerks (413) | Overall | 0.63 (0.05–1.62) | 100 | ||
| 2011 and after | 0.60 (0.05–1.23) | 98 | |||
| 1990 and earlier | 1.62 (1.62–1.62) | 2 | |||
| Travel attendants and related Workers (511) | Overall | 0.01 (0.00–0.07) | 833 | ||
| 2011 and after | 0.01 (0.00–0.02) | 802 | |||
| 2001–2010 | 0.06 (0.01–0.07) | 31 | |||
| Housekeeping and restaurant services workers (512) | Overall | 0.06 (0.01–0.09) | 87 | ||
| 2011 and after | 0.07 (0.01–0.09) | 60 | |||
| 2001–2010 | 0.06 (0.06–0.06) | 27 | |||
| Other personal services Workers (514) | Overall | 0.05 (0.02–0.10) | 1383 | ||
| 2011 and after | 0.04 (0.02–0.10) | 690 | |||
| 2001–2010 | 0.07 (0.07–0.07) | 693 | |||
| Stall and market Salespersons (523) | Overall | 0.12 (0.01–1.11) | 1659 | ||
| 2011 and after | 0.14 (0.07–0.22) | 1016 | |||
| 2001–2010 | 0.10 (0.01–1.11) | 643 | |||
| Miners, shotfirers, stone cutters and carvers (711) | Overall | 0.74 (0.72–1.10) | 25 | ||
| 2011 and after | 0.72 (0.72–0.72) | 24 | |||
| 2001–2010 | 1.10 (1.10–1.10) | 1 | |||
| Building finishers and related trades workers (713) | Overall | 0.18 (0.03–1.27) | 1990 | ||
| 2011 and after | 0.17 (0.03–0.29) | 1980 | |||
| 2001–2010 | 1.27 (1.27–1.27) | 10 | |||
| Painters, building structure cleaners and related trades workers (714) | Overall | 1.07 (0.00–1.70) | 642 | 0.33 (0.07–4.70) | 174 |
| 2011 and after | 1.08 (0.00–1.70) | 632 | 0.15 (0.07–0.50) | 89 | |
| 2001–2010 | 0.69 (0.69–0.69) | 10 | 0.52 (0.07–4.70) | 85 | |
| Metal moulders,welders, sheet-metalworkers, structural-metal preparers and related trades workers (721) | Overall | 1.40 (0.04–1.99) | 368 | 0.30 (0.07–0.56) | 23 |
| 2011 and after | 0.48 (0.04–0.59) | 36 | 0.30 (0.07–0.56) | 23 | |
| 2001–2010 | 1.99 (1.99–1.99) | 3 | |||
| 1990 and earlier | 1.49 (1.00–1.89) | 329 | |||
| Mining- and mineral-processing-plant operators (811) | Overall | 3.75 (0.00–5.80) | 47 | ||
| 2011 and after | 0.06 (0.00–0.08) | 15 | |||
| 2001–2010 | 3.25 (0.70–5.80) | 4 | |||
| 1990 and earlier | 5.80 (5.80–5.80) | 28 | |||
| Wood-processing- and papermaking-plant operators (814) | Overall | 0.68 (0.02–4.98) | 3569 | 0.62 (0.09–1.48) | 20 |
| 2011 and after | 0.83 (0.02–4.98) | 1743 | |||
| 2001–2010 | 0.47 (0.05–2.75) | 1751 | 0.62 (0.09–1.48) | 20 | |
| 1991–2000 | 1.85 (1.24–3.65) | 75 | |||
| Chemical-processing-plant operators (815) | Overall | 0.59 (0.00–9.10) | 516 | 1.67 (0.07–8.80) | 442 |
| 2011 and after | 0.17 (0.01–0.90) | 309 | 0.20 (0.07–0.64) | 17 | |
| 2001–2010 | 1.25 (0.00–9.10) | 81 | 1.75 (1.57–8.80) | 405 | |
| 1991–2000 | 2.02 (1.69–2.51) | 30 | 0.98 (0.98–0.98) | 18 | |
| 1990 and earlier | 0.91 (0.79–1.02) | 96 | 3.98 (0.15–7.80) | 2 | |
| Power-production and related plant operators (816) | Overall | 0.95 (0.00–1.56) | 852 | ||
| 2011 and after | 1.49 (0.00–1.56) | 420 | |||
| 2001–2010 | 0.41 (0.41–0.41) | 432 | |||
| Chemical-products machine operators (822) | Overall | 0.17 (0.01–2.70) | 305 | ||
| 2011 and after | 0.17 (0.01–2.70) | 304 | |||
| 2001–2010 | 0.25 (0.25–0.25) | 1 | |||
| Rubber- and plastic-products machine operators (823) | Overall | 0.63 (0.02–9.90) | 377 | 0.94 (0.13–8.70) | 42 |
| 2011 and after | 0.66 (0.02–9.90) | 291 | 0.23 (0.13–0.37) | 36 | |
| 2001–2010 | 0.02 (0.02–0.03) | 19 | |||
| 1991–2000 | 0.70 (0.23–1.72) | 49 | |||
| 1990 and earlier | 0.68 (0.15–2.00) | 18 | 5.19 (1.05–8.70) | 6 | |
| Wood-products machine operators (824) | Overall | 0.33 (0.05–3.80) | 560 | 0.07 (0.07–0.07) | 3 |
| 2011 and after | 0.33 (0.05–3.80) | 496 | 0.07 (0.07–0.07) | 3 | |
| 2001–2010 | 0.34 (0.08–0.38) | 64 | |||
| Textile-, fur- and leather-products machine operators (826) | Overall | 0.42 (0.03–6.14) | 196 | ||
| 2011 and after | 0.21 (0.03–3.03) | 167 | |||
| 1991–2000 | 1.84 (0.08–3.60) | 2 | |||
| 1990 and earlier | 1.65 (0.22–6.14) | 27 | |||
| Assemblers (828) | Overall | 0.36 (0.00–8.30) | 439 | 0.24 (0.03–0.56) | 391 |
| 2011 and after | 0.27 (0.00–8.30) | 368 | 0.24 (0.03–0.56) | 375 | |
| 2001–2010 | 0.84 (0.22–1.30) | 71 | 0.24 (0.07–0.45) | 16 | |
| Other machine operators and assemblers (829) | Overall | 0.70 (0.01–4.50) | 30 | 0.23 (0.07–1.20) | 8 |
| 2011 and after | 0.28 (0.01–0.77) | 25 | 0.09 (0.07–0.19) | 7 | |
| 2001–2010 | 2.78 (0.88–4.50) | 5 | |||
| 1990 and earlier | 0 | 1.20 (1.20–1.20) | 1 | ||
| Motor-vehicle drivers (832) | Overall | 0.09 (0.02–0.52) | 33 | ||
| 2011 and after | 0.10 (0.03–0.52) | 31 | |||
| 2001–2010 | 0.03 (0.02–0.03) | 2 | |||
| Domestic and related helpers, cleaners, and launderers (913) | Overall | 0.06 (0.03–2.80) | 1539 | ||
| 2011 and after | 0.07 (0.03–0.91) | 125 | |||
| 2001–2010 | 0.06 (0.06–0.06) | 1413 | |||
| 1991–2000 | 2.80 (2.80–2.80) | 1 |
| Data source | Task-based | No. measurements | Full-shift | No. measurements |
|---|---|---|---|---|
|
| ||||
| Case–control studies | 0.31 (0.01–6.20) | 3369 | 0.71 (0.01–1.57) | 903 |
| Industrial hygiene surveys | 0.57 (0.00–12.0) | 5380 | 0.58 (0.03–8.80) | 393 |
| Occupational hazard assessments | 0.87 (0.00–12.8) | 3034 | 0.34 (0.12–0.60) | 20 |
| Environmental air quality inspections at the workplace | 0.07 (0.00–4.35) | 6943 | 0.26 (0.07–1.48) | 62 |
| Other studies | 0.35 (0.06–2.00) | 27 | ||
|
| ||||
| Routine occupational hazard monitoring datasets | 0.54 (0.00–6.14) | 16 | 0.29 (0.07–4.70) | 300 |
- —Intramural Research Program of the Division of Cancer Epidemiology and Genetics
- —NCI10.13039/100000054
- —NIH10.13039/100000002
- —Dutch Ministry of Education, Culture, and Science and the Netherlands Organization for Scientific Research
Peer Reviews
No public reviews on file for this paper yet. If you reviewed it on a platform where reviews are public (OpenReview, ICLR, NeurIPS, ICML), you can paste yours below so the community can read it here.
Videos
No videos yet. Explain this paper in a talk, walkthrough, or lecture? Add one.
Taxonomy
TopicsIndoor Air Quality and Microbial Exposure · Air Quality and Health Impacts · Occupational exposure and asthma
Introduction
Formaldehyde (CH_2_O) is a widely used chemical across industries since it was commercially produced in 1889. The International Agency for Research on Cancer (IARC) has classified formaldehyde as a human carcinogen (group 1) (IARC 2006). Acute exposure to formaldehyde can irritate the skin, throat, lungs, and eyes (NIOSH 2014) and numerous studies confirmed the causal relationship between formaldehyde exposure and the risk of leukemia and nasopharyngeal cancer (IARC 2006).
Formaldehyde is used to manufacture wood products, textiles, plastics, chemicals, disinfectants, and preservatives (Cogliano et al. 2004). Three main industries where workers may be exposed to formaldehyde have been identified by IARC: (i) the production of formaldehyde and/or its solutions; (ii) the production or use of products containing formaldehyde; and (iii) combustion processes generating formaldehyde (IARC 2012). With the rapid growth of formaldehyde supply and demand industries, China has led in formaldehyde production and consumption worldwide since the 21st century (Cui 2003). The widespread production and utilization pose significant occupational health challenges (Tang et al. 2009). Thus, understanding formaldehyde exposure patterns in Chinese occupational settings may provide valuable insights for investigating adverse health effects and developing targeted interventions and regulations.
A previous review in 2009 extensively summarized formaldehyde production, consumption, exposure, and health effects in China (Tang et al. 2009). Analyzing 1,265 occupational exposure measurements from five industries and anatomical and pathological laboratories between 1985 and 2006, the review identified generally elevated exposure levels, with the highest concentrations in the wood industry and medical laboratories. Meanwhile, a decreasing trend in exposure levels was observed following the implementation of new occupational exposure limit (OEL) standards. Initially, the Chinese Ministry of Health established an OEL of 3 mg/m³ in 1979 under the Chinese National Standard for industrial premises (TJ 36-79). This limit was reduced to 0.5 mg/m³ in 2002 with the implementation of the (GBZ1-2002) Hygienic Standards for the Design of Industrial Premises, which remains in effect today. However, the previous review, covering a few industries, lacked details on job titles and sampling types (i.e., whether these were area or personal measurements or task-based or full-shift concentrations).
Several types of literature may report formaldehyde occupational exposure levels (National Health Commission of the People’s Republic of China, 2024): (i) Industrial Hygiene Surveys involving systematic measurements conducted in various workplaces (e.g., several factories) to assess potential environmental risks associated with occupational exposures; (ii) Occupational Hazard Assessment comprehensively evaluating all types of risks (including environmental factors, physical, biological, psychological, etc.) at the workplace with a focus on workers’ risk assessment (usually involving the calculation of exposure rating, determination of risk levels, and risk management); (iii) Occupational poisoning case-reports usually conducted when an acute occupational poisoning case has occurred; (iv) Broader environmental air quality studies that include workplace measurements. (v) Epidemiological studies such as case–control studies that conducted measurements at different workplaces to explore the association between occupational exposure and the risk of disease or certain symptoms.
This paper offers an overview of current and historical occupational formaldehyde exposure across all relevant industries in China. Available data from various English and Chinese sources are aggregated, gathering evidence from published resources and individual measurement datasets from routine occupational hazard monitoring.
Methods
Comprehensive searches of electronic databases were conducted in both the English and Chinese languages. For English, PubMed, Embase, and Web of Science were searched. For Chinese, searches were conducted in the China National Knowledge Infrastructure database, the China Science and Technology Journal Database (VIP), and the WanFang database. Search methods were adjusted according to the different Chinese and English databases. The search included all the indexed papers and computerized literature databases, supplemented by manual screening reference lists from each relevant article.
Furthermore, representative measurements were extracted from a database containing task-based and full-shift personal and area measurements collected between 1985 and 2018 as part of the routine occupational hazard monitoring in Tianjin and Hong Kong. The PRISMA flowchart of data extraction is shown in Supplementary Figure 1.
Search strategy
Search Terms used for the literature review were: All fields= ((Formaldehyde OR formalin OR methanal OR formal OR methylene oxide) AND (China OR Chinese OR Hongkong)) AND (((Occupational AND exposure) OR (industrial AND exposure) OR (work AND exposure) OR (workplace air concentration)) OR ((Occupational hazard) OR (occupational risk) OR (occupational health) OR (industrial hygiene))). The search was done on 3 April 2024. The search strings in Chinese used in different Chinese databases are listed in Supplementary Material 1.
Eligibility criteria
Any publication reporting formaldehyde measurements conducted at workplaces in China was considered. We restricted our inclusion to publications in English or Chinese. We had no restriction on the time period. The most complete report was included when multiple publications were based on the same dataset. Publications or measurements related to acute poisonings, extremely high formaldehyde concentrations that would be immediately dangerous for health, or duplicate publications in different journals were excluded.
Data extraction and synthesis
The relevant information was extracted from publications or measurement datasets. For each identified set of summary statistics (any form of concentration level including single values, means with or without standard deviations, quantiles, ranges, etc.), we extracted related information including industry, job title and/or job task, sample year, location, area or personal sampling, number of measurements and other available information listed in Table S1. All the extracted information was translated, coded, and tabulated. Short-term exposure level (STEL) and time-weighted average (TWA) concentration were defined as task-based and full-shift concentration, respectively; when none specified, we defined the type of concentration based on other information such as sampling duration. The job titles and industries were coded according to the International Standard Industrial Classification of All Economic Activities (ISIC4) (United Nations 2008) and the International Standard Classification of Occupations (ISCO88) (International Labour Organization 2024).
Analysis
For each extracted set of summary statistics, the arithmetic mean (AM) was calculated for summarization, as it was the predominant form of reported concentration. If a single formaldehyde concentration value was reported, it was considered as an individual measurement. If the authors only provided a range of values, the AM of the minimum and maximum reported values was used as the average. If only a maximum value was provided, the AM was calculated as the average of the maximum and zero. If only the minimum value was given, the observation was considered missing. When only the median and/or geometric mean (GM) were provided, it was used as the AM as only few publications reported these statistics. When “undetected” was reported, the value was set as 0.
Weighted linear regression was conducted to evaluate the temporal trends in exposure levels. The log-transformed task-based AM concentrations (normally distributed) derived from sets of summary statistics were used as the dependent variable, and years of measurement served as the independent variable. We weighted the analysis by the number of measurements for each set of summary statistics. This analysis could not be extended to full-shift concentrations due to the limited availability of summary statistics.
We pooled the AM concentrations of each job title weighted by the number of measurements reported for the summary statistics. This was calculated by multiplying the number of sites measured by the number of samples taken per site. In circumstances where only one of these metrics was provided (either the number of sites measured or the number of samples taken per site), it was assumed that at least that many measurements were taken. In circumstances where none of the abovementioned sampling information was given, we assigned “at least 1” for a single concentration value and “at least 2” for a range of concentration or a mean value with standard deviation (SD).
Results
After excluding publications without assessments specific to an industry or occupation, 246 publications (Supplementary Material 2) were included in the analysis. These publications comprised 826 sets of summary statistics and over 20,131 individual measurements, covering the period from 1979 to 2023. Most of the 826 sets of summary statistics reported AMs with SDs or ranges (33%), single values (27%, could be either the concentration of one measurement, or an AM without SDs or ranges), or ranges only (33%), while only 6% reported Medians and/or GMs. Among all sets of summary statistics, 11% had only one measurement. Further, 316 representative measurements were extracted from Tianjin’s occupational hazard monitoring (n = 313) and Hong Kong (n = 3). In total, we pooled 20,447 individual assessments from 73 industries and 70 occupations; most reports provided task-based formaldehyde air concentrations (Table 1, Tables S2 and Supplementary S3).
Two-thirds of the occupations’ pooled weighted mean formaldehyde exposure concentrations were below the current Chinese national standard of 0.5 mg/m^3^. Occupations with over 200 individual assessments and a pooled weighted mean task-based or full-shift concentration of 0.5 mg/m^3^ or higher included: “Wood-processing-plant operators,” “Incinerator, water-treatment and related plant operators,” “Chemical-processing-plant operators,” “Painters and related workers,” “Pharmacologists, pathologists and related professionals,” “Mechanical-machinery assemblers,” “Metal moulders and coremakers,” and “Plastic-products machine operators.” The occupation with the most exposure measurements was “Wood processing plant operators” (18% of all measurements), with a pooled weighted mean full-shift concentration of 0.68 mg/m³ (range: 0.02 to 4.98 mg/m³) and a task-based concentration of 0.62 mg/m³ (range: 0.09 to 1.48 mg/m³). Among industries, “Manufacture of veneer sheets and wood-based panels,” “Building completion and finishing,” “Sewerage,” “Other human health activities,” “Manufacture of basic iron and steel,” “Manufacture of basic chemicals,” “Manufacture of plastics and synthetic rubber in primary forms,” had more than 200 individual assessments and a pooled weighted mean task-based or full-shift concentration over 0.5 mg/m^3^.
Time trends of formaldehyde workplace air concentrations
** Figure 1 ** shows the overall trend of occupational formaldehyde exposure in China from 1979 to 2023. Each point represents a task-based AM (mg/m^3^) derived from a set of summary statistics, with larger points indicating estimates based on a greater number of measurements. The black line represents the fitted weighted linear regression, using log-transformed task-based AMs as the dependent variable and year of measurement as the independent variable. The analysis confirms a significant decreasing trend in exposure levels over time (β = −0.06, P < 0.001).
Occupational formaldehyde exposure trends in China, 1979–2023.Notes: Each point represents a task-based arithmetic mean (mg/m3) derived from a set of summary statistics, with larger points indicating estimates based on a greater number of measurements. The black line represents the fitted values using weighted linear regression, using log-transformed task-based AMs as the dependent variable and year of measurement as the independent variable. Concentrations exceeding 5.0 mg/m3 are omitted from the plot for clarity but are retained in the regression model.
The pattern of formaldehyde exposure per occupation was examined across four time periods: (i) 1990 and earlier; (ii) 1991 to 2000; (iii) 2001 to 2010; and (iv) 2011 and later. Descriptive statistics for these periods are provided in Table 2 for all occupations collectively and for 3-digit ISCO-88 grouped occupations with over 25 measurements with at least measurements in two time periods. Most measurements were taken after 2000. For all occupations, earlier periods exhibited the highest occupational exposure levels. The pooled weighted mean (range) task-based formaldehyde concentrations in workplaces were 1.60 (0.15 to 6.14) mg/m³ until 1990 and 1.12 (0.00 to 12.8) mg/m³ for 1991 to 2000. The concentrations decreased to 0.24 (0.01 to 9.10) mg/m³ during 2001 to 2010, and then slightly increased to 0.41 (0.00 to 12.0) mg/m³ from 2011 onwards. A similar trend was observed for “Wood-processing and papermaking-plant operators,” though the earliest report for this occupation was from 1991 to 2000. For “Life Science Professionals,” which were mostly pathologists, exposure levels were relatively high during 1991 to 2000, with a pooled weighted mean (range) task-based concentration of 1.50 (0.12 to 3.03) mg/m³. This group experienced a marginal increase in exposure to 1.66 (0.29 to 4.35) mg/m³ during 2001 to 2010, with levels remaining high at 0.90 (0.02 to 12.00) mg/m³ from 2011 onwards. Other occupations with pooled weighted mean concentration over 0.5 mg/m^3^ in the latest decades were “Painters,” “Metal moulders, welders, sheet-metal workers,” “Power production plant operators,” and “Rubber and plastic products machine operators.”
General characteristics
Four main types of studies reported occupational formaldehyde exposure, including case-control studies (21%), industrial hygiene surveys (28%), occupational hazard assessment studies (15%), and environmental air quality inspections in workplaces (34%) (Table 3). Among these, occupational hazard assessments reported the highest pooled task-based concentrations, with a weighted mean (range) of 0.87 mg/m³ (0.00 to 12.8 mg/m³). In contrast, concentrations reported from air quality inspections were lower, with a weighted mean (range) of 0.07 mg/m³ (0.00 to 4.35 mg/m³).
The collected data covered more than 26 provinces, municipalities, and autonomous regions, representing 76% of the 34 administrative regions in China. A subgroup analysis of exposure levels across different regions is shown in Table S4. Coastal regions such as Jiangsu, Shandong, Guangdong, and Zhejiang provinces had the most individual exposure measurements. The pooled weighted mean (range) task-based concentrations in these regions were 0.14 (0.02 to 5.59), 0.26 (0.00 to 3.60), 0.76 (0.00 to 4.98), and 0.75 (0.02 to 5.47) mg/m^3^, respectively. Higher exposure levels were found in less developed areas such as the Gansu, Hunan, Sichuan, and Shanxi provinces. The pooled weighted mean (range) task-based concentrations were 3.35 (0.00 to 12.8), 1.44 (0.02 to 9.10), 1.87 (0.02 to 6.20), and 1.24 (0.01 to 8.30) mg/m^3^, respectively.
Most measurements were obtained through area sampling (Table S5). Among personal measurements, full-shift concentrations were the most commonly calculated, largely influenced by a case–control study (Zhang et al. 2010) that contributed 846 measurements.
Some source reports, especially those extracted from publications, lacked details on the number of measurements and workplace environmental factors that could influence formaldehyde concentrations and exposures, such as ventilation and other protective procedures. Information on the accuracy and precision of the sampling and analytical methods was often missing; instead, references were frequently made to Chinese Standards. Detailed information on the sampling and analytical methods used in China is provided in Supplementary Material 3.
Discussion
Based on 246 Chinese and English publications and measurements from routine occupational hazard monitoring, our analysis of over 20,447 individual assessments reveals a declining trend of occupational exposure to formaldehyde in China over the past decades. Occupations with a pooled weighted mean task-based air concentration of 0.5 mg/m^3^ or higher typically involved either frequent use or production of formaldehyde, particularly in industries manufacturing chemicals and wood products, and scenarios using formaldehyde as disinfectants and preservatives.
Compared to global assessments spanning 2004 to 2019, which categorized occupational formaldehyde exposure into four main scenarios: healthcare and research, esthetic and wellness, industry, and firefighters (Cammalleri et al. 2022), our review within China revealed a similar pattern but with broader sources of exposure. The primary source of exposure information originated from industries related to the production or use of formaldehyde. Moreover, a secondary set of exposure data was obtained from workplace environmental air quality inspections, particularly in sectors such as short-term accommodation (e.g. hotels) and hairdressing and beauty treatments. A small portion of the data came from the healthcare and research sectors, specifically the workplaces of pathologists and related professionals.
A previous review on formaldehyde exposure in China before 2006 reported that the exposure levels in anatomy and pathology laboratories were high, often exceeding the OEL of 0.5 mg/m^3^, primarily due to the evaporation of formalin used for tissue and specimen preservation (Tang et al. 2009). Our review indicated that the exposure levels among pathologists and related professionals remained high in subsequent time periods, underscoring the need for special attention to ensure a safer working environment.
Most measurements were derived from the coastal and their neighbouring regions, including the Jiangsu, Shandong, Guangdong, Zhejiang, Hubei, and Henan provinces. These regions produced and consumed a large portion of formaldehyde within China, as the long-distance transportation of such a highly reactive chemical is impractical (Tian and Wang 2018). Conversely, less developed inland regions with more rural areas, such as Gansu, Hunan, and Sichuan, exhibited higher levels of exposure in our review. The relatively high exposure levels in these regions were driven by the over-representation of high-exposure occupations. When further analysing the reported industries of developed and less developed areas, we observed that formaldehyde exposure measurements were primarily extracted in manufacturing settings in developed regions, while in inland areas like Sichuan and Gansu, measurements mostly originated from laboratories, including occupations like pathologists.
Although the overall exposure level in occupational settings has decreased over time, especially following the newly issued OEL in 2002, the pooled weighted mean task-based formaldehyde air concentration at workplaces slightly increased in the last decade. Despite the more stringent OEL of 0.5 mg/m^3^ for formaldehyde set by the National Health Commission of the People’s Republic of China, compliance has been inconsistent across different regions and industries (Liang et al. 2003). The expansion of small-scale industries and informal workshops alongside China’s industrialization has contributed to elevated exposure risks, particularly in rural areas where enforcement of the OEL may be less effective (Wong 2003). Moreover, it is important to note that international exposure standards vary: according to the US Occupational Safety and Health Administration (OSHA), the recommended permissible exposure limit (PEL) of formaldehyde is 0.92 mg/m^3^. The recommended exposure limit (REL) of the National Institute for Occupational Safety and Health (NIOSH) for formaldehyde is 0.20 mg/m^3^ (8-hour TWA) (NIOSH 2014). The Threshold Limit Values (TLV) set by the American Conference of Governmental Industrial Hygienists (ACGIH) are 0.12 mg/m^3^ (TWA) and 0.37 mg/m^3^ (STEL) (ACGIH 2016).
Task-based measurements are typically targeted toward the highest exposures and thus expected to be higher than full-shift concentrations. However, this expectation did not hold for all occupations in the current review. This situation was, for instance, seen for “Chemical-processing-plant operators” and “Plastic-products machine operators.”
For the current review, we included information on formaldehyde occupational exposure over an extended period in China, offering a broad view of related occupations and industries. Our overview further integrates data from scientific publications with available measurements from routine occupational hazard monitoring. This comprehensive overview of formaldehyde concentrations is crucial for assessing occupational exposures in population-based epidemiological studies. Chronic diseases, such as cancer or neurodegenerative diseases, have long latencies and require historical exposure assessment. Therefore, our detailed historical quantitative data on formaldehyde exposure will support the approximate formaldehyde exposure assessment for people who previously worked in relevant industries during those periods.
Industries involving the production of formaldehyde are present nearly all across China (Tang et al. 2009). Although over 20,447 individual assessments were extracted for this review, covering 76% of regions in China, important data from other areas may still be missing due to regional disparities in industry distribution.
Different sampling and analytical methods were employed over the decades covered. In this study, pooled exposure concentrations for each occupation and industry combined both area and personal exposure measurements, which may not fully capture workers’ actual exposure levels. Personal samplers are typically positioned closer to the worker, whereas area samplers might be placed near formaldehyde sources, leading to differences in measured concentrations. Ideally, the impact of different sampling and analytical methods would be quantified. However, this was not possible because most of the concentrations we abstracted from the Chinese literature did not specify how specifically they were sampled and analysed. Instead, most literature just referred to the applicable standards in effect in the sampling year. These methodological variations can be influenced by factors such as the specific sampler used, the placement of the sampler, the habitual movement of the worker, other environmental conditions, and analytical methods. The latter ranged from AHMT Spectrophotometry and Phenol Reagent Spectrophotometry to Gas Chromatography (GC) and Photoelectric Photometry (Supplementary Material 3). Another consideration is the inclusion of indoor air quality assessments in occupational settings such as hotels, hair salons, and offices. While this expanded the dataset, subtle differences in sampling methods may affect comparability. Moreover, the pooled weighted mean concentrations combined individual measurements and summary statistics such as means, medians, or ranges. One limitation of this approach is the estimation of AMs from incomplete or variable summary statistics, which may introduce bias. Additionally, although applying weights based on sample size helps to reduce the influence of studies with fewer measurements, this approach may also skew results by disproportionately reflecting large datasets from specific industries or job titles rather than capturing a broader range of occupational conditions from multiple smaller studies. Nonetheless, the overall temporal trend fitted using log-transformed task-based AMs further supported the declining trend we observed for most occupations. Advanced statistical methods, such as parameter transformation and modelling-based meta-regression, are available for pooling exposure data based on geometric means (Koh et al. 2014, 2015). However, we opted for a descriptive and transparent approach using arithmetic means due to the heterogeneity and limited detail often present in the existing data. Our straightforward method effectively addresses the current gap in occupational formaldehyde exposure assessment in China.
Conclusion
This review of formaldehyde air concentrations in workplaces, derived from both published studies and routine occupational hazard monitoring in China, reveals a declining trend in exposure levels over the past few decades. However, certain occupations are particularly at risk of formaldehyde overexposure. These occupations include “Wood-processing-plant operators,” “Incinerator and water-treatment plant operators,” “Chemical-processing-plant operators,” “Painters,” “Pharmacologists and pathologists,” “Metal moulders and coremakers,” “Mechanical-machinery assemblers,” and “Plastic-products machine operators.” Targeted interventions and regulations are needed to mitigate formaldehyde exposure in these high-risk occupations. Furthermore, the quantitative exposure data presented in this review can serve as a valuable resource for epidemiological exposure assessments.
Supplementary material
Supplementary material is available at Annals of Work Exposures and Health online.
wxaf037_suppl_Supplementary_Materials
The reference list from the paper itself. Each links out to its DOI / PubMed record.
- 1ACGIH. (2016) Documentation of the Threshold Limit Values (TL Vs) and Biological Exposure Indices (BE Is) - Formaldehyde. Available at https://www.acgih.org/formaldehyde-2/
- 2Cammalleri V , et al 2022. Occupational scenarios and exposure assessment to formaldehyde: a systematic review. Indoor Air 32:e 12949. https://doi.org/10.1111/ina.1294934708443 PMC 9298394 · doi ↗ · pubmed ↗
- 3Cogliano V , et al WHO International Agency for Research on Cancer. 2004. Advice on formaldehyde and glycol ethers. Lancet Oncol. 5:528. https://doi.org/10.1016/s 1470-2045(04)01562-115384217 · doi ↗ · pubmed ↗
- 4Cui X. 2003. Production, consumption and market analysis of formaldehyde at home and abroad [in Chinese]. Chemical Techno-Economics 21:19–24. CNKI:SUN:HGJJ.0.2003-06-005. ISBN 1006-253X
- 5IARC. (2006) Formaldehyde, 2-Butoxyethanol and 1-tert-Butoxypropan-2-ol. Lyon: IARC. ISBN 978-92-832-1288-1.PMC 478164117366697 · pubmed ↗
- 6IARC. 2012. Chemical agents and related occupations. IARC Monogr Eval Carcinog Risks Hum. 100:9–562. https://www.ncbi.nlm.nih.gov/books/NBK 304416/.23189753 PMC 4781612 · pubmed ↗
- 7International Labour Organization. (2024) International Standard classification of occupations (ISCO). Available at https://ilostat.ilo.org/methods/concepts-and-definitions/classification-occupation/
- 8Koh D-H , et al 2014. Evaluating temporal trends from occupational lead exposure data reported in the published literature using meta-regression. Ann Occup Hyg. 58:1111–1125. https://doi.org/10.1093/annhyg/meu 06125193938 PMC 4227532 · doi ↗ · pubmed ↗