Optimizing antifungal dosing for invasive Cryptococcus infections: minimum inhibitory concentration distributions and pharmacokinetic/pharmacodynamic insights from 2010–2023 Antimicrobial Testing Leadership and Surveillance data
Chia-Ying Liu, Chih-Cheng Lai, Chun-Chung Hsueh, Chih-Jen Weng, Wei-Lun Chang, Po-Ren Hsueh, Shio-Shin Jean

TL;DR
This study optimizes antifungal treatment for invasive Cryptococcus infections by analyzing global MIC data and pharmacokinetic/pharmacodynamic profiles to guide dosing.
Contribution
The study provides novel insights into antifungal dosing for Cryptococcus meningitis based on MIC distributions and PK-PD indices.
Findings
Fluconazole (800–1,200 mg/day) and voriconazole are optimal due to superior CNS penetration.
Isavuconazole is preferred over posaconazole for consolidation therapy in Cryptococcus meningitis.
Liposomal amphotericin B combined with fluconazole or voriconazole is an effective induction regimen.
Abstract
The 2024 global cryptococcosis treatment guidelines suggests that fluconazole (FLC) combined with liposomal amphotericin B (AMB) and 5-flucytosine (5-FC) as the mainstay of treatment for systemic cryptococcosis. Although this 2024 guidelines also list recommend voriconazole (VRC), posaconazole (POS), and isavuconazole (ISA) as alternatives to FLC during the consolidation and maintenance phases, current data on distributions of minimum inhibitory concentrations (MICs) of global Cryptococcus isolates for antifungals—and studies evaluating the application of their pharmacokinetic (PK) profiles and pharmacodynamic (PD) indices in the treatment of systemic cryptococcosis—remain limited. To optimize antifungal dosing, integration of global MIC distributions for Cryptococcus isolates with PK/PD parameters for key antifungal agents is needed. This study analyzed the MIC distributions from the…
Genes, proteins, chemicals, diseases, species, mutations and cell lines named across the full text — each resolved to its canonical identifier and authoritative record.
Click any figure to enlarge with its caption.
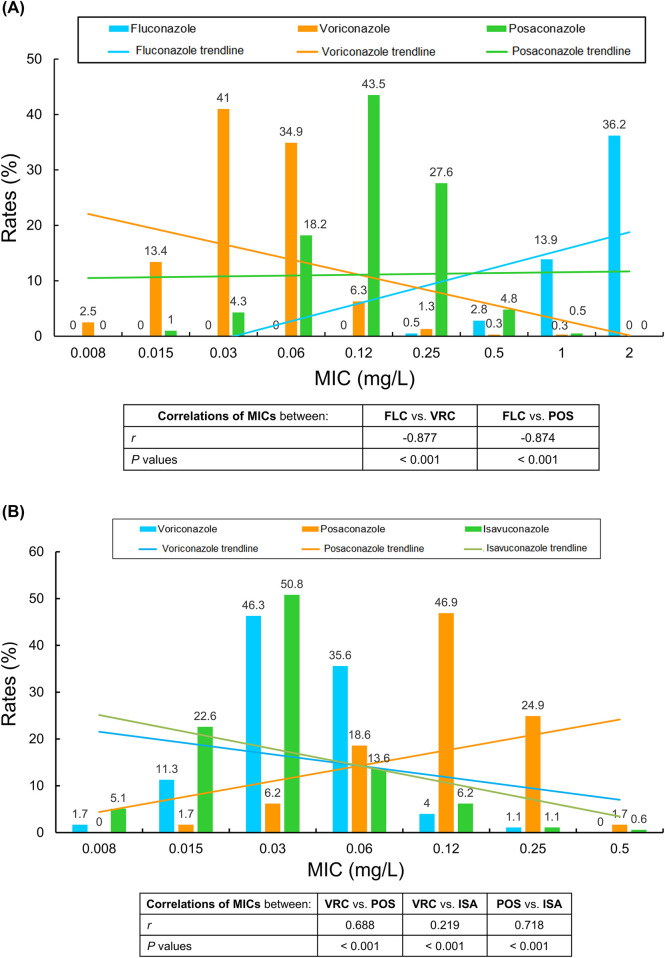 FIGURE 1
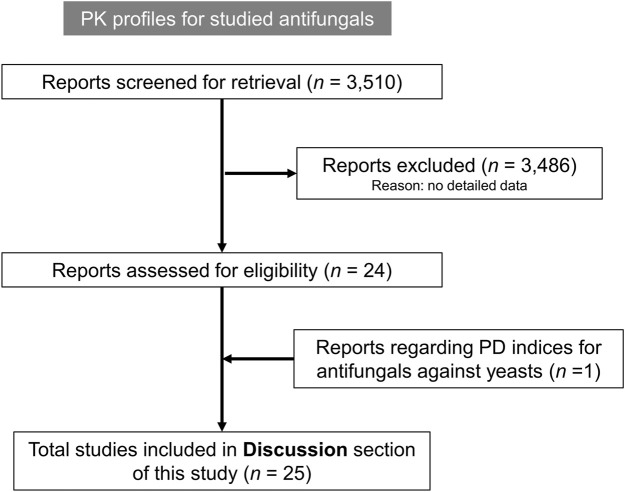 FIGURE 2
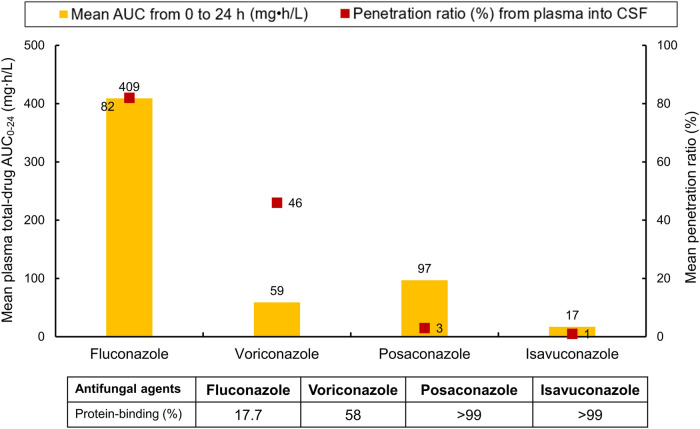 FIGURE 3
| MICs (mg/L) of tested BSI and CSF | No. (cumulative percentage) of isolates with indicated MIC values (mg/L) | MIC50 | MIC90 | ||||||||||||
|---|---|---|---|---|---|---|---|---|---|---|---|---|---|---|---|
| 0.004 | 0.008 | 0.015 | 0.03 | 0.06 | 0.12 | 0.25 | 0.5 | 1 | 2 | 4 | 8 | 16 | |||
| AMB (395) | 1 (0.3) | 19 (5.1) | 148 (42.5) | 224 (99.2) | 3 (100) | 1 | 1 | ||||||||
| BSI (201) | 10 (5.0) | 77 (43.3) | 114 (100) | 1 | 1 | ||||||||||
| CSF (194) | 1 (0.5) | 9 (5.2) | 71 (41.8) | 110 (98.5) | 3 (100) | 1 | 1 | ||||||||
| FLC (395) | 2 (0.5) | 11 (3.3) | 55 (17.2) | 143 (53.4) | 147 (90.6) | 34 (99.2) | 3 (100) | 2 | 4 | ||||||
| BSI (201) | 1 (0.5) | 4 (2.5) | 30 (17.4) | 76 (55.2) | 71 (90.5) | 17 (99.0) | 2 (100) | 2 | 4 | ||||||
| CSF (194) | 1 (0.5) | 7 (4.1) | 25 (17.0) | 67 (51.5) | 76 (90.7) | 17 (99.5) | 1 (100) | 2 | 4 | ||||||
| VRC (395) | 10 (2.5) | 53 (15.9) | 162 (57.0) | 138 (91.9) | 25 (98.2) | 5 (99.5) | 1 (99.7) | 1 (100) | 0.03 | 0.06 | |||||
| BSI (201) | 3 (1.5) | 29 (15.9) | 87 (59.2) | 65 (91.5) | 14 (98.5) | 3 (100) | 0.03 | 0.06 | |||||||
| CSF (194) | 7 (3.6) | 24 (16.0) | 75 (54.6) | 73 (92.2) | 11 (97.9) | 2 (99.0) | 1 (99.5) | 1 (100) | 0.03 | 0.06 | |||||
| POS (395) | 4 (1.0) | 17 (5.3) | 72 (23.5) | 172 (67.1) | 109 (94.7) | 19 (99.5) | 2 (100) | 0.12 | 0.25 | ||||||
| BSI (201) | 2 (1.0) | 5 (3.5) | 40 (23.4) | 90 (68.2) | 60 (98.0) | 4 (100) | 0.12 | 0.25 | |||||||
| CSF (194) | 2 (1.0) | 12 (7.2) | 32 (23.7) | 82 (66.0) | 49 (91.2) | 15 (99.0) | 2 (100) | 0.12 | 0.25 | ||||||
| ISA (153) | 3 (2.0) | 6 (5.9) | 24 (21.6) | 66 (64.7) | 29 (83.7) | 19 (96.1) | 4 (98.7) | 2 (100) | 0.03 | 0.12 | |||||
| BSI (70) | 2 (2.9) | 3 (7.1) | 5 (14.3) | 32 (60) | 15 (81.4) | 9 (94.3) | 3 (98.6) | 1 (100) | 0.03 | 0.12 | |||||
| CSF (83) | 1 (1.2) | 3 (4.8) | 19 (27.7) | 34 (68.7) | 14 (85.5) | 10 (97.6) | 1 (98.8) | 1 (100) | 0.03 | 0.12 | |||||
| Agent (no. of isolates tested) | No. (cumulative percentage) of isolates with indicated MIC values (mg/L) | MIC90 (mg/L) | |||||||||||||
|---|---|---|---|---|---|---|---|---|---|---|---|---|---|---|---|
| 0.008 | 0.015 | 0.03 | 0.06 | 0.12 | 0.25 | 0.5 | 1 | 2 | 4 | 8 | 16 | 32 | 64 | ||
| AMB (93) | 1 (1.1) | 1 (2.2) | 35 (39.8) | 55 (98.9) | 1 (100) | 1 | |||||||||
| FLC (93) | 1 (1.1) | 4 (5.4) | 14 (20.4) | 34 (57.0) | 33 (92.5) | 7 (100) | 4 | ||||||||
| VRC (93) | 2 (2.2) | 14 (17.2) | 43 (63.4) | 24 (89.2) | 9 (98.9) | 1 (100) | 0.12 | ||||||||
| POS (93) | 1 (1.1) | 4 (5.4) | 15 (21.5) | 38 (62.4) | 30 (94.6) | 5 (100) | 0.25 | ||||||||
| ISA (31) | 8 (25.8) | 9 (54.8) | 9 (83.9) | 4 (96.8) | 1 (100) | 0.12 | |||||||||
|
| Amphotericin B | Fluconazole | Voriconazole | Posaconazole | Isavuconazole |
|---|---|---|---|---|---|
|
| 1 | 4 | 0.5 | 0.5 | 0.25 |
|
| 0.5 | 8 | 1 | 0.5 | 0.25 |
| Agents and species | No. (cumulative percentage) of isolates with indicated MIC values (mg/L) | ||||||||||||
|---|---|---|---|---|---|---|---|---|---|---|---|---|---|
| 0.004 | 0.008 | 0.015 | 0.03 | 0.06 | 0.12 | 0.25 | 0.5 | 1 | 2 | 4 | 8 | 16 | |
| Amphotericin B | |||||||||||||
|
| 1 (1.0) | 12 (11.7) | 43 (50.5) | 55 (100) | |||||||||
|
| 5 (1.9) | 99 (38.5) | 163 (98.9) | 3 (100) | |||||||||
|
| 1 (9.1) | 5 (54.5) | 5 (100) | ||||||||||
| Fluconazole | |||||||||||||
|
| 1 (1.0) | 7 (7.2) | 26 (30.6) | 30 (57.7) | 30 (84.7) | 15 (98.2) | 2 (100) | ||||||
|
| 4 (1.5) | 28 (11.9) | 109 (52.2) | 111 (93.3) | 17 (99.6) | 1 (100) | |||||||
|
| 1 (9.1) | 4 (45.5) | 5 (90.9) | 1 (100) | |||||||||
| Voriconazole | |||||||||||||
|
| 7 (6.3) | 27 (30.6) | 39 (65.8) | 32 (94.6) | 6 (100) | ||||||||
|
| 2 (0.7) | 26 (10.4) | 120 (54.8) | 99 (91.5) | 17 (97.8) | 4 (99.3) | 1 (99.6) | 1 (100) | |||||
|
| 1 (9.1) | 3 (36.4) | 5 (81.8) | 2 (100) | |||||||||
| Posaconazole | |||||||||||||
|
| 3 (2.7) | 4 (6.3) | 26 (29.7) | 43 (68.5) | 23 (89.2) | 10 (98.2) | 2 (100) | ||||||
|
| 1 (0.4) | 13 (5.2) | 46 (22.2) | 124 (68.1) | 80 (97.8) | 6 (100) | |||||||
|
| 3 (27.2) | 5 (72.7) | 3 (100) | ||||||||||
| Isavuconazole | |||||||||||||
|
| 3 (12.5) | 3 (25) | 5 (45.8) | 9 (83.3) | 4 (100) | ||||||||
|
| 3 (2.5) | 19 (18.0) | 56 (63.9) | 25 (84.4) | 15 (96.7) | 3 (99.2) | 1 (100) | ||||||
|
| 4 (80) | 1 (100) | |||||||||||
| Antibiotics, dosages (PD indices against yeasts) | PK profiles and molecular weights | ||||
|---|---|---|---|---|---|
| Total-drug AUC0-24 (μg•h/mL) in plasma, or Cmax (doses of administration) | Half-life (h) | Protein binding (%) | Molecular weight (g/mol) | (1) Ratios of CSF, or brain-to-plasma [antifungal] (meaning antifungal concentration), or | |
| FLC [AUC0-24/MIC ≥25 at the infection site ( | 336–482, with a mean of 409 (400 mg qd) ( | 30 ( | 12.5–22.9 ( | 305 ( | 1.0.74–0.89, for [FLC]CSF/[FLC]plasma ratio, calculated in terms of total concentration (Nau et al., 2010) |
| VRC [AUC0-24/MIC ≥25 at the infection site ( | 59.0; and for free-drug, 24.8 (6 mg/kg bid on day 1, then 4 mg/kg bid since day 2) ( | 6.1 ( | 58 ( | 349 ( | 1.0.46, for the ratio of [VRC]CSF/[VRC]plasma, calculated in terms of total-drug concentration ( |
| ISA [AUC0-24/MIC ≥25 at the infection site ( | 97.0 (372 mg every 8 h for 6 doses, and 372 mg once daily since day 3) ( | 85–117 ( | >99 ( | 438 ( | 1.1.8, for the ratio of [ISA]brain/[ISA]plasma (rat model) ( |
| POS [AUC0-24/MIC ≥25 at the infection site ( | 17.2 ± 14.8 (multiple doses of 400 mg bid) ( | 24–27 ( | >98 ( | 700 ( | 1. Poor (both <0.01) penetration ratios in terms of plasma-to-CSF and plasma-to-brain concentration for POS ( |
| LAmB [Cmax, site/MIC ≥4 ( | Total-drug Cmax, 5.17 (+1.89) [multiple doses of 4.55 + 0.23 mg/kg/day for 6–7 days) ( | 400 ( | 98 ( | 924 ( | 1. (1.99 + 0.33) – (2.32 + 0.51) μg/g for [LAmB]brain, on a dosage of 5 mg/kg/day for >7 doses (rabbit model) ( |
Peer Reviews
No public reviews on file for this paper yet. If you reviewed it on a platform where reviews are public (OpenReview, ICLR, NeurIPS, ICML), you can paste yours below so the community can read it here.
Videos
No videos yet. Explain this paper in a talk, walkthrough, or lecture? Add one.
Taxonomy
TopicsFungal Infections and Studies · Antifungal resistance and susceptibility · Nail Diseases and Treatments
Introduction
Cryptococcal meningitis and meningoencephalitis (MME) are major causes of global infectious morbidity and mortality and can affect patients regardless of immune status (Iyer et al., 2021; Lee et al., 1996; Sudan et al., 2013; Su et al., 2024). Mortality rates due to cryptococcal MME reportedly range from 24% to 47% at 10 weeks (Jarvis et al., 2022; Molloy et al., 2018). In 2022, the World Health Organization listed Cryptococcus neoformans as a top fungal priority pathogen (Chang et al., 2024; World Health Organization, 2022).
Fluconazole (FLC) has been widely used for over 3 decades in the treatment of fungal infections. However, its increased global use has been associated with rising minimum inhibitory concentrations (MICs) against a variety of fungal pathogens (Bicanic et al., 2007; Pfaller et al., 2009; Sar et al., 2004). Due to FLC’s relatively narrow antifungal spectrum and the gradual increase in resistance, alternative antifungal agents with broader activity have been developed over the past 2 decades to target clinically important fungal species (Su et al., 2024).
Infections caused by Cryptococcus species in the central nervous system (CNS) are not confined to the cerebrospinal fluid (CSF). Lee et al. reported that these infections not only result in severe meningitis due to disruption of the blood-CSF barrier, but also involve the brain parenchyma, leading to severe encephalitis (Lee et al., 1996). This is particularly common in immunocompromised hosts such as patients with chronic human immunodeficiency virus (HIV) infection, Hodgkin’s disease, liver cirrhosis, or those undergoing solid organ transplantation (SOT), etc. (Chang et al., 2024). Therefore, when selecting antifungal agents for the treatment of CNS cryptococcosis, it is essential to consider their penetration into both the CSF and brain tissue. FLC and voriconazole (VRC) have demonstrated effective CNS penetration (see below), even in the absence of meningeal inflammation—unlike amphotericin B (AMB) and posaconazole (POS) (Felton et al., 2014; Nau et al., 2010).
The 2024 guidelines for cryptococcosis treatment recommend all newer triazoles as alternative agents (Chang et al., 2024). Although the guidelines mention alternative triazoles, robust evidence on MIC distributions and pharmacokinetic (PK)/pharmacodynamic (PD) analyses for Cryptococcus are scarce. Comodeling both PK and PD data—where available—provides valuable insights into the importance of tissue concentrations for antifungal agents (Felton et al., 2014). This knowledge gap, therefore, prompted us to analyze the variability among these key antifungal agents from multiple perspectives relevant to the effective treatment of cryptococcal infections worldwide.
The variability of MIC measurements of microorganisms—including Cryptococcus isolates and other fungi—against a given antifungal is well recognized. This variability is generally attributed to biological variation (i.e., inter-strain differences), intra-laboratory assay variability, and inter-laboratory methodological differences (Espinel-Ingroff et al., 2009; Espinel-Ingroff et al., 2012a; Mouton et al., 2018). Nevertheless, at any site of infection, MIC data for a specific antimicrobial against pathogens are crucial for understanding exposure-response relationships. Additionally, when the PK-PD parameters are applied, it is also important to consider that the hysteresis phenomenon, which refers to a delayed distribution of an antimicrobial to the site of action or the involvement of active metabolites. This may result in a lag or persistence in the antimicrobial effect (liposomal AMB [LAmB] (Bekersky et al., 2000) and caspofungin), even when the plasma drug concentration has declined (Felton et al., 2014; Hope, 2012).
The epidemiological cutoff values (ECVs) of antifungal agents against Cryptococcus species are not predictive of in vivo efficacy (Pharkjaksu et al., 2020), but they are used to distinguish wild-type (WT) from non-WT (i.e., resistant) isolates (CLSI, 2018). Due to the complexity of interpreting susceptibility data, we referred to the ECVs of antifungals against Cryptococcus species documented in the PubMed database (Jean et al., 2024), rather than relying on a single MIC value—such as MIC_90_ values of invasive Cryptococcus isolates for given antifungals—as a surrogate for further analysis.
Given the known PK variability of agents such as VRC, incorporating ECV-based strategies for dose optimization is methodologically sound—particularly in the absence of robust PD targets for Cryptococcus infections. In this context, PD targets established for Candida species (Li et al., 2010) are cautiously extrapolated to Cryptococcus isolates in this investigation. Furthermore, relatively few studies have estimated concentration-time profiles of antifungals in humans. Therefore, PK data for key antifungal agents—including data from laboratory animal models, where relevant and where corresponding human data are unavailable—were obtained from previously published sources (Jean et al., 2022). In this study, we applied the documented ranges of PK parameters, rather than relying solely on mean values, to evaluate the probability of PK/PD target attainment. The novelty of this study, which combines Antimicrobial Testing Leadership and Surveillance (ATLAS) MIC data with PK/PD analysis, lies in its indirect assessment of the appropriateness of various antifungal dosages for treating Cryptococcus infections, which often involve the CSF and cerebral tissue.
Materials and methods
Species, antifungal MICs, and MIC distributions of Cryptococcus isolates
Pfizer Pharmaceuticals (New York City, NY, USA) conducted the ATLAS project to investigate the MIC data of clinically significant microorganisms involved in global clinical infections to indicated antibiotics since 2006. To investigate the MIC distributions of important Cryptococcus species to the key antifungal agents, we extracted the antifungal 2010–2023 ATLAS database for analysis. The Cryptococcus isolates for which MIC data were determined for isavuconazole (ISA) were available since 2017.
The majority of Cryptococcus isolates were collected from blood or CSF samples. Additionally, the antifungal MIC profiles of Cryptococcus isolates collected from other clinical specimens—such as aspirated fluid from cysts or intra-articular space, wound pus, pleural or peritoneal fluid, biopsied tissue from the gastrointestinal tract, urinary tract, sinus, head, neck, or face—were also analyzed in patients with cryptococcosis worldwide. Antifungal MICs against the Cryptococcus isolates obtained directly from human brain tissue were not available in the ATLAS database. Isolates collected from other sources were excluded from further analysis.
Standard biochemical tests were used to accurately identify Cryptococcus species in each hospital participating in the ATLAS project. All isolates of the C. gattii species complex (hereafter referred to as Cryptococcus gattii) were further confirmed by examining melanin production on 3,4-dihydroxyphenylalanine media (Kwon-Chung et al., 1982). Additionally, DNA sequences from multiple genes, such as URA5, LAC1, CAP59, and CAP64, as well as the intergenic spacer and the internal transcribed spacer regions of the ribosomal DNA gene cluster, were used as supplementary methods to distinguish species within C. neoformans var. neoformans (hereafter referred to as C. neoformans), C. neoformans var. grubii (hereafter referred to as Cryptococcus grubii) and C. gattii (Chen et al., 2014).
Broth microdilution testing was used to determine the MIC levels of Cryptococcus isolates to the key antifungal agents (AMB, FLC, VRC, POS, and ISA). The tests were conducted according to the protocol M27-A4 of the Clinical and Laboratory Standards Institute. RPMI 1640 medium containing 0.2% glucose was used, and an inoculum ranging from 0.5 × 10^3^ to 2.5 × 10^3^ cells/mL was incubated in the air at 35 °C (CLSI, 2017). The concentration range tested in this study was 0.004–64 mg/L.
Data synthesis
The MIC distributions of all studied Cryptococcus isolates—regardless of whether they were sourced from bloodstream infections (BSI) or CSF—as well as those of the three predominant Cryptococcus species for key antifungal agents under investigation, were clearly presented in the respective tables. Additionally, correlation analyses of MIC distributions among subsets of Cryptococcus isolates for different triazoles were presented in the corresponding figures.
Statistical analyses
The MIC distributions of isolates of different Cryptococcus species for a specific antifungal agent were compared using the Mann-Whitney U test, where appropriate. Additionally, correlation analysis was performed to evaluate the relationships in MIC trends among invasive Cryptococcus isolates causing BSI and MME for the four azole agents, as appropriate. All statistical calculations were two-tailed, and a P value less than 0.05 was considered statistically significant. All statistical analyses were conducted using SPSS version 17.0 (IBM Corp., Armonk, NY, USA).
Results
MIC distributions and non-WT proportions of Cryptococcus isolates for different antifungals
Of all 488 Cryptococcus isolates under evaluation between 2010 and 2020, 395 (80.9%) were obtained from blood (n = 201) or CSF (n = 194), with the remaining 93 isolates (19.1%) originating from various other specimens.
The MIC distributions for Cryptococcus isolates, whether sourced from bloodstream or MME (as indicated by CSF cultures), exhibited a high degree of congruence across all tested antifungals (Table 1). Additionally, we used the Mann–Whitney U test to compare the MIC distributions of Cryptococcus isolates cultured from miscellaneous specimens with those causing BSI/MME against key antifungal agents (Table 2). This analysis revealed similar susceptibility patterns among Cryptococcus isolates from various infection sources.
For AMB, the MIC distribution culminates in 2 mg/L, with an MIC_90_ of 1 mg/L. In contrast, the MIC distribution extends to higher values to FLC, with a 100% inhibition rate observed at 16 mg/L (MIC_90_ value of 4 mg/L for FLC). The MIC distribution of Cryptococcus isolates for the newer triazole antifungals—VRC, POS, and ISA—shows 100% inhibition at significantly lower concentrations compared to FLC. Specifically, VRC and POS achieve full inhibition at 1 mg/L (with MIC_90_ values of 0.06 and 0.25 mg/L, respectively), while ISA achieves full inhibition at 0.5 mg/L (with an MIC_90_ value of 0.12 mg/L).
The ECVs of Cryptococcus species for antifungal agents discussed in this study are summarized in Table 3.
The non-WT proportions among Cryptococcus isolates causing BSI/MME in the 2010–2020 antifungal ATLAS database were 9.1% for FLC, 0.3% for VRC, 0.5% for POS, 1.3% for ISA, and 2.0% for AMB, respectively, based on ECVs published in the PubMed literature.
MIC distributions of various significant Cryptococcus species causing BSI/MME to key antifungals
Table 4 presents MIC values for isolates of the three predominant Cryptococcus species causing BSI/MME: C. neoformans (111 isolates), C. grubii (270 isolates), and C. gattii (11 isolates), against the evaluated antifungal agents.
AMB exhibits a potent inhibitory effect across all variants of Cryptococcus species, with notably lower MICs for C. neoformans. FLC is shown to reveal an intriguing susceptibility pattern. C. grubii isolates exhibit a lower MIC distribution to FLC compared to C. neoformans, with statistical significance (P = 0.009).
A distinct susceptibility profile emerges for VRC and ISA. C. neoformans isolates displayed significantly lower MICs for these two agents when compared to C. grubii (both P values <0.005). Conversely, isolates of C. gattii (n = 11) tended to exhibit higher MIC values to three triazoles, especially for POS and ISA. Consequently, variability in triazole susceptibility was observed among different Cryptococcus species.
Correlation analyses between MIC distributions of studied invasive Cryptococcus isolates for FLC, VCZ, POS, and ISA
Spearman rank correlation was considered scientifically more appropriate and statistically valid than Pearson’s correlation analysis due to the non-normal distribution for all antifungal MIC data in this investigation. Accordingly, we analyzed the MICs of 395 invasive Cryptococcus isolates for FLC and VRC, POS using Spearman correlation analysis. A strong negative correlation was observed between FLC and VRC (r = −0.877, P < 0.001), as well as between FLC and POS (r = −0.874, P < 0.001) (Figure 1A).
(A,B) Correlation trends between minimum inhibitory concentration (MIC) distributions for global Cryptococcus isolates collected between 2010 and 2020 (A) and between 2017 and 2023 (B) associated with bloodstream infections and meningitis/meningoencephalitis. MICs were evaluated against four azole antifungals: fluconazole, voriconazole, posaconazole, and isavuconazole. Spearman correlation analyses were conducted to assess relationships between agents. Linear trendlines are shown for all pairwise comparisons MIC, minimum inhibitory concentration. FLC, fluconazole. VRC, voriconazole. POS, posaconazole. ISA, isavuconazole.
In contrast, among 177 invasive Cryptococcus isolates globally collected between 2017 and 2023, a moderately strong positive correlation was observed between VRC and POS (r = 0.688, P < 0.001), along with a weaker correlation between VRC and ISA (r = 0.219, P < 0.001), and a strong correlation between POS and ISA (r = 0.718, P < 0.001) using Spearman correlation analysis as well (Figure 1B). Furthermore, using non-parametric tests to evaluate the MIC distributions of these global invasive Cryptococcus isolates for the three newer triazoles, we found that POS MICs were significantly right-skewed, followed by VRC and then ISA. The respective MIC_90_ values were 0.25, 0.06, and 0.12 mg/L (all P values <0.001).
Other noteworthy points related to PK-PD indices for key antifungals against Cryptococcus isolates
Although the MIC distributions of global Cryptococcus isolates for key antifungal agents were analyzed in the preceding section, their relationships with PK-PD indices relevant to clinical prescription for effective treatment of Cryptococcus infections that caused BSI/MME required further exploration. In the following section, we attempt to analyze the application of antifungal MIC distributions alongside associated PK–PD parameters to guide optimal antifungal dosing for the management of Cryptococcus infections causing BSI and MME, based on appropriate evidence selected from the PubMed literature database.
Discussion
The strong negative correlations observed between FLC and VRC/POS MICs (Figure 1A) suggest that possible resistance mechanisms to FLC—such as mutations in ERG11 (encoding lanosterol 14α-demethylase [i.e., CYP51]) and efflux pump overexpression—may not confer cross-resistance to newer triazoles like VRC and POS. Moreover, chromosomal plasticity, particularly whole-chromosome aneuploidy (notably chromosome one disomy in C. neoformans), can emerge rapidly under triazole pressure and markedly increase FLC MICs, facilitating Cryptococcus adaptation to FLC and highlighting in-host evolution driven by genome plasticity (Sionov et al., 2010).
The parallel trend in VRC and POS MIC distributions (Figure 1B) indicates possible co-selection of resistance upon exposure, implying that empirical use of either agent may be less reliable without MIC-guided therapy.
Structurally, POS contains a rigid triazole core and a bulky hydrophobic side chain, whereas ISA features a bulky isobutyryloxy side arm attached to its core, which greatly enhances the orientation of its triazole ring and enables tighter binding to fungal CYP51 (Datta et al., 2013). Differences in CYP51 binding affinity between ISA and VRC/POS to Cryptococcus isolates suggest ISA’s ability to evade common resistance mechanisms of other azoles, such as overexpression of the ABC transporter AFR1 (Arastehfar et al., 2020), which actively extrudes many triazoles from the fungal cells, thereby lowering their intracellular concentrations; and point mutations like Y145F and G484S in the ERG11 gene (Sionov et al., 2012), which alter the CYP51 binding pocket and reduce the affinity of many triazoles, particularly for VRC and POS, to non-WT Cryptococcus isolates. As a result, cross-resistance between ISA and other triazoles cannot be reliably inferred.
These findings may have therapeutic implications. The distinct susceptibility profile of ISA suggests that it could serve as an alternative treatment option for non-WT Cryptococcus strains exhibiting elevated MICs to FLC, VRC, and POS. ISA or LAmB should be strongly considered for the treatment of systemic cryptococcosis in patients with recent exposure to VRC or POS.
In this study, we identified dosing strategies optimized for the effective treatment of invasive Cryptococcus infections by leveraging antifungal MIC data from the ATLAS database, documented ECVs, and published PK–PD parameters. Additionally, as illustrated in Figure 2, we cautiously excluded 3,486 studies that did not report the detailed methods to generate the PK data for antifungals, or clinical outcomes for patients with cryptococcosis receiving antifungal therapy.
Flow diagram illustrating the number of PubMed literature reports that were screened and excluded during the analyses of pharmacokinetic (PK) profiles for the antifungal agents under investigation, and pharmacodynamic (PD) indices for the studied antifungals against yeasts.
The published ECVs for FLC against Cryptococcus species range from 4 mg/L (for C. neoformans and C. grubii) to 8 mg/L (for C. gattii) (Espinel-Ingroff et al., 2012a; Jean et al., 2024; Lockhart et al., 2012). Among the invasive Cryptococcus isolates evaluated, approximately 91% had FLC MICs below 4 mg/L and were classified as WT strains (Table 1).
For FLC, we screened 1,264 studies to investigate its PK profile. Based on the PK data for FLC (Arredondo et al., 1994; Buijk et al., 2001; Nau et al., 2010; Santos et al., 2016) (Table 5), the free-drug area under-the-concentration-time curve from zero to 24 h (AUC_0-24_) is estimated to range from 191.7 μg·h/mL to 375.4 μg·h/mL in CSF, and from 157.6 μg·h/mL to 226.1 μg·h/mL in brain tissue for patients receiving 400 mg of FLC daily. Accordingly, regrowth of Cryptococcus isolates residing in brain tissue with an MIC of ≤4 mg/L to FLC could be effectively inhibited in patients with CNS cryptococcosis receiving FLC at 400 mg/day.
Similar to the global WT rate of 90.9% (Jean et al., 2024), approximately 91% of worldwide Cryptococcus isolates in the CSF exhibited FLC MICs ≤4 mg/L. Additionally, data from the 2010–2020 antifungal ATLAS database indicate that the MIC distribution of invasive Cryptococcus isolates against FLC was statistically shifted toward lower values in the Asia–Western Pacific region and Europe (MIC_90_ = 4 mg/L), compared to higher values in North and Latin America (MIC_90_ = 8 mg/L) (Jean et al., 2024).
Because FLC concentrations in blood and CSF correlate strongly with daily dose in humans (Schiave et al., 2018), increasing the maintenance dose of FLC to at least 800 mg/day may be necessary for effective treatment of patients with CNS cryptococcosis during the induction phase—particularly in regions outside the Americas. For invasive Cryptococcus infections in North and Latin America, and specific genotypes of C. gattii isolates in China and Colombia (Firacative and Escandón, 2021; Hagen et al., 2010; Xu et al., 2021), increasing the FLC maintenance dose up to 1,200 mg/day, adding 5-flucytosine (5-FC), or switching to VRC (see below) during the induction phase appears to be warranted. This dosage rationale is consistent with previous investigations (Schiave et al., 2018; Sudan et al., 2013).
For VRC, the published ECVs for Cryptococcus species reportedly ranged from 0.5 mg/L (for C. neoformans and C. grubii) to 1 mg/L (for Cryptococcus gatti) (Espinel-Ingroff et al., 2012a; Jean et al., 2024; Lockhart et al., 2012). The majority of Cryptococcus isolates collected in the 2010–2020 ATLAS project exhibited MIC ≤0.5 mg/L to VRC (100% for BSI isolates and 99.5% for CSF isolates) (Table 1).
For effective treatment of yeast infections, an AUC/MIC ratio greater than 25 is generally recommended for azoles (Li et al., 2010). If the MICs of Cryptococcus isolates to VRC approach the ECV (1 mg/L), achieving an adequate AUC of ≥25 μg h/mL at the infection site becomes critical. For VRC, we screened 1,130 studies to investigate its PK profile. Integrating the human PK profiles from important literature regarding administration of standard VRC dosage (Table 5) (Al-Saigh et al., 2012; Elter et al., 2006; Felton et al., 2014; Hope, 2012), VRC appears to be effective in inhibiting the growth of Cryptococcus isolates in the CNS, even in the absence of pronounced meningeal inflammation.
Anecdotal case reports have also demonstrated the efficacy of VRC after other antifungal therapies failed in the treatment of cryptococcosis (Bandettini et al., 2009; Carbonara et al., 2009; Chang et al., 2010; Shen et al., 2008). However, therapeutic drug monitoring (TDM) for VRC is warranted during its administration to avoid adverse effects (e.g., hepatotoxicity, visual disturbances, and neurotoxicity), as significant variations in serum levels can occur due to multiple influencing factors.
The published ECV for POS against major Cryptococcus species is 0.5 mg/L (Espinel-Ingroff et al., 2012a; Jean et al., 2024; Lockhart et al., 2012). Similar to VRC, 99.5% of invasive Cryptococcus isolates collected in the 2010–2020 ATLAS project were categorized as WT strains for POS (Table 1).
For POS, we screened 595 studies to investigate its PK profile. Although the 2024 global cryptococcosis treatment guidelines list POS as an optional alternative to FLC (Chang et al., 2024), the molecular weight of POS (approximately 700 g/mol) is significantly higher than that of other triazoles (Felton et al., 2014). This characteristic may partly explain the extremely low concentrations of POS in brain tissue and CSF (Felton et al., 2014). These PK limitations are consistent with the findings from a case series by Pitisuttithum et al., which enrolled 29 patients with cryptococcal meningitis receiving POS therapy (Pitisuttithum et al., 2005). The series reported a clinical failure rate of 51.7% (15/29). Among the 14 patients with successful outcomes, 6 (42.9%) still tested for positive India ink staining in the CSF, and one patient remained serum cryptococcal antigen-positive (Pitisuttithum et al., 2005). Accordingly, POS appears to be a suboptimal option for managing cryptococcosis involving the CNS, especially when compared to other triazoles (Arredondo et al., 1994). It is noteworthy that POS is predominantly metabolized by the CYP3A4 enzyme. TDM for immunosuppressants is essential to optimize their efficacies and minimize toxicities in immunocompromised hosts.
The published ECV for ISA against major Cryptococcus species is 0.25 mg/L (Espinel-Ingroff et al., 2015; Jean et al., 2024). Also similar to VRC and POS, 98.7% of the studied Cryptococcus isolates exhibited MIC below 0.25 mg/L for ISA (Table 1).
For ISA, we screened 234 studies to investigate its PK profile. ISA displays highly variable PK in human plasma (Desai et al., 2016). Despite these data, adjustment of the ISA maintenance dosage is usually not needed.
Notably, ISA achieves adequate concentrations in brain tissue (Wiederhold et al., 2016) but demonstrates poor penetration into the CSF, with plasma-to-CSF concentration ratios ranging from 0.02 to 0.04 in a rabbit model (Kovanda et al., 2019). This poses a significant challenge for its use in cryptococcal MME unless supported by another antifungal agent. Additionally, similar to POS, ISA is primarily metabolized by the CYP3A4 enzyme and, to a lesser extent, via glucuronidation pathways. TDM for key immunosuppressants is essential in immunocompromised hosts. Nevertheless, ISA may be preferred over VRC in elderly patients for antifungal treatment.
A small case series by Thompson et al. included five patients with cryptococcal meningitis treated with standard ISA dosing (372 mg every 8 h for six doses, followed by 372 mg once daily from day 3 onward) for durations ranging from 11 to 181 days. This study reported that there was complete success in only one case, partial success in three cases, and a fatal outcome in one case—despite sterile CSF cultures (Thompson et al., 2016). These findings further raise concerns regarding the clinical efficacy of ISA for the treatment of cryptococcosis, particularly in CNS infections.
A summary of key PK parameters—including mean total-drug plasma AUC_0–24_, protein-binding rates, and ratios of plasma-to-CSF penetration—for the four triazoles is illustrated in Figure 3.
Important pharmacokinetic parameters (including mean total-drug plasma AUC0–24, protein-binding rates, and ratios of plasma-to-CSF penetration) for the four triazoles. AUC0–24, area under-the-concentration-time curve from zero to 24 h. CSF cerebrospinal fluid. Dosages required to achieve the respective mean AUC0–24 were as follows: fluconazole, 400 mg once daily; voriconazole, 6 mg/kg every 12 h on day 1, followed by 4 mg/kg every 12 h from day 2 onward; posaconazole, 400 mg twice daily; isavuconazole, 372 mg every 8 h for six doses, followed by 372 mg once daily from day 3 onward.
For AMB, the published ECVs for Cryptococcus species range from 0.5 mg/L for C. gattii to 1 mg/L for C. neoformans and C. grubii (Espinel-Ingroff et al., 2012b; Jean et al., 2024). Approximately 43% of Cryptococcus isolates had MICs ≤0.5 mg/L, and 99% had MICs ≤1 mg/L to AMB (Table 1). Additionally, 55% of the studied C. gattii isolates (6/11) were categorized as WT strains, in contrast to 99%–100% of the C. neoformans and C. grubii isolates, which were WT (Table 4). Notably, the potential to AMB deoxycholate to achieve adequate CSF concentrations is constrained by its toxicity (Bekersky et al., 2002).
Over the past 2 decades, LAmB has been increasingly favored for the treatment of cryptococcal MME due to its reduced toxicity profiles (Iyer et al., 2021; Jarvis et al., 2019; Jarvis et al., 2022). Additionally, LAmB shows non-inferior efficacy to AMB deoxycholate for treatment of high fungal burden cases, such as disseminated cryptococcosis or severe pulmonary disease (Jarvis et al., 2022; Kimuda et al., 2025).
For LAmB, we screened 287 studies to investigate its PK profile. The useful PK profiles were clearly documented in a few investigations (Jean et al., 2022; Lee et al., 1994; O'Connor et al., 2013). The optimal PD index of AMB against yeasts is the ratio of the maximal concentration (C_max_) to MIC (C_max_/MIC), with a target value of ≥4 at the site of infection (Li et al., 2010).
Jarvis et al. demonstrated that a single high-dose administration of 10 mg/kg LAmB on day 1 is required in combination with maintenance antifungals with good CSF penetration (e.g., FLC 1200 mg/day and 5-FC 100 mg/kg/day) to achieve optimal CSF clearance rates of Cryptococcus (−0.40 log_10_ cfu/mL/day) in HIV patients with cryptococcal MME (Jarvis et al., 2022). Although data on the efficacy of a single high-dose LAmB in SOT recipients and other cryptococcal disease syndromes are lacking, a single 10 mg/kg LAmB therapy for cryptococcal BSI/MME is anticipated to significantly reduce the health-economic burden in low- and middle-income countries compared to a 3–4 mg/kg LAmB daily dosage for 7–14 days, and thus is worthy of broader consideration.
This survey of antifungal MIC distributions for Cryptococcus isolates has several limitations. First, the PD target used for Cryptococcus in this study was extrapolated from Candida studies, which may not accurately reflect cryptococcal pathophysiology. Second, LAmB and the newer triazoles remain largely unavailable in many low-income countries, limiting generalizability of the findings. Third, the number of C. gattii isolates in this study was too small to draw reliable conclusions. Fourth, even with early diagnosis, low MIC levels against Cryptococcus isolates and apparently optimal PK-PD profiles for a specific antifungal may not guarantee favorable outcomes, particularly in patients with severe systemic cryptococcosis and compromised immune conditions. Therefore, further clinical studies are needed to validate these observations.
Conclusion
In conclusion, all the newer triazoles (VRC, POS, ISA) demonstrated low MIC values against major Cryptococcus species. Both VRC and FLC achieve optimal CNS penetration. The combination of LAmB with FLC (1,200 mg daily) and 5-FC (100 mg/kg daily)–a cost-effective regimen–has been listed the standard induction–phase regimen. VRC exhibits superior PK characteristics for managing CNS cryptococcosis relative to ISA and POS, and appears to be a reasonable alternative to FLC during the induction treatment. However, due to substantial interindividual variability in PK profiles and notable drug-drug interactions, TDM for VRC is indicated for dose optimization. Additionally, ISA may represent a preferable option over POS during the consolidation phase of cryptococcosis treatment.
The reference list from the paper itself. Each links out to its DOI / PubMed record.
- 1Al-Saigh R.Elefanti A.Velegraki A.Zerva L.Meletiadis J. (2012). In vitro pharmacokinetic/pharmacodynamic modeling of voriconazole activity against Aspergillus species in a new in vitro dynamic model. Antimicrob. Agents Chemother. 56 (10), 5321–5327. 10.1128/AAC.00549-12 22869563 PMC 3457389 · doi ↗ · pubmed ↗
- 2Arastehfar A.Gabaldón T.Garcia-Rubio R.Jenks J. D.Hoenigl M.Salzer H. J. F. (2020). Drug-resistant fungi: An emerging challenge threatening our limited antifungal armamentarium. Antibiot. (Basel) 9 (12), 877. 10.3390/antibiotics 9120877 33302565 PMC 7764418 · doi ↗ · pubmed ↗
- 3Arredondo G.Martinez-Jorda R.Calvo R.Aguirre C.Suarez E. (1994). Protein binding of itraconazole and fluconazole in patients with chronic renal failure. Int. J. Clin. Pharmacol. Ther. 32 (7), 361–364. 7952798 · pubmed ↗
- 4Bandettini R.Castagnola E.Calvillo M.Micalizzi C.Ravegnani M.Pescetto L. (2009). Voriconazole for cryptococcal meningitis in children with leukemia or receiving allogeneic hemopoietic stem cell transplant. J. Chemother. 21 (1), 108–109. 10.1179/joc.2009.21.1.108 19297284 · doi ↗ · pubmed ↗
- 5Bekersky I.Boswell G. W.Hiles R.Fielding R. M.Buell D.Walsh T. J. (2000). Safety, toxicokinetics and tissue distribution of long-term intravenous liposomal amphotericin B (Am Bisome): a 91-day study in rats. Pharm. Res. 17 (12), 1494–1502. 10.1023/a:1007605024942 11303959 · doi ↗ · pubmed ↗
- 6Bekersky I.Fielding R. M.Dressler D. E.Lee J. W.Buell D. N.Walsh T. J. (2002). Pharmacokinetics, excretion, and mass balance of liposomal amphotericin B (Am Bisome) and amphotericin B deoxycholate in humans. Antimicrob. Agents Chemother. 46 (3), 828–833. 10.1128/AAC.46.3.828-833.2002 11850268 PMC 127462 · doi ↗ · pubmed ↗
- 7Bicanic T.Meintjes G.Wood R.Hayes M.Rebe K.Bekker L. G. (2007). Fungal burden, early fungicidal activity, and outcome in cryptococcal meningitis in antiretroviral-naive or antiretroviral-experienced patients treated with amphotericin B or fluconazole. Clin. Infect. Dis. 45 (1), 76–80. 10.1086/518607 17554704 · doi ↗ · pubmed ↗
- 8Buijk S. L.Gyssens I. C.Mouton J. W.Verbrugh H. A.Touw D. J.Bruining H. A. (2001). Pharmacokinetics of sequential intravenous and enteral fluconazole in critically ill surgical patients with invasive mycoses and compromised gastro-intestinal function. Intensive Care Med. 27 (1), 115–121. 10.1007/s 001340000771 11280621 · doi ↗ · pubmed ↗