Multi-phases of islet beta-cell function change in type 2 diabetes mellitus and its influencing factors
Jin Cheng, Jun Li, Yaping Xin, Dongming Zhang

TL;DR
This study identifies three distinct phases of beta-cell function changes in type 2 diabetes over decades and finds factors influencing these changes.
Contribution
The study reveals a nonlinear, multi-phase pattern of beta-cell function decline in type 2 diabetes and identifies associated influencing factors.
Findings
Beta-cell function initially increases, then declines exponentially, and finally plateaus over decades.
Higher BMI, metabolic syndrome, and lower HbA1c are linked to higher residual beta-cell function.
Earlier diagnosis is associated with a faster decline in beta-cell function.
Abstract
Based on cross-sectional and follow-up data, we aimed to explore the continuous long-term pattern of beta-cell function change in type 2 diabetes and to analyze the relevant influencing factors. Data from 2898 type 2 diabetic subjects were retrospectively analyzed. Islet beta-cell function was evaluated by the homeostasis model assessed index (HOMA-β). The pattern of association between HOMA-β and disease duration coverup of 50 years were explored using non-linear regression approaches. Findings were replicated in longitudinal follow-up data from multi-centers. Influencing factors of both residual HOMA-β level and HOMA-β decline rate were investigated. We identified a model including three clear phases of HOMA-β change: an initial ascending phase over 4.2 years from diagnosis (3.34% change per year [95%CI 0.04, 6.52]), followed by a phase of exponential fall up to 20.9 years from…
Genes, proteins, chemicals, diseases, species, mutations and cell lines named across the full text — each resolved to its canonical identifier and authoritative record.
Click any figure to enlarge with its caption.
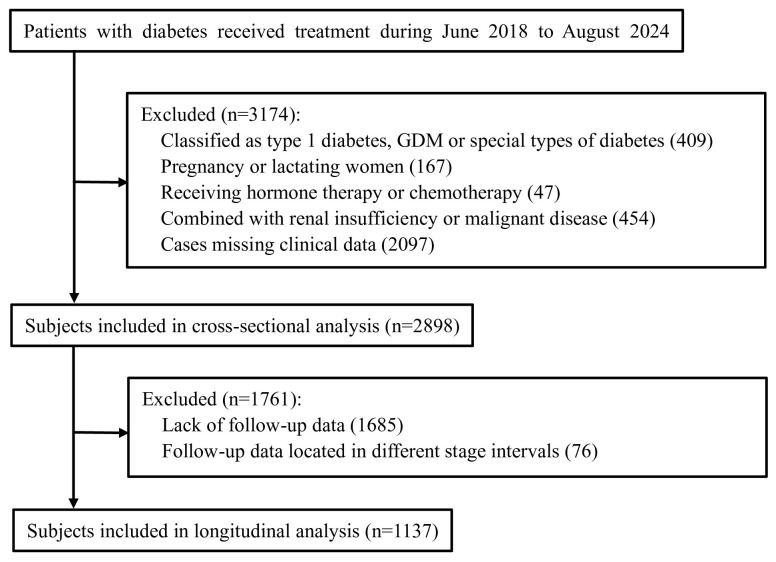 Figure 1
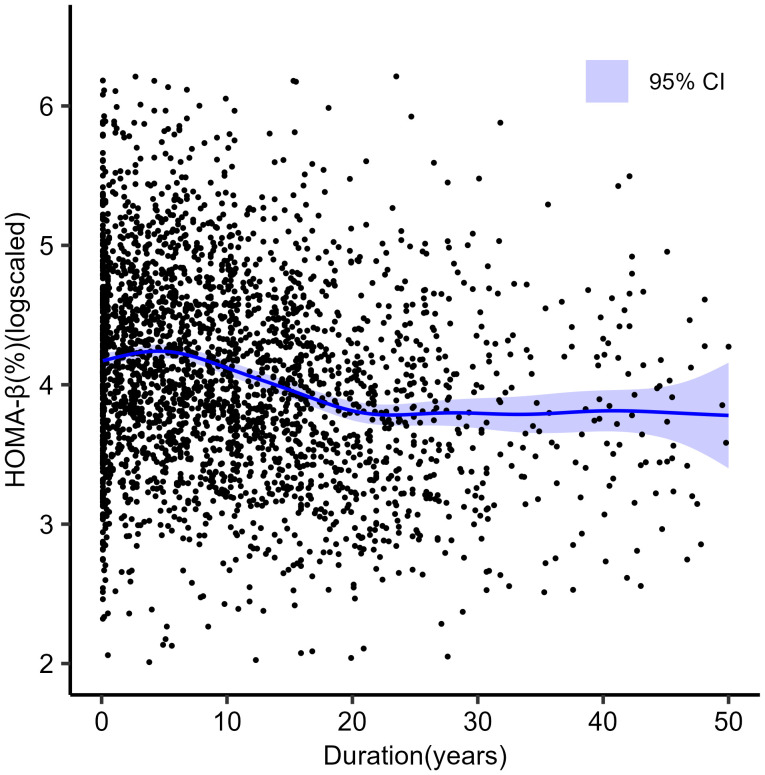 Figure 2
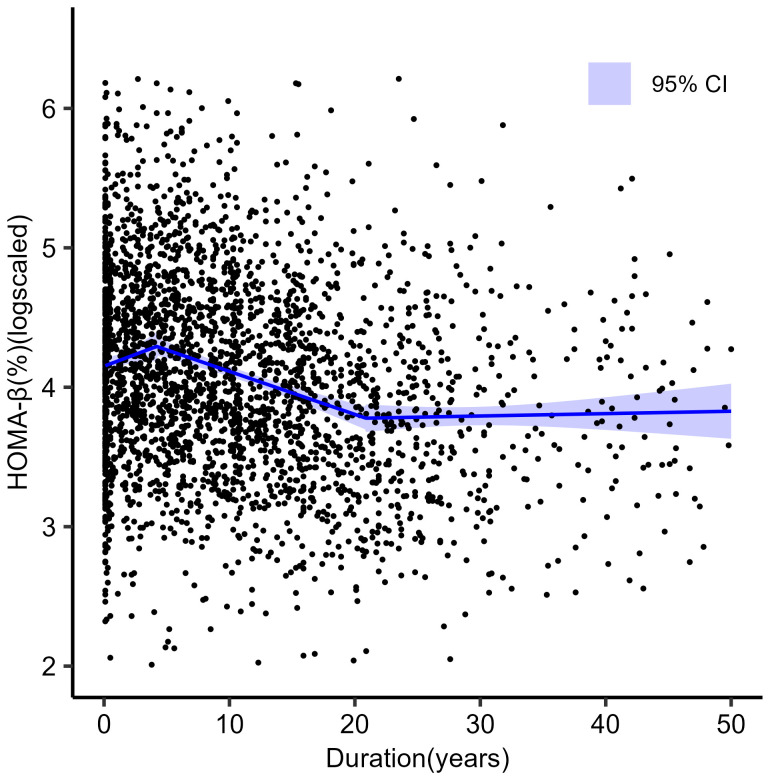 Figure 3
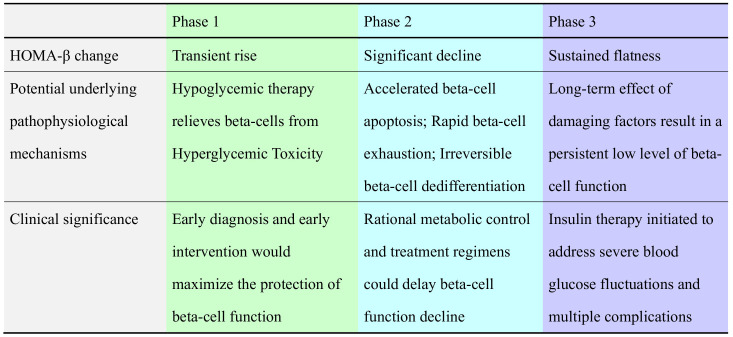 Figure 4
| Variable | Value |
|---|---|
| FCP, pmol/L | 865.8 (599.4, 1185.5) |
| HOMA-β, % | 58.0 (35.9, 95.6) |
| Age, year | 60.0 (50.0, 69.0) |
| Age of diagnosis, year | 48.4 (40.3, 56.7) |
| Duration, year | 8.4 (2.6, 15.8) |
| Male, n (%) | 1614 (55.7) |
| BMI, kg/m2 | 25.0 (23.0, 27.4) |
| HbA1c, mmol/mol | 61.7 (50.8, 81.4) |
| HbA1c, % | 7.8 (6.8, 9.6) |
| LDL-C, mmol/L | 2.73 (2.07, 3.45) |
| TG, mmol/L | 1.53 (1.07, 2.34) |
| UA, mmol/L | 308.0 (250.0, 373.0) |
| SBP, mmHg | 130.0 (125.0, 138.0) |
| DBP, mmHg | 78.0 (74.0, 85.0) |
| Smoking, n (%) | 573(19.8) |
| Drinking, n (%) | 292 (10.1) |
| Diabetic retinopathy, n (%) | 489 (16.9) |
| Diabetic nephropathy, n (%) | 591 (20.4) |
| Diabetic neuropathy, n (%) | 2286 (78.9) |
| Insulin, n (%) | 923 (31.8) |
| Metformin, n (%) | 1970 (68.0) |
| Sulfonylureas, n (%) | 551 (19.0) |
| TZDs, n (%) | 191 (6.6) |
| α-glucosidase inhibitors, n (%) | 2086 (72.0) |
| SGLT-2 inhibitors, n (%) | 1101 (38.0) |
| GLP-1 Ras, n (%) | 397 (13.7) |
| DPP-4 inhibitors, n (%) | 548 (18.9) |
| MetS, n (%) | 1944 (67.1) |
| Phase | Parameter |
|---|---|
| Phase 1 | |
| Estimated HOMA-β (%) level at diagnosis § [95% CI] | 63.4 [61.4, 65.4] |
| Slope 1 [95% CI] | 0.0339 [0.0004, 0.0674] *** |
| Percentage change per year † [95% CI] | 3.34% [0.04, 6.52] *** |
| Phase 2 | |
| Breakpoint1 (year) [95% CI] | 4.20 [2.31, 6.09] |
| Slope 2 [95% CI] | -0.0309 [-0.0385, -0.0232] *** |
| Percentage change per year † [95% CI] | -3.04% [-3.78, -2.29] *** |
| Phase 3 | |
| Breakpoint2 (year) [95% CI] | 20.90 [16.93, 24.84] |
| Slope 3 [95% CI] | 0.0017 [-0.0073, 0.0106] |
| Percentage change per year † [95% CI] | 0.17% [-0.72, 1.05] |
| Phase | Internal cohort | External cohort |
|---|---|---|
| Phase 1: 0-4.2 years from diagnosis | ||
| Estimated HOMA-β (%) level at diagnosis § [95% CI] | 62.7 [55.2, 71.2] | 56.7 [44.3, 68.8] |
| Number of individuals/observations | 177/403 | 62/142 |
| Slope 1[95% CI] | 0.0402[-0.00837, 0.0888] *** | 0.1109[0.0082, 0.2136] * |
| Percentage change per year † [95% CI] | 3.94[-0.01, 8.49] *** | 11.73[0.82, 23.89] * |
| Phase 2: 4.3-20.9 years from diagnosis | ||
| Number of individuals/observations | 688/2081 | 117/411 |
| Slope 2[95% CI] | -0.0398[-0.0492, -0.0304] *** | -0.0291[-0.0520, -0.0059] * |
| Percentage change per year † [95% CI] | -4.06[-5.04, -3.09] *** | -2.87[-5.07, -0.59] * |
| Phase 3: 21.0-50.0 years from diagnosis | ||
| Number of individuals/observations | 272/832 | 58/152 |
| Slope 3[95% CI] | -0.0008[-0.0122, 0.0106] | -0.0030 [-0.0061, 0.0001] |
| Percentage change per year † [95% CI] | -0.08[-1.22, 1.05] | -0.03[-0.06, 0.01] |
| Variable | Group 1 (n=1433) | Group 2 (n=1465) | p value |
|---|---|---|---|
| FCP, pmol/L | 1082.4 (819.2, 1418.6) | 682.7 (506.2, 905.8) | 0.000*** |
| HOMA-β, % | 96.50 (73.70, 137.00) | 36.23 (26.05, 46.53) | 0.000*** |
| Age, year | 61.0 (51.0, 70.0) | 58.0 (49.0, 68.0) | 0.000*** |
| Age of diagnosis, year | 49.3 (41.3, 57.7) | 47.3 (39.2, 55.6) | 0.000*** |
| Duration, year | 8.4 (2.6, 15.8) | 8.2 (2.5, 15.7) | 0.735 |
| Male, n (%) | 796 (55.4) | 818 (55.8) | 0.876 |
| BMI, kg/m2 | 25.7 (23.4, 27.8) | 24.5 (22.6, 26.8) | 0.000*** |
| HbA1c, % | 7.2 (6.4, 8.6) | 8.7 (7.4, 10.4) | 0.000*** |
| HbA1c, mmol/mol | 55.2 (46.4, 70.5) | 71.6 (57.4, 90.2) | 0.000*** |
| SBP, mmHg | 130.0(125.0,139.0) | 130.0(125.0,138.0) | 0.541 |
| DBP, mmHg | 78.0(73.0, 84.0) | 78.0(74.0,85.0) | 0.141 |
| Smoking, n (%) | 281(19.6) | 292 (19.9) | 0.827 |
| Drinking, n (%) | 144 (10.0) | 148 (10.1) | 0.962 |
| LDL-c, mmol/L | 2.85 (2.20, 3.52) | 2.57 (1.96, 3.37) | 0.000*** |
| TG, mmol/L | 1.55 (1.09, 2.33) | 1.50 (1.04, 2.35) | 0.196 |
| UA, mmol/L | 320.0 (262.0, 386.3) | 294.0 (240.0, 358.8) | 0.000*** |
| Diabetic retinopathy, n (%) | 208 (14.6) | 281 (19.2) | 0.001** |
| Diabetic nephropathy, n (%) | 305 (21.3) | 286 (19.5) | 0.239 |
| Diabetic neuropathy, n (%) | 1080 (75.5) | 1206 (82.5) | 0.000*** |
| Insulin, n (%) | 405 (28.3) | 518 (35.4) | 0.000*** |
| Metformin, n (%) | 960 (70.0) | 1010 (68.9) | 0.290 |
| Sulfonylureas, n (%) | 301 (21.0) | 250 (17.1) | 0.063 |
| TZDs, n (%) | 106 (7.4) | 85 (5.8) | 0.135 |
| α-glucosidase inhibitors, n (%) | 1050 (73.3) | 1036 (70.7) | 0.142 |
| SGLT-2 inhibitors, n (%) | 581 (40.5) | 520 (35.5) | 0.078 |
| GLP-1 Ras, n (%) | 216 (15.1) | 181 (12.4) | 0.089 |
| DPP-4 inhibitors, n (%) | 286 (20.0) | 262 (17.9) | 0.115 |
| MetS, n (%) | 1024 (71.5) | 920 (62.8) | 0.000*** |
| Variable | OR | 95% CI | p value |
|---|---|---|---|
| Age, year | 0.987 | 0.967-1.009 | 0.241 |
| Age of diagnosis, year | 1.012 | 0.989-1.036 | 0.317 |
| BMI, kg/m2 | 1.103 | 1.047-1.161 | 0.000*** |
| HbA1c, mmol/mol | 0.695 | 0.627-0.771 | 0.000*** |
| LDL-C, mmol/L | 0.891 | 0.735-1.079 | 0.238 |
| UA, mmol/L | 1.003 | 1.001-1.005 | 0.015* |
| Diabetic retinopathy | 0.997 | 0.648-1.513 | 0.989 |
| Diabetic neuropathy | 0.693 | 0.429-1.119 | 0.134 |
| Insulin use | 0.929 | 0.623-1.386 | 0.719 |
| MetS | 1.526 | 1.021-2.279 | 0.039* |
| Variable | HOMA-β | |
|---|---|---|
| β [95% CI] | p value | |
| Duration, year | -0.0874 [-0.1459, 0.0291] | 0.003** |
| Male | -0.0320 [-0.2393, 0.1753] | 0.762 |
| Age of diagnosis, year | -0.0029 [-0.0121, 0.0064] | 0.546 |
| BMI (kg/m2)>25.0 | -0.0036 [-0.2372, 0.2302] | 0.976 |
| HbA1c, mmol/mol | -0.0648 [-0.1227, -0.0068] | 0.028* |
| UA, mmol/L | 0.0003 [-0.0007, 0.0012] | 0.591 |
| Insulin use | -0.0016 [-0.3203, 0.2878] | 0.916 |
| MetS | -0.1638 [-0.4560, 0.1284] | 0.271 |
| Duration: Male | 0.0012 [-0.0142, 0.0166] | 0.880 |
| Duration: Age of diagnosis | 0.0009 [0.0002, 0.0016] | 0.012* |
| Duration: BMI | -0.0063[-0.0237, 0.0111] | 0.477 |
| Duration: HbA1c | 0.0013[-0.0029, 0.0056] | 0.539 |
| Duration: UA | 0.0001 [-0.0001, 0.0001] | 0.620 |
| Duration: Insulin use | 0.0079 [-0.153, -0.0312] | 0.503 |
| Duration: MetS | 0.0179 [-0.0046, 0.0404] | 0.119 |
Peer Reviews
No public reviews on file for this paper yet. If you reviewed it on a platform where reviews are public (OpenReview, ICLR, NeurIPS, ICML), you can paste yours below so the community can read it here.
Videos
No videos yet. Explain this paper in a talk, walkthrough, or lecture? Add one.
Taxonomy
TopicsPancreatic function and diabetes · Diabetes and associated disorders · Diabetes Management and Research
Introduction
1
Type 2 diabetes mellitus is characterized by insulin resistance and a progressive loss of islet beta-cell function (1). Although both factors contributed to the pathogenesis, decreased beta-cell function and beta-cell mass are the predominant factors of disease progression, and are the typical hallmark of the overt-diabetes (1). In fact, studies including the United Kingdom Prospective Diabetes Study (UKPDS) (2) have revealed that despite its latent nature, beta-cell function impairment was indeed an early event in the course of the disease. As such, only 50% of beta-cell function remained at diagnosis and continued declining at a rate of 5% annually (2). Moreover, the impaired beta-cell function is closely related to oral treatment failure, blood glucose fluctuation, microvascular or macrovascular complication, and an increased mortality (3–6). Therefore, protecting beta-cell function is an essential goal in the prevention and treatment of type 2 diabetes (7).
A comprehensive understanding of the natural history of type 2 diabetes, especially the trajectory of beta-cell function change, would provide a significant theoretical basis for preventing and treating the disease. Some studies have explored this issue and reported that rates of beta-cell decline varied (2, 8–11). However, most of these studies focused on Western populations and were virtually small-sample, short follow-up observations with highly selected subjects. Furthermore, none of these studies revealed the continuous long-term pattern of beta-cell function change. Besides, the prevalence of type 2 diabetes in China has increased over 10-fold in the past 40 years, which now has the largest type 2 diabetes population in the world (12). Therefore, data from the Chinese type 2 diabetes populations would provide significant support.
To address these gaps, this study recruited 2898 Chinese type 2 diabetes patients and detected their beta-cell function change trajectory over 50 years. The relevant influencing factors were also analyzed. Thus, this study would help further clarify the model of beta-cell function change, identifying optimal intervention timing and targets.
Materials and methods
2
Subjects
2.1
Cross-sectional cohort
2.1.1
This study was conducted in accordance with the guidelines of the Declaration of Helsinki (as revised in 2008). All patients provided informed consent to participate in the study. The study protocol was approved by the Research Ethics Committee of the Second Affiliated Hospital of Zhengzhou University (No. KY2024134). We retrospectively analyzed data from 6072 subjects with diabetes who received treatment in the Department of Endocrinology, Second Affiliated Hospital of Zhengzhou University, from June 2018 to August 2024. Participants were enrolled if they fulfilled the following criteria: (a) diabetes diagnosed according to the 1999 World Health Organization (WHO) criteria (13); (b) clinically classified as type 2 diabetes; (c) testing negative for diabetes-associated autoantibodies, namely glutamic acid decarboxylase antibody (GADA), islet cell antibody (ICA), and insulin autoantibody (IAA) (for patients with a history of insulin use, IAA was not included in the analysis). Exclusion criteria included: (a) classification as type 1 diabetes mellitus [defined as an acute-onset, insulin-dependent disease at diagnosis caused by beta-cell destruction, according to guidelines from WHO (13) and the American Diabetes Association (ADA) (14)], gestational diabetes, or other special types of diabetes; (b) pregnancy or lactation; (c) receipt of hormone therapy or chemotherapy; (d) comorbidity with renal insufficiency [since blood C-peptide levels in patients with renal function impairment are artificially elevated (15)] or malignant disease. A total of 4995 patients met the above criteria. Subjects lacking measurements of fasting C-peptide (FCP), fasting plasma glucose (FPG), disease duration, or other relevant data were excluded. Finally, 2,898 subjects were included in the cross-sectional analysis (Figure 1).
Flow-chart for enrollment.
Longitudinal cohort
2.1.2
We tested the findings in the cross-sectional cohort by analyzing changes over time in HOMA-β using repeat samples from individuals. The repeated samples were recruited from our own cohort and an external cohort from the same geographic region (Zhengzhou City, China). Both cohorts used the same inclusion and exclusion criteria for T2DM.
In our own cohort, repeat HOMA-β measurements were available for 1213 subjects from the 2898 individuals in the cross-sectional cohort. After excluding subjects whose HOMA-β measurement time points fell into different stage intervals (referring to the three stages described in the ‘Results’ section), a total of 3316 HOMA-β values from 1137 patients were included in the final analysis. A median (IQR) of 2 (2, 3) results were available per subject, over a median (IQR) of 3.5 (1.8, 5.9) years of follow-up.
The external data come from a prospective cohort based at the National Metabolic Management Center (MMC) (16) sub-center established by the Fifth Affiliated Hospital of Zhengzhou University. This study was approved by the Ethics Committee of the Fifth Affiliated Hospital of Zhengzhou University (No. KY20211019), and all patients signed the informed consent form for enrollment. A total of 705 HOMA-β measurements from 237 patients were included in the analysis. A median (IQR) of 2 (2, 3) results were available per patient, over a median (IQR) of 9.2 (3.3, 25.2) months of follow-up.
The following information was collected at each visit: disease duration, BMI, systolic blood pressure (SBP), and diastolic blood pressure (DBP). Moreover, serum was collected for measurements of plasma glucose, HbA1c, C-peptide, triglycerides (TG), low-density lipoprotein cholesterol (LDL-C), uric acid (UA), and diabetes-associated autoantibodies.
Laboratory analysis
2.2
Height, weight, and blood pressure were measured with a standardized procedure, and BMI was calculated. Levels of FPG, TG, LDL-C, and UA were determined using the automatic chemistry system at the core laboratory of the Second Affiliated Hospital of Zhengzhou University. HbA1c was measured using high-performance automated liquid chromatography (HLC-723G8, Tosoh, Japan). GADA and ICA were qualitatively detected using a standard immunoblot kit (BLOT, Shenzhen, China). Plasma C-peptide was tested using the electrochemical luminescence method (cobas-E411, Basel, Switzerland). Furthermore, the inter-assay and intra-assay variation coefficients were 3.7–4.1% and 1.0–3.3%, respectively. The lower detection limit of the assay was 16.7 pmol/L.
Fasting plasma glucose (FPG) and fasting C-peptide (FCP) were tested in patients fasting for at least 8 hours. HOMA-β was calculated using the following formula: HOMA-β (%) =0.27×FCP (pmol/L)/[FPG (mmol/L)-3.5] (17).
Metabolic Syndrome (MetS) was defined using the 2017 Chinese Diabetes Society’s (CDS) criteria (18) and was diagnosed when three or more of the following criteria were met: (a) abdominal obesity: waist circumference ≥90 cm in men and ≥85 cm in women; (b) hyperglycemia: FBS ≥6.1 mmol/L or 2-hour PBS ≥7.8 mmol/L or previously diagnosed diabetes with treatment; (c) hypertension: blood pressure ≥130/85 mmHg or currently under antihypertension therapy; (d) fasting TG ≥1.70 mmol/L; (e) fasting HDL-C<1.04 mmol/L.
Statistical analysis
2.3
HOMA-β results were natural log transformed for analysis as the distribution of its values was heavily skewed. Initial analysis of cross-sectional data used non-linear regression modeling to examine the association between duration and HOMA-β. Generalized additive models (GAM) were used to explore the initial shape of the associations. Notably, this revealed a pattern consistent with three phases that could be modeled with three lines of best fit. Segmented regression was then used to determine the optimal breakpoints where the lines of best fit would meet and to enable calculation of the intercept and slopes of different phases, thereby modeling the starting point and rate of HOMA-β decline. The intercepts were back-transformed (using the exponential) to estimate HOMA-β levels at diagnosis from the models. As slopes were on a log scale, they were interpreted as percentage change per year (calculated from the exponential of the β coefficient minus 1).
For the longitudinal analysis, data were split into three groups for the three phases: before and after the optimal breakpoints identified from cross-sectional analysis. The slopes of the three phases were determined using mixed effects models to model HOMA-β against duration, with random effects at the patient level to allow each patient to contribute multiple values at different time points. We used a random-intercept, random-slope model to allow for variability between individuals. Moreover, we excluded those whose first value was below the lower limit of detection of the assay to ensure the finding did not represent a floor effect (i.e., that the results were not an artifact of those below the lower limit of the assay unable to fall).
We further explored clinical indicators related to residual HOMA-β levels using cross-sectional data. Based on longitudinal data, we incorporated the duration of diabetes as a continuous time-varying covariate in the mixed effect model. We explored significant associations (statistical interactions) between determinants of interest and duration of diabetes on HOMA-β levels.
All analyses were carried out in SPSS version 24.0 or R version 3.2.2, including the mgcv package (for generalized additive models), lme4 package (for mixed effects models), and segmented package (for segmented regression). Normally distributed data were presented as mean ± SD. Variables with a skewed distribution were reported as median (quartile range: 25th, 75th). Categorical variables were expressed as percentages. Normally distributed data were compared using ANOVA, and non-normally distributed data were compared using the Wilcoxon Rank Sum and Spearman correlation test. Categorical variables were compared using a chi-squared test. Furthermore, we performed univariate analyses to compare clinical features in subjects with different levels of residual beta-cell function. Multivariate logistic regression analyses were performed to further investigate the possible determinants of beta-cell function preservation. Two-sided statistical tests were performed, and a p-value <0.05 (two-sided) was considered statistically significant.
Results
3
Baseline clinical features
3.1
Clinical and biochemical characteristics of the 2898 patients in cross-sectional analysis are presented in Table 1. At baseline, the mean age was 60.0 years old (ranging from 12.0 to 94.0), and 55.7% were male. The mean age of diagnosis was 48.4 years old (ranging from 7.1 to 86.5), and the mean disease duration was 8.4 years (ranging from 0.1 to 50.0). The average BMI (IQR) level was 25.0 (23.0, 27.4) kg/m^2^, meeting the diagnostic criteria for overweight in China (19). The average HbA1c (IQR) level was 61.7 (50.8, 81.4) mmol/mol. Moreover, the subjects’ blood pressure, glucose, and lipids levels did not meet the strict control targets, and almost 80% of the subjects combined at least one type of diabetic microvascular or neurological complications.
Cross-sectional analysis identified multi-phases of beta-cell function change
3.2
We used GAM to investigate the changing pattern of HOMA-β with the course of the disease. HOMA-β was found to have a nonlinear association with the disease duration, suggesting three phases. As shown in Figure 2, the first phase lay within about 4 years from diagnosis, during which the curve rose slightly. This was followed by a second phase up until around 21 years after diagnosis, during which the curve declined significantly, and the HOMA-β level experienced a substantial reduction. Then, it progressed to the third phase, where the curve flattened, indicating a continuous low level of HOMA-β.
Scatterplots of ln (HOMA-β) against duration of diabetes in 2898 individuals with type 2 diabetes. The blue line shows generalized additive modelling (non-linear) line of best fit.
Segmented regression was used to model the slopes of different phases. The estimated HOMA-β level at diagnosis was 63.4% (95%CI: 61.4, 65.4). The breakpoints at which the slope changed were modeled at 4.20 (95%CI: 2.31, 6.09) years and 20.90 (95%CI: 16.93, 24.84) years from diagnosis. During the first stage, the annual change of HOMA-β was 3.34% (95% CI: 0.04, 6.52), suggesting that beta-cell function would experience a brief ‘ascending phase’ after clinical diagnosis. During the second stage, the HOMA-β decayed at -3.04% (95% CI: -3.78, -2.29) per year, forming the main ‘decline phase’ of beta-cell function. Then, during the third stage, the annual change for HOMA-β descended to 0.17% (95% CI: -0.72, 1.05) per year, suggesting a ‘plateau phase’ thereafter. Figure 3 shows the fitted slopes and Table 2 shows the estimated parameters during the three phases.
Scatterplots of ln (HOMA-β) against duration of diabetes in 2898 individuals with type 2 diabetes. The blue line shows three straight lines of best fit meeting at the optimal breakpoint from segmented regression analysis.
Longitudinal data validated the multi-phases in the cross-sectional model
3.3
The cross-sectional model was verified using longitudinal data from both internal and external cohorts. In line with the estimated inflection breakpoints, we calculated the slopes of each phase in the HOMA-β curve with the course of the disease using the longitudinal data. The numbers of individuals, observations, and the estimated slopes at distinct phases are presented in Table 3. The decline pattern of HOMA-β was similar to that seen in the cross-sectional model. It consisted of an initial ‘ascending stage,’ followed by a ‘decline stage’ with substantial fall, and then a continuous ‘plateau stage’.
Factors associated with residual beta-cell function
3.4
The 2898 subjects in the cross-sectional analysis were grouped according to their residual HOMA-β levels. Subjects with their HOMA-β points above the GAM model fitting curve (Figure 1) were considered to have ‘preferable residual beta-cell function’ and classified into ‘Group 1’. In contrast, others having ‘inferior beta-cell function’ were assigned to ‘Group 2’.
Univariate analysis showed that compared to Group 2, age (61.0 vs. 58.0 years, p<0.001), age of diagnosis (49.3 vs. 47.3 years, p<0.001), BMI (25.7 vs. 24.5 kg/m², p<0.001), levels of LDL-C (2.85 vs. 2.57 mmol/L, p<0.001), UA (320.0 vs. 294.0 mmol/L, p<0.001) and proportion of MetS (71.5% vs. 62.8%, p<0.001) were higher in Group 1. In comparison, the HbA1c level (55.2 vs.71.6 mmol/mol, p<0.001) and proportion of insulin use (28.3% vs. 35.4%) were lower in Group 1. Notably, the proportions of diabetic retinopathy (19.2% vs. 14.6%), diabetic neuropathy (82.5% vs. 75.5%) and in Group 1 were significantly higher than those in Group 2 (Table 4).
Further multivariate analyses showed that higher BMI levels (OR = 1.103, [95%CI 1.048, 1.161], p<0.001), UA levels (OR = 1.003, [95%CI 1.001, 1.005], p=0.014), MetS (OR = 1.526, [95%CI 1.021, 2.279], p=0.039) and lower HbA1c levels (OR = 0.696, [95%CI 0.628, 0.771], p<0.001) were independently associated with higher residual HOMA-β level (Table 5).
Factors associated with beta-cell function decline rate
3.5
We focused on the second stage in the above models, which was the main ‘decline phase’ of HOMA-β. Using longitudinal follow-up data, the mixed effect linear model showed that HOMA-β levels decreased with increased disease duration and HbA1c levels. Notably, the age of diagnosis was associated with HOMA-β decline rate since there was a significant interaction (Coefficient=0.0009 [95%CI: 0.0002, 0.0016]) between age of diagnosis and disease duration on HOMA-β levels over time. This suggests that the earlier the disease diagnosis, the faster the rate at which HOMA-β declines with the disease course (Table 6).
Discussion
4
The “three-phase HOMA-β model” is clinically relevant and highly consistent with previous literature. Firstly, the “ascending phase” usually emerges after short-term interventions (such as intensive insulin therapy, oral medications, or lifestyle interventions), accompanied by increased insulin secretion and improved glycemic control. This so-called “clinical remission period” (9, 20–22) is equivalent to the first stage in this study. Secondly, the following ‘decline phase’ was also witnessed. The well-known UKPDS reported a decline rate of 5% per year in British type 2 diabetic patients (2), while in Chinese populations, this figure was 2% (11). Different genetic backgrounds, intervention programs may contribute to the varied decline rates. Thirdly, as for the ‘plateau phase,’ the Veterans Affairs Diabetes Trial (VADT) showed that the C-peptide levels decreased progressively from 0–3 years after diagnosis until 15 years’ duration and then remained stable after 16–18 years, suggesting that beta-cell function loss would tend to stabilize at a certain point (10).
Moreover, the continues change pattern was also observed. The Belfast Diet Study (8) used HOMA-β to explore changes in beta-cell function in type 2 diabetic patients and found an initial slow decline (1.7% decline per year) period followed by a rapid decline (18.2% decline per year). Unfortunately, the follow-up was terminated before the 10th year post-diagnosis, so no further changes thereafter were observed. More consistent results came from another Chinese study (23). Ding et al. followed 1570 type 2 diabetic subjects for up to 35 years. They found that beta-cell function remained unchanged within 5 years after diagnosis, declined by 2% annually between 5 and 22 years, and remained at a low level thereafter (23). Despite the detailed differences, the above results are consistent with this study.
As for the potential underlying pathophysiological mechanisms, each phase needs to be discussed separately. The beta-cell function decline in type 2 diabetes broadly resulted from beta-cell number reduction, beta-cell exhaustion, and beta-cell de-differentiation or trans-differentiation into other cell types (24), all closely related to glucotoxicity/lip-toxicity (25). Apart from beta-cell number reductions, which are difficult to reverse, the other two processes can be reversed after removing glucotoxicity/lip-toxicity (24).
In this model, the first ‘ascending phase’ may result from the glucose and lipid-lowering therapy initiated after diagnosis which improved the underlying pathophysiological conditions and restored beta-cell function. Therefore, early screening and treatment should be conducted to seize the time window for beta-cell protection (26) (Figure 4). The following ‘decline phase’ was described by A. Bagust as the ‘fully developed stage of type 2 diabetes’, which was characterized by a significant irreversible decline of beta-cell function (8). Its relevant pathophysiological processes may include accelerated beta-cell apoptosis, rapid beta-cell exhaustion, and irreversible beta-cell dedifferentiation (8) (Figure 4). Moreover, the Counterpoint Study (27) and The Scandinavian Obesity Study (28) confirmed that as the duration of diabetes increases, an irreversible ‘turning point’ would be passed with beta-cells underwent irreversible damage. Regarding this ‘turning point’, B. TOPP et al. put forward a hypothesis (29):a regulation system would attempt to maintain the insulin secretion level by reducing beta-cell loss and/or increasing beta-cell replication at the early stage of the disease. However, the regulatory ability gradually weakens and eventually reaches an unstable saddle point at which even a modest event (such as an infection or an over-indulgence) would propel the subject into the subsequent phase of sudden accelerated disease progression. During the last ‘plateau phase’, patients tend to have persistently low levels of beta-cell function, resulting in failed oral drug treatment, drastic blood sugar fluctuation, and multiple complications (3–6). Insulin therapy often needs to be initiated at this stage (Figure 4).
Potential underlying pathophysiological mechanisms and clinical features of the ‘three-phase model’.
We further analyzed clinical factors associated with residual beta-cell function. Univariate analysis showed inverse correlations of diabetic retinopathy and diabetic neuropathy, which was consistent with previous reports (6). After adjusting for multiple variables, higher BMI, UA and MetS proportion levels were still correlated with higher residual HOMA-β level. The positive correlations were particularly significant among overweight or obese subjects (30, 31). Notably, this did not mean MetS is beneficial to beta-cell preservation, since free fatty acids, UA, and related inflammation could cause insulin resistance and a compensatory increase in insulin secretion, which would ultimately damage beta-cell function (32, 33). In this study, the average BMI level was 25.0 kg/m², reaching the criteria of overweight for Chinese (16). Therefore, fat loss and muscle building should be conducted in this group of people (34). The elevated HbA1c and reduced beta-cell function were thought to be causally related: the glucotoxicity may damage beta-cell function (24) while correspondingly, the decreased insulin level would cause an increased blood glucose level (5). Therefore, active blood glucose control can break this vicious cycle and prevent disease progression.
We also observed that insulin use was related to lower residual HOMA-β levels. However, prior studies demonstrated that early insulin intervention preserves beta-cell function (35). This suggests that insulin treatment would be initiated belatedly in our patients, potentially missing the optimal window for beta-cell protection. Thus, in clinical practice, adequate attention should be paid to beta-cell function protection. Timely use of agents with potential β-cell-protective effects [e.g., GLP-1Ras (36), SGLT-2 inhibitors (37), DPP-4 inhibitors (38)] is advisable.
Moreover, we found that early disease onset was associated with faster beta-cell function decline. Similar results have been reported in the ‘Restoring Insulin Secretion (RISE) Study’ and ‘Treatment Options for Type 2 Diabetes in Adolescents and Youth (TODAY) Study’ (39, 40). This arises from both genetic and environmental factors. A genome-wide association study (GWAS) by the Progress in Diabetes Genetics in Youth Consortium (ProDiGY) (41) highlighted the key role of genetic background. In contrast, socio-environmental factors—such as later bedtimes (42) and fewer medical visits (43)—may reduce residual beta-cell function. Unfortunately, the incidence and prevalence of early-onset type 2 diabetes (in those aged ≤40 years) are rising globally (1). Thus, early combination therapy is recommended for young adults (<40 years) with type 2 diabetes (44).
The strengths of our study are as follows. First, we had a large sample size of 2892 subjects and a prolonged disease course coverage of 50 years. This ensured the statistical power and enabled long-term continuous observation. Second, the diabetic-associated antibodies including IAA, GADA and ICA, were detected to exclude autoimmune diabetes such as LADA (45). This largely reduces the heterogeneity of the cohort. Third, this study combined cross-sectional and longitudinal data from multi-centers, which enhanced the reliability of the conclusions.
The limitations of our study are as follows. First, although the results are consistent with previous studies, it must be noted that the ‘three-phase HOMA-β model’ is still largely based on statistical analysis of a single Chinese Han population. The turning points and change rates within each phase may vary among different populations. Also, variability in treatment regimens, survivor bias, or misclassification of disease onset might affect the existence of multi-phases. Therefore, multi-center, large-sample prospective studies across diverse ethnic groups should be conducted in the future, and the underlying pathophysiological mechanisms also require further investigations. Second, despite the strict control over the inclusion and exclusion criteria, it is still possible that some LADA and classic T1DM patients were included, which increases the heterogeneity of the cohort. Third, this study used HOMA-β to evaluate beta-cell function, which reflected basal insulin secretion (46) but failed to capture the dynamic changes in insulin response. We will strive to adopt OGTT-derived indices in future studies to more comprehensively reflect beta-cell function.
In conclusion, this study revealed the complex model of beta-cell function change in type 2 diabetes. Based on this model, the pathophysiological mechanisms underlying different phases would be investigated and targeted clinical interventions could be implemented in the specific population.
The reference list from the paper itself. Each links out to its DOI / PubMed record.
- 1Ahmad E Lim S Lamptey R Webb DR Davies MJ. Type 2 diabetes. Lancet. (2022) 400:1803–20. doi: 10.1016/S 0140-6736(22)01655-5, PMID: 36332637 · doi ↗ · pubmed ↗
- 2Wright A Burden AC Paisey RB Cull CA Holman RR. Sulfonylurea inadequacy: efficacy of addition of insulin over 6 years in patients with type 2 diabetes in the U.K. Prospective Diabetes Study (UKPDS 57). Diabetes Care. (2002) 25:330–6. doi: 10.2337/diacare.25.2.330, PMID: 11815505 · doi ↗ · pubmed ↗
- 3Gedebjerg A Bjerre M Kjaergaard AD Nielsen JS Rungby J Brandslund I. CRP, C-peptide, and risk of first-time cardiovascular events and mortality in early type 2 diabetes: A Danish cohort study. Diabetes Care. (2023) 46:1037–45. doi: 10.2337/dc 22-1353, PMID: 36930691 · doi ↗ · pubmed ↗
- 4Aziz F Sternad C Sourij C Knoll L Kojzar H Schranz A. Glycated hemoglobin, HOMA 2-B, C-peptide to glucose ratio and type 2 diabetes clusters as predictors for therapy failure in individuals with type 2 diabetes without insulin therapy: A registry analysis. Diabetes Obes Metab. (2024) 26:1082–9. doi: 10.1111/dom.15409, PMID: 38151754 · doi ↗ · pubmed ↗
- 5Unger RH Grundy S. Hyperglycemia as an inducer as well as a consequence of impaired islet cell function and insulin resistance: implications for the management of diabetes. Diabetologia. (1985) 28:119–21. doi: 10.1007/bf 00273856, PMID: 3888754 · doi ↗ · pubmed ↗
- 6Bo S Cavallo-Perin P Gentile L Repetti E Pagano G. Relationship of residual beta-cell function, metabolic control and chronic complications in type 2 diabetes mellitus. Acta Diabetol. (2000) 37:125–9. doi: 10.1007/s 005920070014, PMID: 11277312 · doi ↗ · pubmed ↗
- 7Zhu J Han J Liu L Liu L Liu Y Xu W. Clinical expert consensus on the assessment and protection of pancreatic islet β-cell function in type 2 diabetes mellitus. Diabetes Res Clin Pract. (2023) 197:110568. doi: 10.1016/j.diabres.2023.110568, PMID: 36738836 · doi ↗ · pubmed ↗
- 8Bagust A Beale S. Deteriorating beta-cell function in type 2 diabetes: a long-term model. QJM. (2003) 96:281–8. doi: 10.1093/qjmed/hcg 040, PMID: 12651972 · doi ↗ · pubmed ↗