Expression of long noncoding RNAs in peripheral blood mononuclear cells of patients with type 1 diabetes mellitus: potential biomarkers for disease onset
Cristine Dieter, Natália Emerim Lemos, Eliandra Girardi, Eloisa Toscan Massignam, Thayne Woycinck Kowalski, Mariana Recamonde-Mendoza, Márcia Puñales, Taís Silveira Assmann, Daisy Crispim

TL;DR
This study explores how certain long non-coding RNAs behave in blood cells of type 1 diabetes patients, suggesting they could be early disease markers.
Contribution
The study identifies specific lncRNAs (MALAT1, MEG3, TUG1) as potential biomarkers for early T1DM diagnosis.
Findings
MALAT1 and TUG1 are upregulated in T1DM patients within the first five years of diagnosis.
MEG3 is upregulated in newly diagnosed T1DM patients compared to controls.
TUG1 and MEG3 correlate with glycated hemoglobin levels, suggesting a link to disease severity.
Abstract
Long non-coding RNAs (lncRNAs) do not encode proteins and are transcripts longer than 200 nucleotides. The precise involvement of lncRNAs in type 1 diabetes mellitus (T1DM) pathogenesis remains unclear. Therefore, this study aimed to analyze the expressions of five lncRNAs in peripheral blood mononuclear cells of individuals with T1DM and without DM. This study comprised 27 patients with T1DM (cases) and 13 individuals without DM (controls). The case group was divided into two subgroups based on T1DM duration: < 5 years of diagnosis group and long-term diabetes group (≥5 years). LncRNA expression was evaluated by qPCR. MALAT1 and TUG1 were upregulated in patients within the first five years of diagnosis of T1DM compared to the other groups. MEG3 was upregulated in the case group of < 5 years of diagnosis compared to controls. TUG1 and MALAT1 levels were negatively correlated with the…
Genes, proteins, chemicals, diseases, species, mutations and cell lines named across the full text — each resolved to its canonical identifier and authoritative record.
Click any figure to enlarge with its caption.
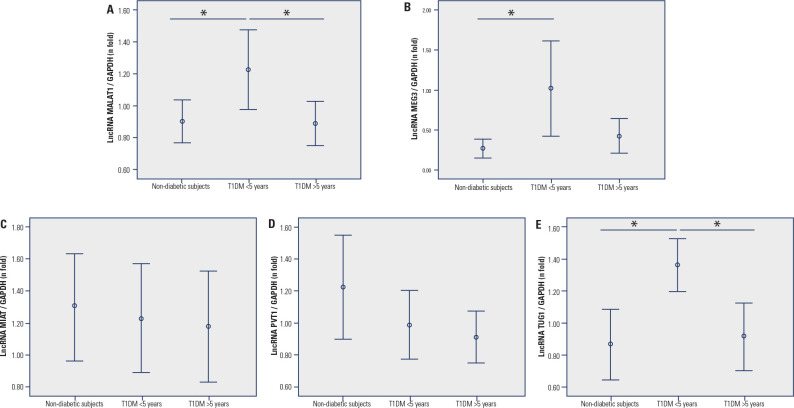 Figure 1
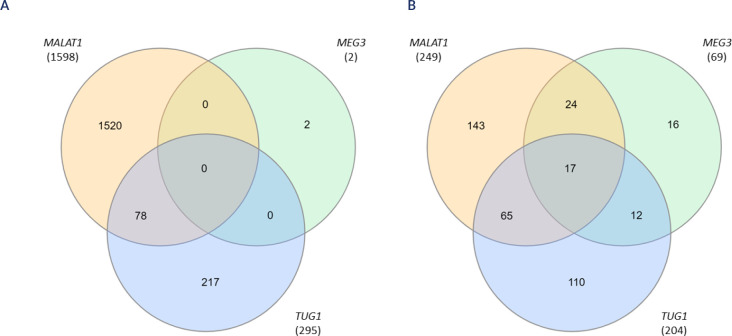 Figure 2
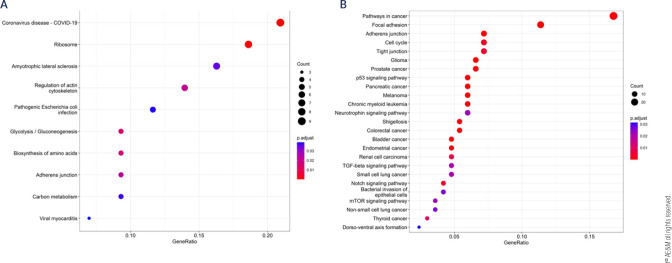 Figure 3
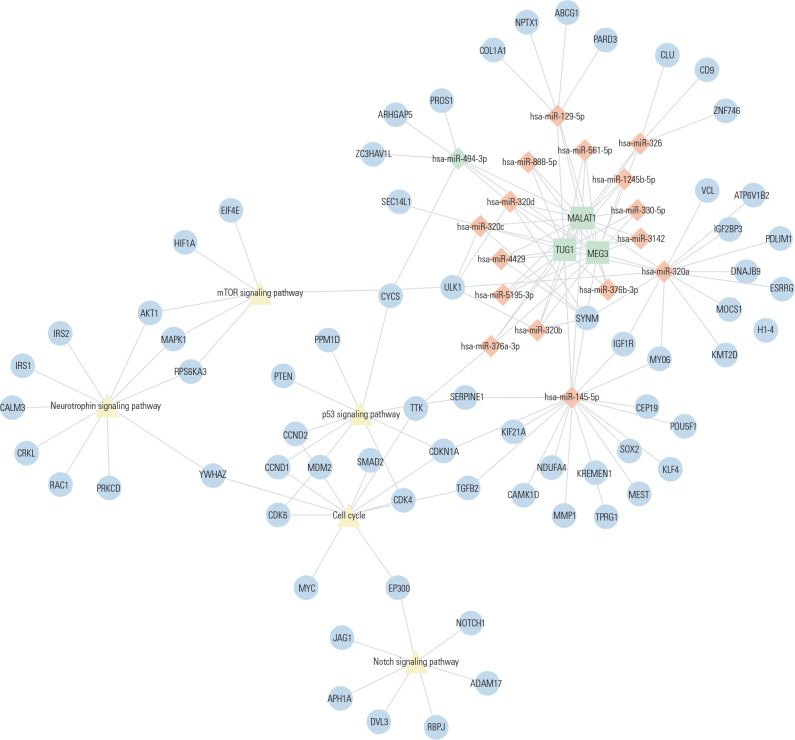 Figure 4
| Characteristic | Individuals without DM | T1DM < 5 years | T1DM ≥ 5 years | P |
|---|---|---|---|---|
| Age (years) | 41.2 ± 13.8a | 21.0 ± 4.3b | 34.6 ± 10.8a | <0.0001 |
| Gender (% male) | 38.5 | 57.1 | 30.8 | 0.358 |
| Ethnicity (% black) | 15.4 | 7.1 | 7.7 | 0.732 |
| BMI (kg/m2) | 27.1 ± 4.9 | 23.6 ± 2.3 | 26.1 ± 4.2 | 0.074 |
| HbA1c (%) | 5.2 ± 0.3a | 9.6 ± 2.4b | 8.9 ± 1.5b | <0.0001 |
| Hypertension (%) | - | 0.0 | 15.4 | 0.078 |
| Age at T1DM diagnosis (years) | - | 18.2 ± 4.1 | 15.3 ± 9.0 | 0.288 |
| Duration of T1DM (years) | - | 3.0 ± 1.2 | 19.3 ± 9.3 | <0.0001 |
- —FIPE
- —Fapergs
Peer Reviews
No public reviews on file for this paper yet. If you reviewed it on a platform where reviews are public (OpenReview, ICLR, NeurIPS, ICML), you can paste yours below so the community can read it here.
Videos
No videos yet. Explain this paper in a talk, walkthrough, or lecture? Add one.
Taxonomy
TopicsCancer-related molecular mechanisms research · Lipid metabolism and disorders
INTRODUCTION
Type 1 diabetes mellitus (T1DM) is a metabolic disease caused by the autoimmune destruction of pancreatic beta-cells, which leads to exogenous insulin dependence in patients with this disease (^1,2^). T1DM accounts for 10%-15% of all diabetes cases and can occur in people at any age, although it typically develops in children and young adults (^1^). The autoimmunity against beta-cells is triggered by a complex interaction between genetic, epigenetic, and environmental factors (^1,2^).
Epigenetic factors are heritable modifications in gene expression that do not change the nucleotide sequence of DNA (^3^). The main epigenetic mechanisms are DNA methylation, posttranslational modifications of histones, and gene expression regulation by non-coding RNAs (ncRNAs) (^4^). NcRNAs can regulate gene expression by various mechanisms, such as repressing or activating transcription, modifying chromatin structure, and post-transcriptional regulation (^5,6^). NncRNAs can generally be classified into short (<200 nucleotides) and long (>200 nucleotides) types based on their length (^7^). Long non-coding RNAs (lncRNAs) can participate in numerous gene regulatory activities, such as transcription, splicing, protein degradation, and chromatin modifications, thereby modifying chromatin states and influencing gene expression (^8,9^). They also have a key role in regulating the expression of microRNAs (miRNAs), which are short ncRNAs that regulate gene expression (^10^).
Several studies have reported that numerous lncRNAs contribute to inflammation, apoptosis, insulin secretion, and autoimmune dysfunction in both immune cells and beta-cells (^11^-^14^). Yin and cols. (^15^) revealed that silencing the lncRNA TUG1 led to higher beta-cell apoptotic rates, resulting in reduced insulin secretion. Dysregulations in lncRNAs have also been described in pancreatic cells and murine models of diabetes mellitus (DM). The lncRNA Malat1 was upregulated in serum from insulin-resistant C57BL/6J mice compared to control mice (^16^). Knockdown of the lncRNA Pvt1 ameliorated streptozotocin-induced oxidative stress and apoptosis and elevated the insulin secretory capacity of beta-cells (^17^). Moreover, Dieter and cols. (^18^) conducted a systematic review that highlighted six lncRNAs, including MIAT, MALAT1, and MEG3, that were dysregulated in patients with DM (mainly type 2 DM) compared to controls in a number of studies. This systematic review also pointed out the lack of studies focused on lncRNA expressions in individuals with T1DM.
Therefore, we conducted a case-control study to analyze the expressions of six lncRNAs, namely MIAT, MALAT1, MEG3, TUG1, and PVT1 in peripheral blood mononuclear cells (PBMCs) from individuals with and without T1DM. Additionally, we performed bioinformatics analyses to explore the potential targets and biological pathways regulated by the lncRNAs of interest.
MATERIALS AND METHODS
Study population
This study was designed following the STROBE guidelines for performing and reporting observational studies (^19^). The sample comprised 27 patients with T1DM [14 of them had < 5 years of diagnosis and 13 had ≥ 5 years of diagnosis (long-term diabetes group)] and 13 individuals without DM (controls). All T1DM patients were recruited from Hospital de Clínicas de Porto Alegre (HCPA) and Instituto da Criança com Diabetes (ICD) - Grupo Hospitalar Conceição (Rio Grande do Sul, Brazil) between November 2019 and May 2022. T1DM diagnosis followed the American Diabetes Association recommendations (^20^). The exclusion criteria were: a febrile episode within the last months, chronic inflammatory or rheumatic diseases, hepatitis, any active infection, HIV, hereditary dyslipidemia, errors of metabolism (except for DM), or glucocorticoid treatment.
The control group comprised blood donors recruited from the HCPA between November 2019 and May 2022. Only individuals with glycated hemoglobin (HbA1c) ≤ 5.7% were included in this group (^20^). Moreover, individuals who had any active infection, or a family history of diabetes were not included in the control group.
We collected clinical information using a standard questionnaire for the T1DM group. As previously reported, all patients underwent comprehensive physical and laboratory evaluations (^21^). For the control group, we collected data on age, ethnicity, family history of DM or other diseases, and occurrence of other exclusion criteria. Weight and height were measured to calculate body mass index (BMI) and blood samples were collected to measure HbA1c levels. Both case and control subjects self-classified their ethnic group.
The study was approved by the Ethic Committees in Research from HCPA and ICD - Grupo Hospital Conceição, and all subjects signed the written informed consent before their participation in the study (CAAE number: 97779118.4.0000.5327).
RNA extraction and quantification of lncRNA expressions by RT-qPCR
Samples of 4 mL of peripheral blood were collected from individuals with and without T1DM and then 2 mL of blood was mixed with an equal volume of phosphate-buffered saline (Sigma, Missouri, EUA). Total PBMCs were isolated from blood by density gradient centrifugation using the Ficoll-paqueTM plus (GE HealthCare, Uppsala, Sweden) (^22^) and were stored at -80 °C until RNA extraction.
Total RNA was isolated from PBMCs using the PureLink RNA Mini Kit (Thermo Fisher Scientific, Waltham, MA, USA). The NanoDrop ND-1000 Spectrophotometer (Thermo Fisher Scientific) was used to analyze purity and concentration of RNA samples. Only the samples with acceptable purity ratios (A260/A280 = 1.9-2.1) were selected for the following analyses (^23^).
Reverse-transcription real-time quantitative PCR (RT-qPCR) was performed using a two-step protocol. In the first step, the total RNA was reverse transcribed into cDNA using the SuperScript VILO Master Mix IV (Thermo Fisher Scientific) according to the instruction of the manufacturer. In the second step, the cDNA was amplified by qPCR in a ViiA^TM^ 7 Fast Real-Time PCR System (Thermo Fisher Scientific). The qPCR reactions included 0.5 µL of TaqMan Gene Expression Assay (20X) (Thermo Fisher Scientific) for MALAT1 (Hs00273907_s1), MIAT (Hs03300285_g1), MEG3 (Hs00292028_m1), PVT1 (Hs00413039_m1), TUG1 (Hs05579214_s1) or GAPDH (Hs02786624_g1), 5 µL of TaqMan Fast Advanced Master Mix (Thermo Fisher Scientific), 1 µL of cDNA (200 ng/µL for MEG3, 100 ng/µL for MIAT, PVT1, and TUG1 and 25 ng/µL for MALAT1), and sterile water to complete a volume of 10 µL. Each sample was analyzed in triplicate and a negative control was added to each plate. The cycling conditions were as follows: 50 °C for 2 min, 95 °C for 10 min, and 45 cycles of 95 °C for 1s and 60 °C for 20s. The quantification of the lncRNAs of interest was conducted using the 2^-∆∆Cq^ method with the GAPDH as the reference gene, and the results are shown as n-folds in relation to the calibrator sample, which was a pool of all cDNA samples analyzed (^23^).
Bioinformatics analyses
Potential genes targeted by the dysregulated lncRNAs were retrieved from the Encori database (^24^). No restrictions were applied to the type of target, although only protein coding genes identified by two or more studies were included in the subsequent analyses. We also investigated miRNAs regulated by the differently expressed lncRNAs between groups. These data were obtained from the Encori database (^24^) and analyzed via Venn Diagrams. For the common miRNAs regulated by the differently expressed lncRNAs, their target genes were searched via MultimiR package in R (^25^), which is a collection of miRNA/target genes from external resources, including validated and predicted miRNA-target databases (^25^). Although we explored the predicted target genes of miRNAs, we included only targets validated in at least two miRNA databases in our analyses.
Functional overrepresentation analysis of biological processes of the retrieved target genes was performed using KEGG pathways and Gene Ontology (GO) databases, which were incorporated in the clusterProfiler package in the R environment (^26,27^). GO analysis is a commonly used approach for identifying the biological attributes of genes, gene products, and sequences (^28^), while KEGG is a collection of databases that provides information on genomes, biological pathways, diseases, and chemical substances (^29^). GO and KEGG pathways were considered significant if adjusted P-values < 0.05 (q-values), with adjustment performed using the Benjamini-Hochberg method.
Statistical analyses
Kolmogorov Smirnov and Shapiro-Wilk tests were used to evaluate the distribution of variables. Those variables with a normal distribution are reported as mean ± SD, while variables with a skewed distribution were log-transformed before the analyses and are reported as median (25-75th percentiles). Categorical variables are shown as %. Clinical and laboratory variables, as well as lncRNA expressions, were compared between groups using appropriate tests such as One-way ANOVA, Student’s t, or χ^2^ tests. Pearson’s correlation test was applied to analyze correlations between quantitative variables. The statistical analyses were conducted using the SPSS statistical package (v.18.0) for Windows (SPSS Inc, Chicago, IL), and P-values < 0.05 were significant.
The adequate sample size was estimated using the OpenEpi site (www.openepi.com), considering a power of 80% (α = 0.05) to detect two-fold (±1.5 SD) differences in lncRNA expressions between groups, as based in previous studies (^30^-^32^). Therefore, at least nine patients in each group were required to achieve sufficient statistical power.
RESULTS
Sample description
Table 1 describes the clinical and laboratory characteristics of patients with T1DM and individuals without DM. Mean age was higher in control and long-term diabetes groups than in patients with < 5 years of T1DM (P < 0.0001). HbA1c was lower in controls than in patients with T1DM (P < 0.0001). There was no difference between groups in gender and ethnicity frequencies (P > 0.050).
Expression of lncRNAs in PBMCs from patients with T1DM and non-diabetic
subjects
Expressions of the five lncRNAs (MEG3, MALAT1, MIAT, TUG1, and PVT1) were evaluated in PBMC samples from individuals with T1DM, divided into patients with < 5 years of diagnosis and long-term diabetes group, as well as non-diabetic subjects. Figure 1 (A and E) shows that MALAT1 and TUG1 levels were higher in patients with < 5 years of diagnosis of T1DM compared to the control and long-term diabetes groups [MALAT1: 1.23 (0.90-1.410) vs. 0.89 (0.81-1.06) vs. 0.92 (0.68-1.04), P = 0.008; TUG1: 1.42 (1.07-1.61) vs. 0.83 (0.56-1.11) vs. 0.84 (0.72-1.06), P = 0.001, respectively). MEG3 expression was higher in < 5 years of diagnosis group compared to the control group [0.62 (0.17-1.54) vs. 0.23 (0.170-0.360), P = 0.048] but not with long-term diabetes group (P = 0.121) (Figure 1B). Moreover, the expression of this lncRNA did not differ between controls and patients with T1DM with ≥ 5 years of diagnosis (long-term diabetes group) (P = 0.677; Figure 1B). MIAT and PVT1 expressions did not differ between the three groups (P = 0.862 and P = 0.281, Figure 1C and 1D).
Figure 1. Expressions of lncRNAs MALAT1 (A), MEG3 (B), MIAT (C), PVT1 (D), and TUG1 (E) in PBMCs of patients with T1DM (with < 5 years or ≥ 5 years of diagnosis) and individuals without T1DM. Relative expressions were quantified using qPCR experiments. Data are shown as fold changes relative to the calibrator, determined using the ∆∆Cq method, and are presented as median (25-75th percentiles). P-values were calculated using one-way ANOVA with LSD post hoc tests. *P < 0.05.
Then, we evaluated correlations among the expressions of the lncRNAs and HbA1c levels and duration of T1DM. Expressions of TUG1 and MALAT1 were negatively correlated with the duration of T1DM [(r = -0.460, P = 0.042) and (r = -0.695, P = 0.0001); respectively]. Moreover, TUG1 was positively correlated with HbA1c levels (r = 0.471, P = 0.005), and MEG3 showed a trend towards a positive correlation with HbA1c levels (r = 0.324 and P = 0.081).
Bioinformatics analysis
Bioinformatics analyses were conducted to identify potential targets and pathways that may be affected by the three significantly dysregulated lncRNAs in PBMCs of patients with < 5 years of T1DM diagnosis. MALAT1, MEG3, and TUG1 together regulate the expression of 1,817 target genes (Table S1). Specifically, MALAT1 targets 1,598 genes, while MEG3 targets two genes, and TUG1 targets 295 genes (Table S1A and Figure 2A).
Figure 2. Venn diagram showing the shared target genes (A) and miRNAs (B) of the three lncRNAs dysregulated in diabetes.
To gain a better understanding of the biological pathways altered by the dysregulation of these three lncRNAs, we performed a functional enrichment analysis of their protein-coding target genes identified by two or more studies using pathway maps from the KEGG and GO repositories. Since neither of the two targets of MEG3 was identified by two or more studies, the functional enrichment analysis was performed using only MALAT1 and TUG1 protein-coding targets (Table S1). Ten unique KEGG pathways were enriched for the lncRNA targets, including glycolysis/gluconeogenesis-, ribosome-, adherens junction-, biosynthesis of amino acids, and regulation of actin cytoskeletonsignaling pathway (Table S2 and Figure 3A). Moreover, the protein-coding target genes were involved in 138 GO biological processes (Table S2), including those altered in DM pathogenesis, such as canonical glycolysis, glucose catabolic process to pyruvate, glycolic process via glucose-6-phosphate, glucose catabolic process, pyruvate metabolic process, and glycolytic process.
Figure 3. Significant KEGG pathways regulated by the dysregulated lncRNAs in diabetes (A), and by the target miRNAs of the three lncRNAs consistently dysregulated in diabetes (B).
Besides targeting protein-coding genes, lncRNAs also interact and regulate miRNAs. We found that MALAT1, MEG3, and TUG1 regulate 387 unique miRNAs (Table S3). MALAT1 targets 249 miRNAs, MEG3 targets 69 miRNAs, and TUG1 targets 204 miRNAs (Figure 2B). Of the 387 unique miRNAs, 17 were regulated by the three lncRNAs dysregulated in patients with T1DM and recent diagnosis of this disease (Figure 4). These 17 miRNAs have 409 target genes validated in at least two databases (Table S4), which are involved in pathways related to DM pathogenesis, including mTOR-, neurotrophin-, Notch-, p53-, and cell cycle-signaling pathways (Table S5 and Figure 3B). Moreover, their target genes participated in 997 GO biological process, including regulation of insulin secretion, regulation of apoptotic signaling pathway, response to insulin, response to glucose, and regulation of Notch signaling pathway.
Figure 4. Interactions between lncRNAs, miRNAs, and mRNA-pathways. The lncRNAs are presented as squares, the target miRNAs as diamonds, the target genes of the miRNAs as circles, and the pathways as triangles.
DISCUSSION
T1DM is an autoimmune disorder triggered by the interaction between genetic, environmental, and epigenetics factors (^3,33^). In the context of epigenetics, some studies have shown the key contribution of lncRNAs in the maintenance of beta-cell mass and function [reviewed in ^34^]. Thus, to better understand the role of lncRNAs in T1DM, we investigated the expression of five candidate lncRNAs in PBMCs from patients with T1DM and individuals without DM, and we found that MALAT1, MEG3, and TUG1 were upregulated in patients with < 5 years of T1DM diagnosis.
MALAT1 is one of the most extensively studied lncRNAs in human diseases and is widely described to be involved in cancer development (^35^). This lncRNA plays a role in transcriptional and post-transcriptional regulation, and alternative splicing, and is involved in many physiological and pathological processes (^35^). In the context of diabetes, MALAT1 has been linked to beta-cell dysfunction via inhibition of pancreatic and duodenal homeobox 1 (PDX-1) expression, which leads to reduced H3 histone acetylation (^36^). Moreover, higher levels of MALAT1 have been observed in human umbilical vein endothelial cells incubated with high glucose concentrations (^37^). This increase in MALAT1 levels was associated with upregulation of serum amyloid antigen 3, an inflammatory ligand and target of MALAT1, as well as with an increase in other inflammatory mediators, including tumor necrosis factor and interleukin-6 cytokines, both of which playing key roles in beta-cell dysfunction (^37^).
We have demonstrated the upregulation of MALAT1 in PBMCs of patients with < 5 years of diagnosis compared to individuals without DM and long-term diabetes group. In agreement with our results, Santos and cols. (^38^) described higher levels of MALAT1 in patients with T1DM diagnosed within ≤ 6 months compared to healthy individuals. Sathishkumar and cols. (^39^) also demonstrated the upregulation of MALAT1 in PBMCs from patients with type 2 DM (T2DM) compared to individuals without DM. Moreover, a systematic review described the upregulation of MALAT1 in different samples of patients with T2DM compared to controls (^18^).
Our bioinformatics analysis revealed that MALAT1 has 969 target genes, and is involved in 10 pathways, including glycolysis/gluconeogenesis-, regulation of actin cytoskeleton-, and biosynthesis of amino acidssignaling pathway. Additionally, this lncRNA interacts with 246 miRNAs, including miR-146a-5p and miR-155-5p, which were previously described as dysregulated in patients with recent diagnosis of T1DM (^40^), as well as miR-21-5p, miR150-5p, and miR181c-5p, which were reported as being consistently associated with T1DM in a systematic review published by our group (^41^).
MEG3 is another important lncRNA that has been extensively studied and reported to be associated with many human diseases, including metabolic, immune system, cardiovascular, and cerebrovascular diseases (^42^). We found an upregulation of MEG3 in < 5 years of T1DM diagnosis group, which is consistent with the study conducted by Sathishkumar and cols. (^39^) on PBMCs from patients with T2DM. However, other studies have described a downregulation of this lncRNA, mainly in patients with T2DM [reviewed in 18]. Moreover, MEG3 appears be involved in beta-cell function (^43^). In Balb/c mouse islets, Meg3 expression was abundant compared to exocrine glands. However, Meg3 expression was decreased in islets from T1DM (non-obese female mice) and T2DM (db/db mice) models (^43^). The authors also reported that Meg3 is a new regulator of the synthesis and secretion of insulin since Meg3 suppression influenced insulin production by decreasing the expression of key transcription factors, including Pdx-1 and MafA (^43^).
In addition, this lncRNA binds to different miRNAs to regulate different mechanisms, such as apoptosis, inflammation, oxidative stress, and endoplasmic reticulum stress (^42^). Our bioinformatics analyses showed that MEG3 interacts with 69 miRNAs, included miR-181c-5p, which was previously reported as dysregulated in patients with T1DM [reviewed in 41].
TUG1 has been associated with several biological and physiological processes, such as regulation of cell cycle, cell proliferation, migration, death, and gene expression regulation (^44^). In the context of DM, TUG1 expression has been related to beta-cell apoptosis and insulin secretion in both in vivo and in vitro experimental models (^15^). Some studies have also revealed the association of this lncRNA with the development of diabetic chronic complications (^45^-^47^). We found an upregulation of TUG1 in PBMCs from patients with < 5 years of diagnosis compared to long-term diabetes group and controls. Accordingly, Su and cols. (^48^) reported higher levels of TUG1 in the peripheral blood of patients with T2DM compared to healthy controls. Moreover, the lncRNA TUG1 had a high accuracy for discriminating patients with T2DM from healthy individuals together with hsa_circ_0071106 and hsa-miR-607 (^48^). Our bioinformatics analysis showed that TUG1 has 295 direct target genes, which are involved in 10 KEGG pathways and several GO biological processes. Furthermore, TUG1 interacts with 204 miRNAs, including miR-21-5p, miR-148a-3p, miR-144-3p, and miR-26b-5p, which were previously reported as being dysregulated in patients with T1DM (^41^), including those with a recent diagnosis (^40^).
Moreover, the interaction between lncRNAs and miRNAs changes the expression of target miRNAs, consequently affecting the genes and pathways in which these miRNAs are involved. Thus, our bioinformatics analysis revealed that MALAT1, MEG3, and TUG1 collectively regulate 17 miRNAs. These miRNAs have 409 target genes, which are involved in several pathways associated with DM pathogenesis, including mTOR-, neurotrophin-, Notch-, p53-, and cell cycle-signaling pathways. Notch has been associated with the regulation of beta-cell function and proliferation, playing a key role in beta-cell mass determination and DM (^49,50^). Physiological activation of mTORC1 is also important for the regulation of beta-cell homeostasis, adaptation, development, and insulin secretion, while chronic dysregulation of mTORC1 can lead to beta-cell failure [reviewed in ^51^].
Although our results are important to better understand the involvement of lncRNAs in pathogenesis of DM, we should consider a few limitations when interpreting our findings. Firstly, the small sample size may limit our ability to detect small differences in lncRNA expressions between groups, especially for MIAT and PVT1. Thus, type II errors may have occurred during comparisons of lncRNA expressions between the study groups. However, it is worth noting that our sample size was calculated to have sufficient statistical power to detect 2-fold differences in lncRNA expressions between the groups, reducing the bias likelihood. Secondly, it is important to acknowledge that a number of variables can influence lncRNA expressions, so we implemented a comprehensive list of exclusion criteria for our patients to minimize the impact of these variables. Thirdly, our study establishes associations rather than causal relationships. Therefore, further experimental studies are necessary to confirm the mechanisms underlying the associations of MALAT1, MEG3, and TUG1 with the initial phases of T1DM. Despite these limitations, this study holds significance as one of the initial reports on lncRNAs expression in individuals with T1DM, and the first in a Brazilian population.
In conclusion, our study revealed the upregulation of the lncRNAs MALAT1, MEG3, and TUG1 in patients within the first five years of diagnosis of T1DM compared to controls and long-term diabetes group. The findings suggest that these lncRNAs may be potential biomarkers for the onset of T1DM. Furthermore, our results indicate that these three lncRNAs target multiple genes and miRNAs involved in pathways associated with DM pathogenesis. However, further studies are necessary to elucidate the precise mechanisms via which MALAT1, MEG3, and TUG1 directly impact T1DM pathogenesis.
The reference list from the paper itself. Each links out to its DOI / PubMed record.
- 1Sun H Saeedi P Karuranga S Pinkepank M Ogurtsova K Duncan BB IDF Diabetes Atlas: Global, regional and country-level diabetes prevalence estimates for 2021 and projections for 2045 Diabetes Res Clin Pract 202218310911910.1016/j.diabres.2021.10911934879977 PMC 11057359 · doi ↗ · pubmed ↗
- 2van Belle TL Coppieters KT von Herrath MG. Type 1 diabetes: etiology, immunology, and therapeutic strategies Physiol Rev 20119117911810.1152/physrev.00003.201021248163 · doi ↗ · pubmed ↗
- 3Cerna M. Epigenetic Regulation in Etiology of Type 1 Diabetes Mellitus Int J Mol Sci 20192113610.3390/ijms 2101003631861649 PMC 6981658 · doi ↗ · pubmed ↗
- 4Loh M Zhou L Ng HK Chambers JC. Epigenetic disturbances in obesity and diabetes: Epidemiological and functional insights Mol Metab 2019 Sep 27S Suppl S 33S 4110.1016/j.molmet.2019.06.01131500829 PMC 6768506 · doi ↗ · pubmed ↗
- 5Zhang P Wu W Chen Q Chen M. Non-Coding RN As and their Integrated Networks J Integr Bioinform 20191632019002710.1515/jib-2019-002731301674 PMC 6798851 · doi ↗ · pubmed ↗
- 6Srijyothi L Ponne S Prathama T Ashok C Baluchamy S. Roles of Non-Coding RN As in Transcriptional Regulation. Transcr. Post-Transc Regul 2018125510.5772/intechopen.76125. · doi ↗
- 7Marchese FP Raimondi I Huarte M. The multidimensional mechanisms of long noncoding RNA function Genome Biol 201718120610.1186/s 13059-017-1348-229084573 PMC 5663108 · doi ↗ · pubmed ↗
- 8Moran VA Perera RJ Khalil AM. Emerging functional and mechanistic paradigms of mammalian long non-coding RN As Nucleic Acids Res 201240146391640010.1093/nar/gks 29622492512 PMC 3413108 · doi ↗ · pubmed ↗