High IL1R1 expression predicts poor survival and benefit from stem cell transplant in intermediate-risk acute myeloid leukemia from the Leucegene cohort
Guillaume Richard-Carpentier, François Béliveau, Sandrine Lacoste, Banafsheh Khakipoor, Véronique Lisi, Michael Vladovsky, Miriam Marquis, Jean-François Spinella, Patrick Gendron, Sébastien Lemieux, Vincent-Philippe Lavallée, Guy Sauvageau, Josée Hébert

TL;DR
High IL1R1 gene expression in some leukemia patients predicts worse survival but better outcomes with stem cell transplants.
Contribution
IL1R1 expression is shown to predict both poor prognosis and benefit from stem cell transplantation in intermediate-risk AML patients.
Findings
High IL1R1 expression correlates with worse 5-year overall and relapse-free survival in intermediate-risk AML patients.
Stem cell transplantation significantly improves survival in IL1R1high patients but not in IL1R1low patients.
IL1R1high patients without FLT3-ITD mutation still benefit from stem cell transplantation.
Abstract
There is an unmet clinical need to identify patients with acute myeloid leukemia and intermediate-risk cytogenetics who benefit from allogeneic hematopoietic stem cell transplantation in first remission, especially among those without FLT3-ITD mutation. We analyzed transcriptomic data from the Leucegene cohort composed of 316 patients with acute myeloid leukemia and intermediate-risk cytogenetics who have been treated with intensive chemotherapy. We evaluated associations between gene expression and overall survival or relapse-free survival and we analyzed the interaction between gene expression and allogeneic hematopoietic stem cell transplantation to identify biomarkers that predict the benefit of stem cell transplantation in this subgroup of patients. We identified high IL1R1 expression (IL1R1high) as a prognostic and predictive marker in the Leucegene cohort. IL1R1high (≥ 2.0…
Genes, proteins, chemicals, diseases, species, mutations and cell lines named across the full text — each resolved to its canonical identifier and authoritative record.
Click any figure to enlarge with its caption.
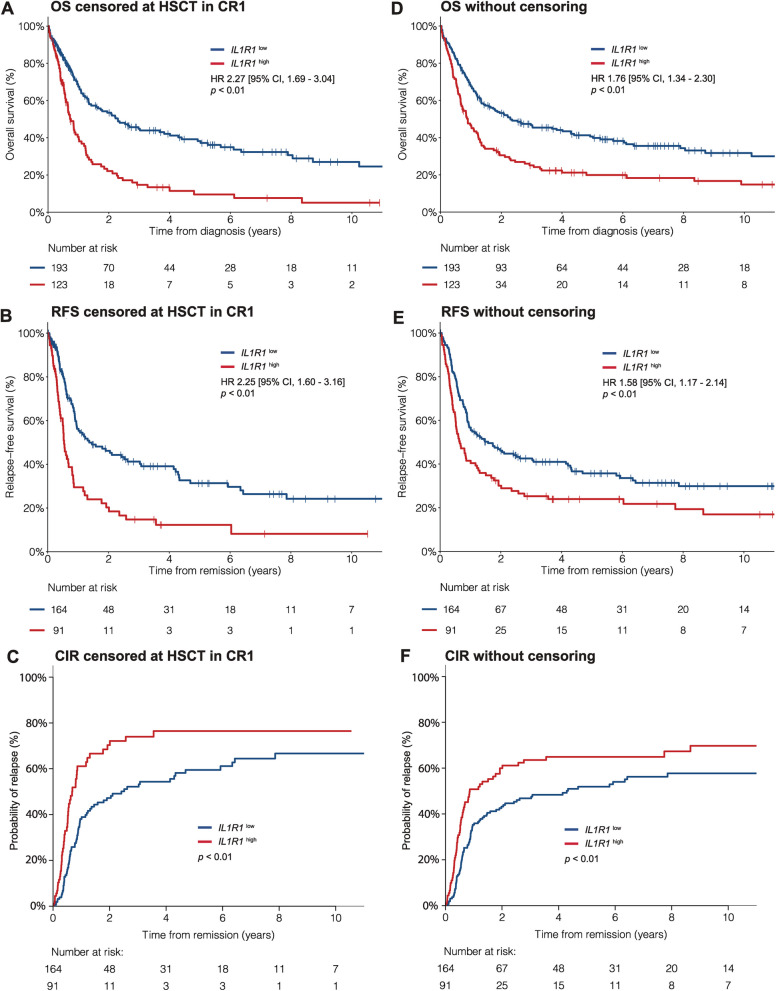 Figure 1
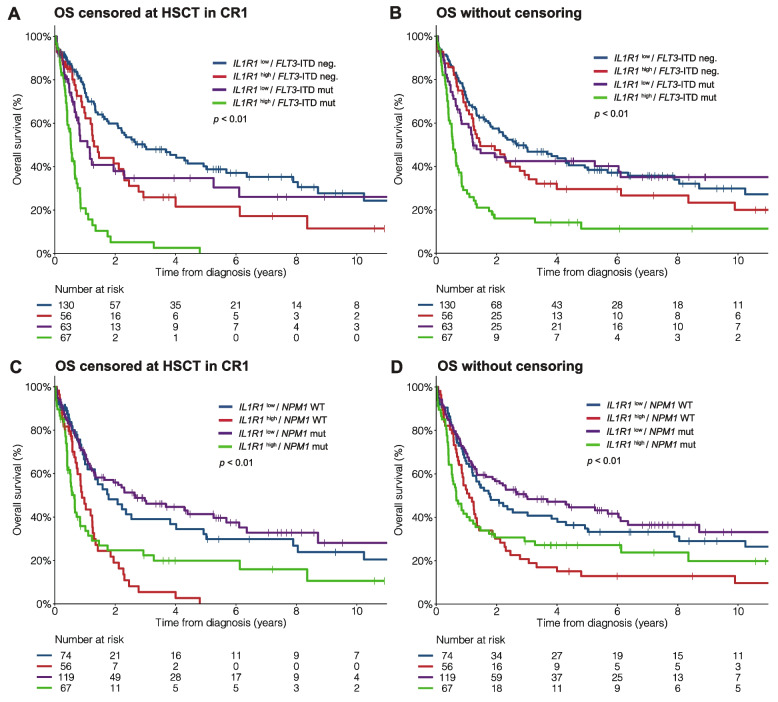 Figure 2
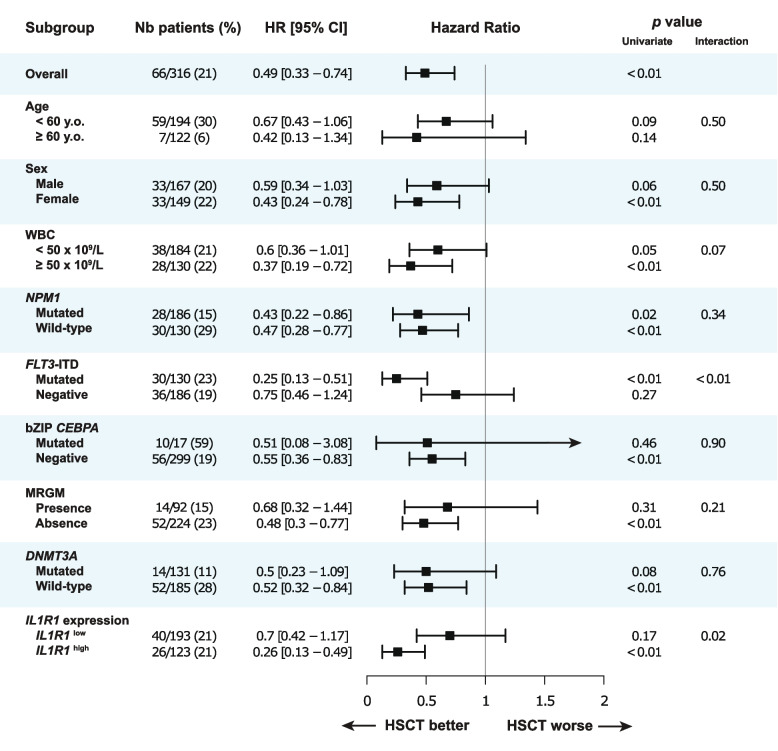 Figure 3
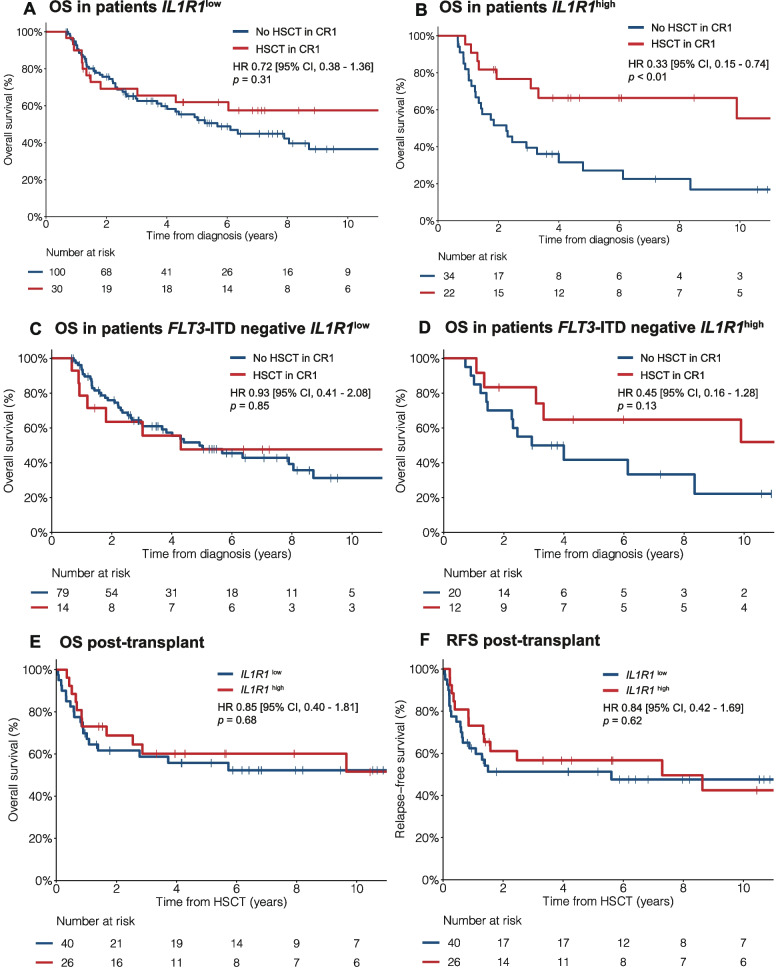 Figure 4
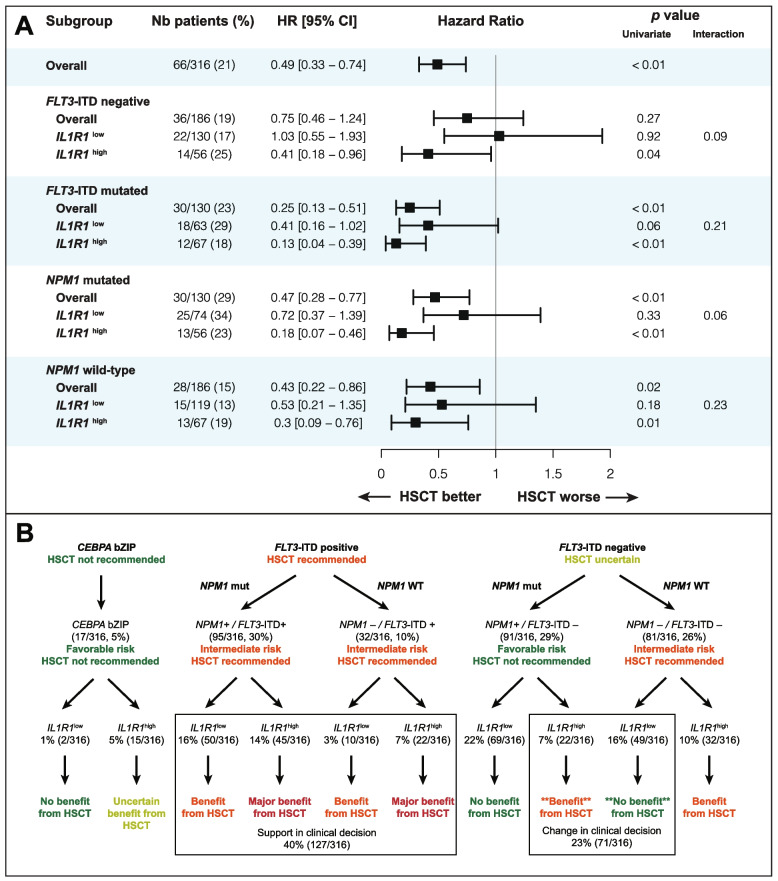 Figure 5
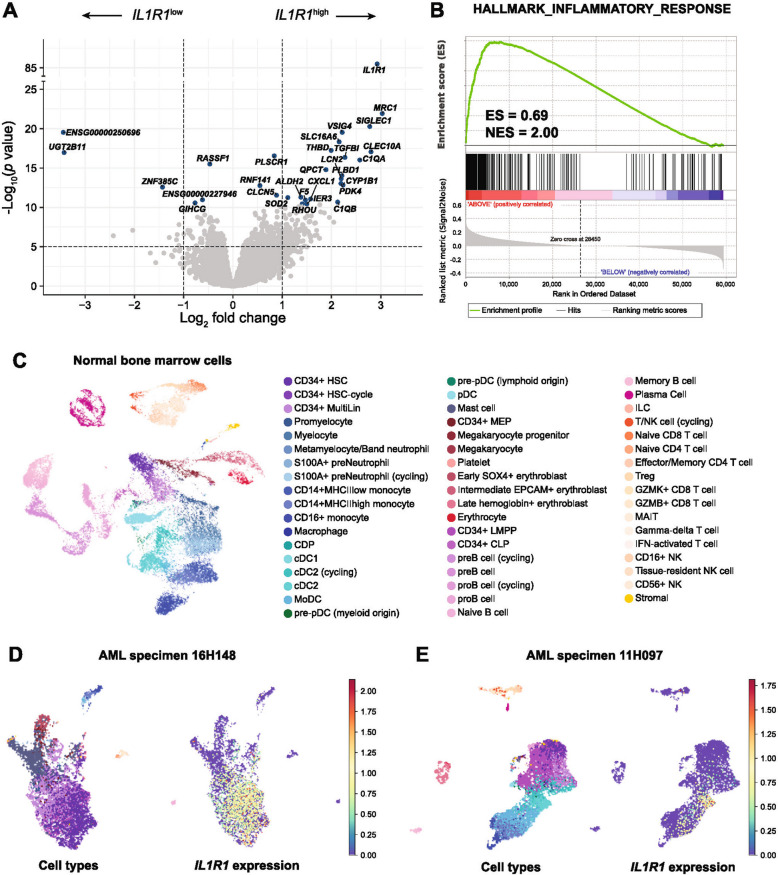 Figure 6
- —https://doi.org/10.13039/100008762Genome Canada
- —https://doi.org/10.13039/100013062Génome Québec
- —Calcul Québec
- —https://doi.org/10.13039/501100021202Alliance de recherche numérique du Canada
- —https://doi.org/10.13039/501100000156Fonds de Recherche du Québec - Santé
- —Bégin-Plouffe chair in blood stem cell chemogenomics
- —Research chair in leukemia from Industrielle-Alliance
Peer Reviews
No public reviews on file for this paper yet. If you reviewed it on a platform where reviews are public (OpenReview, ICLR, NeurIPS, ICML), you can paste yours below so the community can read it here.
Videos
No videos yet. Explain this paper in a talk, walkthrough, or lecture? Add one.
Taxonomy
TopicsAcute Myeloid Leukemia Research · Myeloproliferative Neoplasms: Diagnosis and Treatment · Hematopoietic Stem Cell Transplantation
Background
Acute myeloid leukemia (AML) is a heterogeneous hematological malignancy of hematopoietic progenitor and stem cells with a globally poor prognosis [1–3]. The standard intensive treatment for eligible patients consists of induction chemotherapy followed by consolidation chemotherapy or allogeneic hematopoietic stem cell transplantation (HSCT) [4]. Clinical characteristics and genetic features of leukemia cells, including cytogenetic abnormalities and gene mutations, are used to select the appropriate treatment including HSCT in first remission (CR1) [4–6]. Based on the European LeukemiaNet (ELN) risk classification, eligible patients with adverse-risk AML should undergo HSCT in CR1 whereas most patients with favorable-risk AML should be treated with consolidation chemotherapy without HSCT [4, 7]. In patients with intermediate-risk cytogenetics (IRC), HSCT in CR1 is generally recommended based on non-randomized studies showing improvement in overall survival (OS) [8–11]. However, in this subgroup of patients, the benefit from HSCT is of lesser magnitude compared to patients with adverse-risk AML and accordingly, lower thresholds for estimated risks of transplant-related morbidity and mortality are deemed acceptable [7, 12–14]. The role of HSCT in CR1 for patients with IRC AML has recently been further questioned with the results of a prospective randomized trial showing no benefit in OS with HSCT compared to consolidation chemotherapy [15].
The mutational profile of IRC AML helps to identify patients who benefit from HSCT, notably those with FLT3-ITD mutations (FLT3-ITD +) [10, 16–18]. In contrast, HSCT is generally not recommended in patients with bZIP CEPBA or with NPM1 mutation without FLT3-ITD mutation (NPM1 +/FLT3-ITD–) [4, 19–21]. However, despite being classified as favorable-risk AML, about half of patients with NPM1 +/FLT3-ITD– relapse and would likely benefit from HSCT in CR1. Furthermore, a substantial proportion of patients are negative for FLT3-ITD, NPM1 and bZIP CEBPA mutations and the benefit of HSCT in CR1 in patients with myelodysplasia-related gene mutations (MRGM) remains uncertain. Therefore, additional biomarkers to identify at diagnosis the patients with IRC AML who benefit from HSCT in CR1 would be extremely valuable.
With the aim of discovering biomarkers to predict the benefit of HSCT, we analyzed whole transcriptome sequencing data in the Leucegene de novo IRC AML cohort composed of 316 patients treated with intensive chemotherapy. We report herein the identification of IL1R1 as a gene expression biomarker that is independently associated with adverse clinical outcomes and identifies patients with IRC AML who benefit from HSCT in CR1, especially among those without FLT3-ITD mutation.
Methods
Patient cohort
The Leucegene de novo IRC AML cohort includes 316 newly diagnosed patients treated with intensive chemotherapy with bone marrow (BM) or peripheral blood (PB) cells collected at diagnosis by the Quebec Leukemia Cell Bank between 2001 and 2018 (Table 1 and Additional file 1: Table S1). Cytogenetics data was obtained from standard karyotype and fluorescent in situ hybridization and intermediate-risk was defined following the Medical Research Council and ELN 2022 classifications [4, 5]. Table 1. Characteristics of patients according to IL1R1 expressionCharacteristicTotal cohort (n = 316)IL1R1^low^ (n = 193)IL1R1^high^ (n = 123)p valueAge at Dx — median [range]56 [20–78]54 [20–78]59 [21–76]< 0.01 Age ≥ 60 years old122 (39)63 (33)59 (48)< 0.01Sex (male) — n (%)167 (53)103 (53)64 (52)0.91WBC at Dx (× 10^9^/L)37.0 [0.7–375.6]31.4 [0.7–361.2]43.7 [1.3–375.6]0.06 WBC ≥ 50 × 10^9^/L*130/314 (41)75/191 (39)55/123 (45)0.40PB blasts at Dx (%)70 [2–99]74 [4–99]62 [2–97]0.03BM blasts at Dx (%)74 [12–98]74 [12–98]73 [16–98]0.23FAB classification AML-M09 (3)9 (5)00.01 AML-M1100 (32)67 (35)33 (27)0.18 AML-M255 (17)37 (19)18 (15)0.38 AML-M453 (17)25 (13)28 (23)0.03 AML-M548 (15)23 (12)25 (20)0.06 AML-M62 (1)1 (0.5)1 (0.8)1.00 AML-M71 (0.3)1 (0.5)01.00 Not classifiable48 (15)30 (16)18 (15)0.95Mutations — n (%) NPM1186 (59)119 (62)67 (54)0.25 *FLT3-*ITD130 (41)63 (33)67 (54)< 0.01 FLT3-TKD19 (6)11 (6)8 (7)0.96 DNMT3A131 (41)78 (40)53 (43)0.72 bZIP in-frame CEBPA ^†^17 (5)15 (8)2 (2)0.04 RUNX141 (13)18 (9)23 (19)0.02 ASXL123 (7)10 (5)13 (11)0.12 TP531 (0.3)1 (0.5)01.00 IDH141 (13)32 (17)9 (7)0.03 IDH247 (15)38 (20)9 (7)< 0.01 IDH2 R14037 (12)30 (16)7 (6)0.01 IDH2 R17210 (3)8 (4)2 (2)0.36 NRAS43 (14)32 (17)11 (9)0.08 KRAS14 (4)9 (5)5 (4)1.00 SRSF224 (8)16 (8)8 (7)0.71 ZRSR24 (1)1 (1)3 (2)0.33 SF3B110 (3)5 (3)5 (4)0.69 STAG217 (5)11 (6)6 (5)0.95 TET259 (19)33 (17)26 (21)0.45 EZH29 (3)4 (2)5 (4)0.49 BCOR13 (4)10 (4)3 (4)0.36 U2AF16 (2)2 (1)4 (3)0.32 PTPN1136 (11)21 (11)15 (12)0.86 WT133 (10)15 (8)18 (15)0.08Mutational subgroups NPM1 mut/*FLT3-*ITD pos/DNMT3A mut59 (19)29 (15)30 (24)0.05 FLT3-ITD neg/bZIP CEBPA neg ^†^172 (54)118 (61)54 (44)< 0.01 NPM1 mut/FLT3-ITD neg/bZIP CEBPA neg91 (29)69 (36)22 (18)< 0.01 NPM1 WT/FLT3-ITD neg/bZIP CEBPA neg81 (26)49 (25)32 (26)1.00 MRGM92 (29)49 (25)43 (35)0.09ELN 2022 classification< 0.01 Favorable108 (34)84 (44)24 (20) Intermediate128 (41)69 (36)59 (48) Adverse80 (25)40 (21)40 (33)CR rate — n (%)255 (81)164 (85)91 (74)0.02HSCT in CR1 — n (%)66 (21)40 (21)26 (21)1.00NB. Percentage may not add up to 100% because of rounding. * WBC count at diagnosis was missing for 2 patients. † Three patients with bZIP in-frame CEBPA mutation also had co-occurring FLT3-ITD mutation. Therefore, the subset of patients without both FLT3-ITD and bZIP in-frame CEBPA includes 172 patients. Dx diagnosis, FAB French-American-British classification, neg negative, pos positive
Next-generation sequencing
Whole transcriptome sequencing was performed using the Illumina HiSeq 2000 or NovaSeq 6000 system with RNA extracted from mononuclear cells of AML patient diagnostic samples. Gene expression was normalized in transcripts per million (TPM), then log-transformed and standardized into Z-scores [22]. Variant calling for identification of gene mutations was performed using RNA sequencing data as previously described [23] and confirmed with exome sequencing data*.* Single-cell RNA sequencing data was studied in 22 patient samples (Additional file 1: Supplementary methods).
Identification of candidate gene expression biomarkers
We evaluated associations between the continuous expression of each protein-coding or long non-protein coding genes (n = 27,740) and OS or relapse-free survival (RFS) using Cox proportional hazards (CPH) regression models (Additional file 1: Fig. S1). We included age, white blood cell count and NPM1, FLT3-ITD, DNMT3A, bZIP CEBPA, ASXL1 and RUNX1 mutations as covariables in multivariable analyses (MVA). To identify predictive gene expression markers associated with benefit from HSCT, we evaluated interaction terms between gene expression and HSCT as a time-dependent (TD) variable (HSCT-TD) in CPH models for OS and RFS [24]. To identify the optimal cutoff of our candidate gene expression marker, we used different methods including the Youden index on receiver operating characteristic (ROC) curves and analysis of the prognostic and predictive impacts for all possible cutoffs of gene expression (Additional file 1: Supplementary methods, Fig. S2-S3).
Statistical analyses
We analyzed associations between gene expression and CR rates, OS, RFS and cumulative incidence of relapse (CIR) with standard endpoint definitions reported by ELN 2022 [4]. OS and RFS were calculated using the Kaplan–Meier method and differences between groups were tested with the log-rank test. Hazard ratios (HRs) were calculated using CPH models with 95% confidence intervals (CI). The Fine and Gray method was used to calculate CIR with death in remission considered as a competing risk to relapse. All survival times were censored at time of HSCT in CR1 unless stated otherwise, to avoid the confounding effect of HSCT in survival analyses*.* The impact of HSCT in CR1 was evaluated by testing interaction terms between covariables and HSCT-TD [24]. We performed a 6-month landmark analysis to illustrate the benefit from HSCT in CR1 according to candidate gene expression marker. *P *values < 0.05 were considered statistically significant. Statistical analyses were performed using R version 4.0.2.
Results
Identification of IL1R1 expression as a prognostic and predictive biomarker
We identified IL1R1 as the top gene significantly associated with OS and RFS in univariable and multivariable analyses and with significant interaction with HSCT-TD (p < 0.05) (Additional file 1: Fig. S1). Using the Youden index, the optimal cutoff for dichotomization of IL1R1 expression was 2.0 TPM, corresponding to a specificity of 82.5% and a sensitivity of 49.4% to predict 3-year OS (Additional file 1: Fig. S2). Testing for all possible cutoffs of IL1R1 expression, cutoffs between the 35th and 98th percentiles (0.90 to 25.75 TPM) were statistically significant in univariable and multivariable analyses for OS and RFS (Additional file 1: Fig. S2). HSCT in CR1 was beneficial in patients with high expression of IL1R1 with all the cutoffs evaluated between the 10th and 90th percentiles (Additional file 1: Fig. S3). For this manuscript, the cutoff of IL1R1 expression was set at 2.0 TPM (61st percentile) to optimize both its prognostic and predictive impacts. IL1R1 expression was slightly higher in patients who had a bone marrow sample sequenced versus those who had a peripheral blood sample sequenced (median BM 1.96 TPM vs PB 0.89 TPM, p < 0.01, Additional file 1: Fig. S4). However, this difference was only observed in patients without myelomonocytic differentiation (median BM 1.72 TPM vs PB 0.82 TPM, p < 0.01), but not in patients with myelomonocytic differentiation (median BM 2.05 TPM vs PB 2.02 TPM). There was no difference in IL1R1 expression between the two sequencing cohorts Leucegene 2 and 3 (median, 1.43 TPM vs 1.49 TPM, respectively, p = 0.86).
Patient characteristics according to IL1R1 expression
The characteristics of the Leucegene IRC AML cohort are presented in Table 1. With a cutoff at 2.0 TPM, 123 (39%) patients had high expression of IL1R1 (IL1R1^high^) and 193 (61%) patients had low expression of IL1R1 (IL1R1^low^). Patients with IL1R1^high^ were older (median age difference 5 years, p < 0.01) with a trend for higher WBC at diagnosis. A greater proportion of patients with IL1R1^high^ had AML with myelomonocytic or monocytic differentiation (43% vs 25% for IL1R1^low^; p < 0.01). As expected, NPM1 (59%), FLT3-ITD (41%) and DNMT3A (41%) mutations were frequently detected. *FLT3-*ITD and RUNX1 mutations were more frequent in patients with IL1R1^high^ whereas IDH1, IDH2 R140 and bZIP CEBPA mutations were more frequent in patients with IL1R1^low^. The frequency of NPM1 mutations was similar between groups. There was a trend for a higher frequency of any of the MRGM among patients with IL1R1^high^ (35% vs 25% for IL1R1^low^, p = 0.09). Treatments received by patients are detailed in Additional file 1: Table S1.
IL1R1 expression is an independent predictor of clinical outcomes in IRC AML
After induction chemotherapy, 255/316 (81%) patients achieved CR. The CR rate was 74% in patients with IL1R1^high^ versus 85% in patients with IL1R1^low^ (Odds ratio [OR] 1.99, p = 0.02). This association was independent from age, the only other variable associated with CR (adjusted OR 1.86,* p* = 0.03). With a median follow-up of 7.2 years, the median OS and 5-year OS rates were 9.0 months and 10% in patients with IL1R1^high^ versus 27.6 months and 38% in patients with IL1R1^low^ (HR 2.27, p < 0.01, Fig. 1A).Fig. 1. Clinical outcomes according to IL1R1 expression in the Leucegene IRC AML cohort. A OS B RFS and C CIR for patients with IL1R1^low^ (blue line) and IL1R1^high^ (red line) with survival times censored at time of HSCT in CR1. D OS E RFS and F CIR for patients according to IL1R1 expression without censoring at time of HSCT in CR1. IL1R1 expression is dichotomized on the 61st percentile corresponding to 2.0 TPM
Among patients who achieved CR, the median RFS and 5-year RFS rates were 6.4 months and 12% versus 16.4 months and 31% in patients with IL1R1^high^ and IL1R1^low^, respectively (HR 2.25, p < 0.01, Fig. 1B). The 5-year CIR rate was 17% higher in patients with IL1R1^high^ (76%, IL1R1^high^ vs 59%, IL1R1^low^, p < 0.01, Fig. 1C), but there was no difference in cumulative incidence of death (CID) between groups (Additional file 1: Fig. S5). When times were not censored at time of HSCT, IL1R1^high^ remained significantly associated with worse outcomes, but the differences between groups were of lesser magnitude (Fig. 1D-F). Additional details of clinical outcomes according to IL1R1 expression are available in Additional file 1: Table S2. In MVA, IL1R1^high^ was independently associated with both OS (HR 1.78, p < 0.01) and RFS (HR 1.77, p < 0.01) (Table 2, Additional file 1: Table S3). IL1R1 expression was significantly associated with OS and RFS regardless of the tissue sample sequenced (BM vs PB) and the sequencing cohort (Leucegene 2 vs 3) (Additional file 1: Fig. S6). Table 2. Multivariable analyses for OS and RFS including IL1R1 expressionCharacteristicOSRFSHR [95% CI]p valueHR [95% CI]p valueAge ≥ 60 years old2.20 [1.60–3.03]< 0.011.79 [1.23–2.59]< 0.01WBC ≥ 50 × 10^9^/L1.24 [0.90–1.71]0.181.30 [0.90–1.88]0.16NPM1 mutation0.66 [0.45–0.96]0.030.47 [0.30–0.75]< 0.01FLT3-ITD mutation2.44 [1.73–3.44]< 0.012.03 [1.37–3.02]< 0.01bZIP CEBPA mutation0.44 [0.13–1.44]0.170.24 [0.06–1.01]0.05RUNX1 mutation0.98 [0.65–1.48]0.921.00 [0.61–1.65]0.99ASXL1 mutation1.22 [0.71–2.08]0.481.53 [0.79–2.96]0.21DNMT3A mutation1.41 [1.03–1.94]0.032.01 [1.34–3.00]< 0.01IL1R1^high^1.78 [1.29–2.45]< 0.011.77 [1.22–2.56]< 0.01Analysis with censoring at time of HSCT in CR1. Similar analyses without censoring at time of HSCT in CR1 are available in the Additional file 1: Table S3. High expression of IL1R1 above 2.0 TPM
Importantly, although IL1R1^high^ was associated with FLT3-ITD mutation (FLT3-ITD +), IL1R1 expression had a significant prognostic impact both in patients with and without FLT3-ITD mutation (Fig. 2A-B, Additional file 1: Fig. S7)
In patients without FLT3-ITD, the 3-year OS rate was 26% versus 49% in patients with IL1R1^high^ and IL1R1^low^, respectively. In patients with FLT3-ITD +, the 3-year OS rate was 5% versus 35% in patients with IL1R1^high^ and IL1R1^low^, respectively. Similarly, IL1R1^high^ had a significant prognostic impact both in patients with and without NPM1 mutation (Fig. 2C-D, Additional file 1: Fig. S7) and in both younger (< 60 years) and older (≥ 60 years) patients (Additional file 1: Fig. S8). IL1R1 expression improved the prognostic stratification in patients with intermediate or adverse ELN 2022 risk, but not in patients with favorable risk (Additional file 1: Fig. S9). However, when using a higher cutoff for IL1R1 expression (75th percentile, 3.0 TPM), patients with IL1R1^high^ had lower OS among those with favorable ELN 2022 risk (HR 2.24, p = 0.04) (Additional file 1: Fig. S10).Fig. 2. Clinical outcomes according to IL1R1 expression and NPM1 or FLT3-ITD mutations in the Leucegene IRC AML cohort. OS according to IL1R1 expression and FLT3-ITD mutation status (A) with censoring at time of HSCT in CR1 and (B) without censoring at time of HSCT in CR1. OS according to IL1R1 expression and NPM1 mutation status (C) with censoring at time of HSCT in CR1 and (D) without censoring at time of HSCT in CR1
Expression of IL1R1 predicts the benefit from HSCT in CR1 in IRC AML
In our cohort, 66/316 (21%) patients have undergone HSCT in CR1 and those patients were younger and had lower frequencies of NPM1 and DNMT3A mutations (Additional file 1: Table S4). Among transplanted patients, the median age was 50 years (range, 21–64), which can be explained by the fact that 65 years was the maximal age for eligibility to HSCT in Quebec between 2001 and 2018. Interestingly, the frequency of FLT3-ITD mutation is similar between patients who proceeded to HSCT or not (45% vs 40%) mostly because FLT3 mutational testing became widely available around 2010 in Canada and the FLT3-ITD mutation status was unknown for many patients included in the Leucegene cohort to inform decision regarding transplant. In patients who proceeded to HSCT in CR1, the median time from diagnosis to transplant was 4.8 months (range, 1.9–10.3), with no difference between patients with IL1R1^low^ (4.9 months, range 1.9–10.1) and patients with IL1R1^high^ (4.6 months, range 2.1–10.3) (p = 0.27). The transplant rate was also similar in both groups (21% [40/193] in IL1R1^high^ versus 21% [26/123] in IL1R1^low^, p = 1.00) (Additional file 1: Table S1). In the Leucegene cohort of patients with de novo IRC AML, HSCT in CR1 improved both OS (HR 0.49, p < 0.01) and RFS (HR 0.57, p < 0.01) (Fig. 3, Additional file 1: Fig. S11).Fig. 3. Forest-plot for the benefit of HSCT in CR1 within various clinicopathological subgroups of patients. The endpoint used for these analyses was OS. HR and *p *values were obtained using HSCT in CR1 as a time-dependent (TD) variable in CPH models. Interaction terms were tested between HSCT-TD and covariables in CPH models. The number and proportion of patients who have undergone HSCT in CR1 is represented for each group in the second column
Expression of IL1R1 modified the impact of HSCT in CR1 with a significant interaction between HSCT-TD and IL1R1 expression as a continuous variable (OS, p < 0.01; RFS, p < 0.01) and binary variable (OS, p = 0.02; RFS, p = 0.02). HSCT in CR1 significantly improved OS and RFS in patients with IL1R1^high^ (HR for OS 0.26, p < 0.01; HR for RFS 0.32, p < 0.01), but not significantly in patients with IL1R1^low^ (HR for OS 0.70, p = 0.17; HR for RFS 0.75, p = 0.25) (Fig. 3, Additional file 1: Fig. S11). With a 6-month landmark analysis, the 5-year OS rates were 62% versus 54% (HR 0.72, p = 0.31) for patients with IL1R1^low^ and 67% versus 27% (HR 0.33, p < 0.01) for patients with IL1R1^high^ in patients who underwent HSCT or not, respectively (Fig. 4A-B).Fig. 4. Impact of HSCT in CR1 on survival outcomes according to IL1R1 expression. A-D Landmark analysis comparing survival outcomes in patients who proceeded to HSCT in CR1 (red line) versus those who did not (blue line). Landmark time was established at 6 months. A OS according to HSCT in CR1 in patients with IL1R1^low^. B OS according to HSCT in CR1 in patients with IL1R1^high^. C OS according to HSCT in CR1 in patients FLT3-ITD negative and IL1R1^low^. D OS according to HSCT in CR1 in patients FLT3-ITD negative and IL1R1^high^. E OS and F RFS post-HSCT in patients with IL1R1^low^ (blue line) and IL1R1^high^ (red line) among those who have undergone HSCT in CR1. Survival times were calculated from the date of HSCT in CR1 (panels E–F)
With a 6-month landmark analysis among patients without FLT3-ITD mutation, the 5-year OS rates were 48% versus 50% (HR 0.93, p = 0.85) for patients with IL1R1^low^ (n = 93) and 65% versus 42% (HR 0.45, p = 0.13) for patients with IL1R1^high^ (n = 32) in patients who underwent HSCT or not, respectively (Fig. 4C-D). Among patients without FLT3-ITD mutation and specifically negative for NPM1 mutation, HSCT in CR1 was not beneficial in patients with IL1R1^low^ (HR 0.94, 95% CI 0.36–2.43, p = 0.90) whereas HSCT in CR1 significantly improved survival in those with IL1R1^high^ (HR 0.26, 95% CI 0.07–0.92, p = 0.04) (Additional file 1: Fig. S12). Among patients without FLT3-ITD, but with NPM1 mutation, the 4 patients with IL1R1^high^ who proceeded with HSCT in CR1 remained alive in CR whereas 13 patients with IL1R1^high^ who didn’t proceed with HSCT in CR1 had a 5-year OS of 69% [95% CI, 48–99%] (Additional file 1: Fig. S12). Apart from IL1R1 expression, significant interaction with HSCT-TD was observed for FLT3-ITD mutations confirming the known benefit of HSCT in these patients. The benefit from HSCT in CR1 was greater among patients with FLT3-ITD + (HR for OS 0.25, p < 0.01) than in patients without FLT3-ITD mutation (HR for OS 0.75, p = 0.27) (Fig. 3). Importantly, when testing the impact of HSCT as a time-dependent variable among patients without FLT3-ITD mutation, patients with IL1R1^high^ benefited from HSCT (HR for OS 0.41, p = 0.04) whereas patients with IL1R1^low^ had no benefit from HSCT (HR for OS 1.03, p = 0.92) (Fig. 5A).Fig. 5. Benefit from HSCT in CR1 and clinical utility of IL1R1 expression according to mutational subgroups. A Forest plot for the benefit from HSCT in CR1 on OS in the Leucegene IRC AML cohort according to IL1R1 expression in relation to FLT3-ITD and NPM1 mutational status. HR and *p *values were obtained using HSCT in CR1 as a time-dependent (TD) variable in CPH models. Interaction terms were tested between HSCT-TD and covariables in CPH models. The number and proportion of patients who have undergone HSCT in CR1 is represented for each group in the second column. B Clinical utility of IL1R1 expression to guide the decision for HSCT in CR1 according to mutational subgroups
Among patients with FLT3-ITD +, all patients benefited from HSCT irrespective of IL1R1 expression, although the benefit was only marginally significant in patients with IL1R1^low^ (HR for OS 0.41, p = 0.06). Among patients with FLT3-ITD + and IL1R1^high^, 6/12 (50%) patients who underwent HSCT were alive in CR1 at last follow-up compared to 1/35 (3%) patients who did not undergo HSCT (HR for OS 0.13, p < 0.01). Among patients who have undergone HSCT in CR1, IL1R1^high^ was no longer associated with OS post-transplant (HR 0.85, p = 0.68) and RFS (HR 0.84, p = 0.62) indicating that HSCT abrogated the adverse impact of IL1R1^high^ (Fig. 4E-F). After HSCT, the 5-year OS and RFS rates were 56% and 51%, respectively, in patients with IL1R1^low^ compared to 60% and 57%, respectively, in patients with IL1R1^high^ (Fig. 4E-F, Additional file 1: Table S5). In patients with IL1R1^high^, the 5-year OS post-transplant was higher compared to 5-year OS censored at time of HSCT in CR1 for patients within each of the ELN 2022 risk categories (Additional file 1: Fig. S9).
Clinical utility of IL1R1 expression
IL1R1 expression improved the prognostic stratification of patients with IRC AML with ELN 2022 intermediate and adverse risks (Additional file 1: Fig. S9). Overall, using a multivariable CPH model for OS including the ELN 2022 risk classification and IL1R1 expression as covariables, the concordance index (c-statistic) improved to 0.661 compared to 0.639 when only the 2022 ELN risk classification was included (absolute difference 0.022) (Additional file 1: Table S6). Most importantly, IL1R1 expression would support the decision for HSCT in 172/316 (54%) patients without bZIP CEBPA or FLT3-ITD mutations in whom the indication is most uncertain (Fig. 5B). Considering current recommendations for HSCT in CR1 in patients with IRC AML, clinical decision regarding HSCT in CR1 could be modified in 71/316 (23%) patients with IRC AML when using IL1R1 expression (Fig. 5B). Twenty-two patients (7% of total cohort) with NPM1 mutations without FLT3-ITD mutation who would not normally undergo HSCT in CR1 would be best managed by proceeding to HSCT because of IL1R1^high^. Additionally, 49 patients (16% of total cohort) without NPM1, FLT3-ITD and bZIP CEBPA mutation who would normally undergo HSCT in CR1 would be best managed by consolidation chemotherapy instead of HSCT because of IL1R1^low^. In patients with FLT3-ITD + (40%, 127/316), IL1R1 expression may differentiate patients with dismal outcomes who will inevitably relapse without HSCT (IL1R1^high^) from patients with a more nuanced risk–benefit ratio (IL1R1^low^) therefore supporting the decision to proceed with HSCT.
To facilitate the clinical evaluation of IL1R1 expression as a novel biomarker, we developed and validated a RT-qPCR test for measurements of IL1R1 expression using 260 diagnostic specimens from the Leucegene de novo IRC AML cohort (Additional file 1: Supplementary methods and Table S7-S8). The resulting quantifications were highly correlated with the existing RNA sequencing data for the same samples (r = 0.90, p < 2.2e-16) (Additional file 1: Fig. S13). Using ROC curve analyses and similar methods for identification of the cutoff by RNA-sequencing, the cutoff for positivity of the test (high IL1R1 expression value) was set at 1354 normalized copy number (NCN), at the 61st percentile of the IL1R1 NCN distribution (Additional file 1: Fig. S13). The prognostic impact of high expression of IL1R1 measured by RT-qPCR was validated clinically in the Leucegene cohort and was statistically significant for both OS and RFS (HR for OS 1.87, 95% CI 1.37–2.55, p < 0.01; HR for RFS 1.94, 95% CI 1.34–2.80, p < 0.01) (Additional file 1: Fig. S13). We also confirmed that IL1R1 expression measured by RT-qPCR predicts the benefit from HSCT in CR1. In patients with IL1R1^high^ (≥ 1354 NCN), HSCT-TD significantly improved OS (HR 0.18, p < 0.01), but not in patients with IL1R1^low^ (< 1354 NCN) (HR 0.63, p = 0.10).
Bulk and single-cell transcriptomic associations with IL1R1 expression
To investigate why patients with IL1R1^high^ may benefit from HSCT, we performed differential gene expression analysis between patients with IL1R1^low^ versus IL1R1^high^ (Fig. 6A). The top gene overexpressed in patients with IL1R1^high^ was MRC1 which encodes for the mannose receptor present at the cell surface of macrophages and immature dendritic cells [25, 26]. Other genes associated with monocytic, macrophages or dendritic cells differentiation were significantly overexpressed in patients with IL1R1^high^ (including SIGLEC1, CLEC10A, TGFBI, C1QA, C1QB highlighted in Fig. 6A; and CD14, CD163*, CD300E, MSR1* in the top 50 overexpressed genes).Fig. 6. Bulk and single-cell transcriptomic associations with IL1R1 expression. A Volcano plot representing differential gene expression analyses between patient samples with low and high expression of IL1R1. Analyses were performed using the DESeq2 method [44]. Genes overexpressed in samples with IL1R1^low^ appear on the left and genes overexpressed in samples with IL1R1^high^ appear on the right. The names of the top 30 genes are displayed. B Gene Set Enrichment Analysis between patient samples with low and high expression of IL1R1 using the Broad Institute of Massachusetts Institute of Technology method [45]. There is a significant enrichment of inflammatory response gene sets in patients with high expression of IL1R1. C UMAP representation after Harmony integration of normal bone marrow single-cell RNA sequencing data with each cell being color coded according to their cell type as predicted by the classifier. D UMAP representation of single-cell RNA sequencing data for AML sample 16H148 with cell type predictions (left panel) and single-cell expression of IL1R1 (right panel). In this sample, IL1R1 is predominantly expressed in immature CD34-positive blasts. E UMAP representation of single-cell RNA sequencing data for sample 11H097 with cell type predictions (left panel) and single-cell expression of IL1R1 (right panel). In this sample, IL1R1 is mostly expressed in conventional dendritic cells 2 (cDC2)
When conducting gene set enrichment analysis, inflammatory response was in the top 5 of hallmark gene sets enriched in patients with IL1R1^high^, along with coagulation, epithelial-mesenchymal transition, complement and angiogenesis hallmarks (Fig. 6B, Additional file 1: Fig. S14). In order to understand which cells specifically express IL1R1, we first analyzed IL1R1 expression values in bulk transcriptomic data obtained from normal blood and bone marrow populations sequenced in the Leucegene project. These results confirmed that IL1R1 is expressed in these normal cell populations, especially granulocytes and monocytes (Additional file 1: Fig. S15). We then studied single-cell RNA sequencing of normal bone marrow from the Human cell atlas and from 22 AML patient samples from the Leucegene AML cohort (20 patient samples previously reported [27] and two new samples with known high IL1R1 expression based on bulk transcriptomics). In normal bone marrow cells (Fig. 6C), IL1R1 is expressed in CD14-positive monocytes, in conventional dendritic cells 2 (cDC2) and in stromal cells (Additional file 1: Fig. S16). In AML samples, IL1R1 expression had two distinct patterns exemplified by specimens 16H148 and 11H097 which had higher IL1R1 expression (Fig. 6D-E). In specimen 16H148, IL1R1 was predominantly expressed in immature CD34-positive myeloblasts and was highly correlated at the single-cell level with genes associated with an immature phenotype such as DNTT, SPINK2, AVP, CD34 and FAM30A (Fig. 6D, Additional file 1: Fig. S16). In contrast, in specimen 11H097, IL1R1 was rather expressed in cDC2 and was associated with the expression of genes associated with these cells such as MRC1, CLEC10A and CD1C (Fig. 6E, Additional file 1: Fig. S16).
Finally, we also evaluated whether the adverse prognostic impact of IL1R1 was shared by other genes involved in the IL1 signaling pathway. Among the 37 genes evaluated, only high expression of IL1RAP was significantly associated with adverse OS and RFS as previously reported by our group [28] (Additional file 1: Table S9). However, IL1RAP expression did not predict the benefit from HSCT in CR1.
Discussion
In this report, we show that IL1R1 gene expression in diagnostic patient samples with de novo IRC AML is associated with adverse prognosis and may identify patients who benefit from HSCT in CR1.
Because clinical trials with randomization of HSCT are challenging to conduct, the indication for HSCT in CR1 in patients with IRC AML is mostly supported by retrospective studies or genetic randomization studies [12, 14, 29, 30]. Meta-analyses of these studies have shown that overall, HSCT in CR1 appears beneficial in patients with IRC AML [8–11]. However, the only randomized trial ever performed to address this question, the ETAL-1 study, has shown that HSCT decreases CIR, but does not improve OS in these patients [15]. These conflicting data between previous non-randomized studies and the ETAL-1 study underscore the uncertainty about indication for HSCT in IRC AML and highlight the need for biomarkers to identify those who benefit from HSCT in CR1. To our knowledge, expression of IL1R1 is the first gene expression prognostic marker specifically identified and developed to predict the benefit of HSCT in CR1. In patients with IRC AML without FLT3-ITD mutation, only patients with IL1R1^high^ appeared to benefit from HSCT in CR1 in our cohort. This finding is potentially relevant for patients with NPM1 +/FLT3-ITD– who are generally not offered HSCT in CR1, although they still have a high rate of relapse of approximately 50% [6]. In patients with FLT3-ITD +, although HSCT in CR1 is beneficial irrespective of IL1R1 expression, patients with IL1R1^high^ are at very high risk of relapse which may influence transplant-related decisions such as selection of donor, conditioning regimen and immunosuppression post-transplant to optimize outcomes. However, it is important to note that only 10/149 (7%) of patients with FLT3 mutations have received midostaurin as part of their treatment in our cohort. The prognostic impact of IL1R1 expression and its potential to predict the benefit from transplant remains uncertain in patients with FLT3 mutations who receive midostaurin or other FLT3 inhibitors with intensive chemotherapy. In patients without NPM1, FLT3-ITD and bZIP CEBPA mutation, which represent a substantial proportion of patients with IRC AML (~ 25%), there is currently no well-established genetic marker to guide the decision for HSCT in CR1. Myelodysplasia-related gene mutations (MRGM), which are frequent in these patients, have been included in the adverse-risk category in the ELN 2022 classification based on its strong association with secondary AML and worse clinical outcomes [4, 31]. However, data on the benefit of HSCT specifically in patients harboring any of these mutations is lacking. Based on our data, both patients with and without MRGM benefited from HSCT. In our cohort, patients with NPM1–/FLT3-ITD– and with IL1R1^low^ did not benefit from transplant and would likely be better treated with consolidation chemotherapy without HSCT whereas those with IL1R1^high^ clearly benefited from HSCT. Therefore, in patients with NPM1–/FLT3-ITD–, IL1R1 expression might be a better biomarker than MRGM to select patients who should proceed to HSCT. Although the data from our cohort is promising and interesting, the possible ability of IL1R1 expression to predict the benefit from HSCT in CR1 remains to be validated in external independent cohorts, especially for subgroups with the greatest potential clinical utility such has AML with NPM1 +/FLT3-ITD– or NPM1–/FLT3-ITD–. Unfortunately, we could not validate our findings regarding the prediction of benefit from HSCT in CR1 with IL1R1 expression because of the limited size of publicly available cohorts of patients with IRC AML treated with intensive chemotherapy with gene expression data at diagnosis. Furthermore, to properly validate the possible ability of IL1R1 expression to identify the patients who benefit from HSCT, detailed transplant-related clinical data, including transplant dates, are required to perform survival analyses with censoring at time of transplant and analysis with transplant as a time-dependent variable.
The adverse prognostic impact of IL1R1^high^ was previously reported in an independent external cohort of 70 patients with AML although the association with benefit of HSCT was not studied [32]. In this paper, the significant association of IL1R1 expression with OS and EFS was also validated in the TCGA (n = 162) and TARGET (n = 254) AML cohorts [32]. Altogether, the prognostic impact of IL1R1 expression has now been validated in four independent patient cohorts, including the Leucegene IRC AML cohort described in this report. We demonstrated that IL1R1^high^ is associated with adverse OS and RFS and is independent of age, WBC at diagnosis and ELN 2022 risk classification. Although we confirm with our cohort that IL1R1 expression is strongly and independently associated with clinical outcomes, the clinical utility of a prognostic biomarker is quite limited without any evidence that it may predict response or benefit from specific therapies. Further research is warranted to better define the potential clinical utility of IL1R1 expression as a biomarker in newly diagnosed IRC AML beyond its use to estimate prognosis.
Apart from gene mutations and cytogenetics abnormalities, persistence of measurable residual disease (MRD) after intensive chemotherapy is now a well-recognized adverse prognostic factor in AML and is increasingly utilized to identify patients who benefit from HSCT, especially in NPM1-mutated AML [33–35]. Unfortunately, patient samples included in this study were collected before 2019 at a time when MRD testing was not routinely performed in clinical practice for AML in Canada. Since molecular and flow cytometry MRD assessments are now widely implemented to support decisions regarding indication from HSCT in CR1, the lack of MRD data is a significant limitation of our study. Consequently, future studies are warranted to evaluate whether IL1R1 expression is an independent prognostic factor from MRD status for prognosis assessment and identification of patients who benefit from HSCT in CR1. Our results showing that IL1R1 is also expressed in normal blood and bone marrow populations indicate that IL1R1^high^ is a useful prognostic biomarker only at diagnosis and would not be useful for MRD monitoring. Nonetheless, irrespective of its association with MRD persistence, IL1R1 expression has the advantage of being tested at diagnosis which allows to identify before starting induction therapy which patients will have suboptimal response to chemotherapy and may benefit from alternative treatment approaches and from HSCT in CR1. MRD testing also poses multiple technical challenges including the variability of results according to technologies utilized (flow cytometry vs molecular testing) and the requirement of significant resources and time [33]. With the aim of facilitating future studies with IL1R1 expression and possible future clinical implementation, we developed a simple and inexpensive RT-qPCR test to measure IL1R1 expression. Measurement of IL1R1 expression by this RT-qPCR test is highly correlated with measurements with RNA-sequencing and we confirmed that IL1R1 expression in NCN measured by RT-qPCR was associated with OS and RFS in our cohort. Before clinical implementation of this RT-qPCR test may be envisioned, clinical validation of the test in external independent cohorts and standardization of the quantification results across multiple clinical laboratories are important additional test development milestones yet to be performed for IL1R1 expression. As part of test development, the cutoff that we identified and selected for IL1R1 expression in our cohort would also need to be validated in external cohorts.
To generate hypotheses to understand why patients with high expression of IL1R1 have poor clinical outcomes and may benefit from HSCT in CR1, we performed differential gene expression analyses, GSEA and single-cell RNA sequencing analyses. AML samples with IL1R1^high^ more frequently had monocytic differentiation and had enrichment in inflammatory hallmark gene sets*.* In differential gene expression analyses, IL1R1^high^ samples had increased expression of many genes associated with monocytic, macrophage and dendritic cells, such as MRC1, which was the top gene overexpressed in IL1R1^high^ samples. In our single-cell RNA sequencing analysis, MRC1 expression was correlated with IL1R1 expression only when the latter was expressed in cells of monocytic lineage including dendritic cells. In other AML samples, IL1R1 was rather expressed in immature blastic leukemia cells suggesting that more than one mechanism may be at play. The increased expression of IL1R1 in immature blastic cells and its correlation with leukemia stem cell (LSC) markers which have been included in LSC gene expression prognostic signatures (CD34, SPINK2, FAM30A) [36, 37], suggest that some cell intrinsic factors may also be involved in the poor prognosis associated with IL1R1^high^. IL1 has been demonstrated to drive proliferation of leukemia cells by both an autocrine and paracrine manner [38]. However, when evaluating the prognostic impact of genes involved in the IL1 signaling pathway, only IL1RAP expression, the IL1 receptor accessory protein, was significantly associated with adverse outcomes, but it did not predict benefit from HSCT in CR1. It is unknown whether the adverse prognosis associated with IL1R1^high^ is associated with activation of the IL1 signaling pathways in leukemia cells or higher expression of IL1R1 is a bystander of another process.
The identification of IL1R1 as a biomarker in AML also suggests potential interest in targeting the IL1 pathway or other inflammatory pathways as novel therapeutic avenues in AML [39]. Competitive inhibitors (anakinra) or direct inhibitors (canakinumab) of IL1 have been successfully used in other settings such as prevention of cardiovascular disease, rheumatoid arthritis and auto-inflammatory syndromes and would likely merit study in AML [40–42]. Interestingly, small molecule inhibitors of the downstream signaling pathway of IL1 have shown to be effective in preclinical models of AML [38] and, more specifically, IRAK1/4 inhibitors are currently being evaluated in clinical studies in patients with AML or myelodysplastic syndromes [43].
Conclusion
Our results demonstrate that IL1R1 expression at diagnosis of AML is a promising new biomarker to improve prognostication in patients with IRC and may guide the decision to recommend HSCT or consolidation chemotherapy in these patients. External validation of IL1R1 expression as a prognostic and predictive biomarker and further studies evaluating other pro-inflammatory markers might improve risk stratification and prediction of response to HSCT or other therapies in AML.
Supplementary Information
Additional file 1. Supplementary methods. Table S1 Treatments received by patients in the Leucegene cohort. Table S2 Clinical outcomes according to IL1R1 expression. Table S3 Multivariable analyses for OS and RFS without censoring at time of HSCT in CR1. Table S4 Characteristics of patients according to HSCT status. Table S5 Clinical outcomes post-HSCT according to IL1R1 expression. Table S6 C-index in MVA including ELN 2022 and IL1R1 expression as covariable. Table S7 Primers and probes for the IL1R1 RT-qPCR test. Table S8 Analytical validation performance specifications for the IL1R1 RT-qPCR test. Table S9 Prognostic analyses of genes involved in the IL1 signaling pathway and other related genes. Fig. S1 Identification of IL1R1 expression as a prognostic and predictive biomarker. Fig. S2 Identification of the optimal cutoff value for dichotomization of IL1R1 expression. Fig. S3 Benefit from HSCT in CR1 for overall survival using different cutoffs for IL1R1 expression. Fig. S4 Expression of IL1R1 according to the type of sample sequenced and myelomonocytic differentiation of the AML. Fig. S5 Cumulative incidence of death in remission according to IL1R1 expression. Fig. S6 Prognostic impact of IL1R1 expression according to the type of sample sequenced and the sequencing cohort. Fig. S7 Prognostic impact of IL1R1 expression according to NPM1 or FLT3-ITD mutational status. Fig. S8 Prognostic impact of IL1R1 expression according to age. Fig. S9 Prognostic impact of IL1R1 expression according to 2022 ELN risk classification. Fig S10 Prognostic impact of IL1R1 with a higher cutoff value in patients with ELN 2022 favorable-risk AML. Fig. S11 Benefit from HSCT in CR1 for RFS in clinicopathological subgroups of patients. Fig. S12 Impact of HSCT in CR1 on survival outcomes according to NPM1 mutational status and IL1R1 expression in patients FLT3-ITD negative. Fig. S13 Correlation between IL1R1 expression quantification by the RT-qPCR test and RNA sequencing and clinical validation of the IL1R1 RT-qPCR test in the Leucegene cohort. Fig. S14 Additional Gene Set Enrichment Analyses between patients with high and low expression of IL1R1. Fig. S15 Analysis of IL1R1 expression in normal blood and bone marrow populations and in acute leukemias sequenced in the Leucegene project. Fig. S16 Single-cell RNA sequencing of normal bone marrow and AML specimens.Additional file 2. Table S10 Clinical data.