Growth hormone treatment associates with improved circulating anti-aging protein Klotho and reduced arterial stiffness in children with CKD
Stella Stabouli, Maren Leifheit-Nestler, Michael Föller, Martina Feger, Aysun K Bayazit, Anke Doyon, Lukasz Obrycki, Bruno Ranchin, Jun Oh, Dusan Paripovic, Germana Longo, Jerome Harambat, Otto Mehls, Anette Melk, Uwe Querfeld, Franz Schaefer, Dieter Haffner, Gerard Cortina

TL;DR
Growth hormone treatment in children with chronic kidney disease is linked to higher levels of the anti-aging protein Klotho and lower arterial stiffness.
Contribution
This study shows long-term GH treatment improves sKlotho and reduces arterial stiffness in pediatric CKD patients.
Findings
GH-treated patients had higher sKlotho and IGF1 levels and lower PWV compared to controls.
Multivariable analysis linked sKlotho levels to GH treatment and IGF1.
PWV was associated with GH treatment, blood pressure, and parathyroid hormone levels.
Abstract
Chronic kidney disease (CKD) is characterized by low levels of the anti-aging protein α-Klotho and accelerated cardiovascular (CV) morbidity. Short-term treatment with growth hormone (GH) was shown to enhance soluble Klotho (sKlotho), the circulating form of α-Klotho, and endothelial function in patients with CKD. We hypothesized that long-term GH treatment in pediatric patients with CKD improves sKlotho levels and CV morbidity. We performed a case-cohort study within the Cardiovascular Comorbidity in Children with Chronic Kidney Disease (4C) study including 101 children with CKD stages 3–5 treated with and without GH. Patients were assessed for serum sKlotho, intact fibroblast growth factor 23 (iFGF23), somatomedin insulin-like growth factor 1 (IGF1), pulse wave velocity (PWV), carotid intima thickness (cIMT), and left ventricular mass index (LVMI) at two time points 12 months apart.…
Genes, proteins, chemicals, diseases, species, mutations and cell lines named across the full text — each resolved to its canonical identifier and authoritative record.
Click any figure to enlarge with its caption.
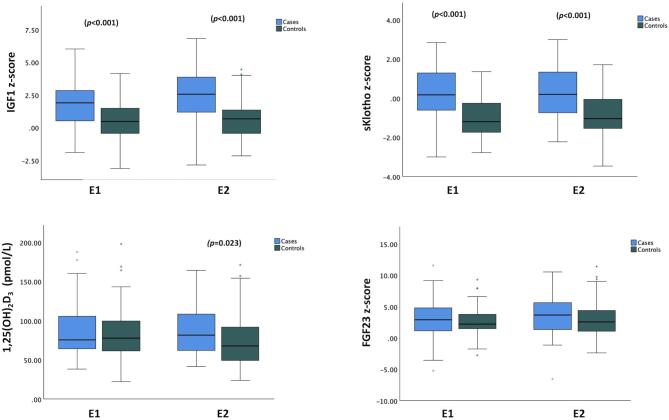 Figure 1
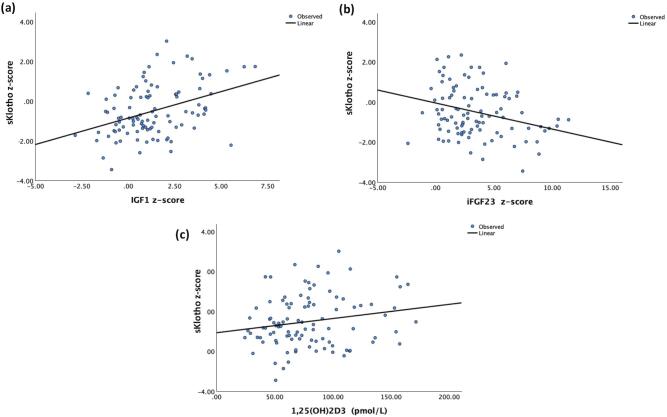 Figure 2
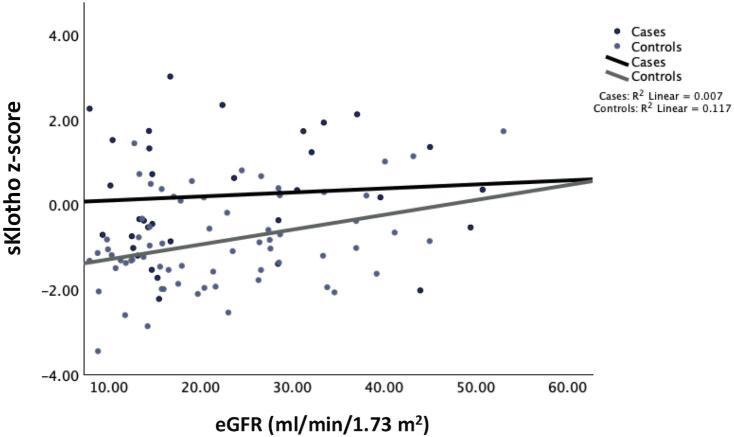 Figure 3
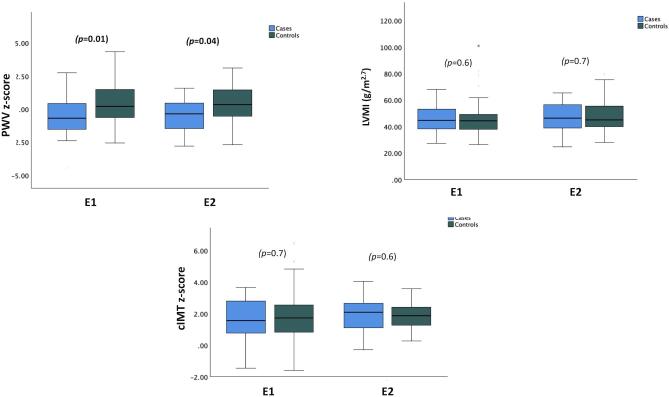 Figure 4
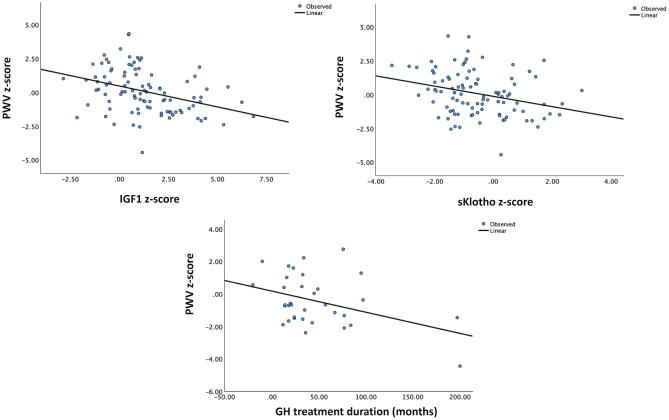 Figure 5
| Variable | GH group ( | Controls ( |
|
|---|---|---|---|
| Age, years | 12 (3) | 12 (3) | .2 |
| Male sex, % | 28 (82) | 49 (73) | .3 |
| CAKUT | 28 (82) | 56 (84) | .9 |
| Height, | −1.23 (1.07) | .4 | |
| BMI, | 0.16 (1.01) | 0.25 (1.06) | .7 |
| SBP, | 0.59 (0.96) | 0.72 (1.15) | .6 |
| DBP, | 0.33 (0.95) | 0.60 (0.86) | .2 |
| eGFR, ml/min/1.73 m2 | 24 (10) | 24 (10) | .9 |
| Hemoglobin, g/dl | 11.55 (1.31) | 11.60 (1.54) | .9 |
| Total cholesterol, mg/dl | 178.5 (37.7) | 183.8 (43.3) | .5 |
| LDL, mg/dl | 100.9 (35.2) | 105.0 (35.9) | .6 |
| HDL, mg/dl | 49.8 (11.8) | 50.0 (12.6) | .9 |
| Triglycerides, mg/dl | 156.8 (63.3) | 138.8 (84.4) | .3 |
| Bicarbonate, mmol/l | 22.8 (2.5) | 21.4 (3.1) | .03 |
| Albumin, g/l | 41.2 (4.5) | 40.1 (3.8) | .2 |
| Calcium, mmol/l | 2.38 (2.24 to 2.55) | 2.31 (0.19 to 2.43) | .04 |
| Phosphate, mmol/l | 1.59 (1.41 to 1.69) | 1.57 (1.35 to 1.74) | .7 |
| iPTH, pmol/l | 11.66 (7.34 to 17.85) | 12.40 (8.25 to 29.20) | .2 |
| IGF1, | 1.90 (0.48–2.87) | 0.48 ( | <.001 |
| sKlotho, | 0.16 ( | <.001 | |
| iFGF23, | 2.94 (1.15 to 5.09) | 2.25 (1.48 to 5.18) | .4 |
| 1,25(OH)2D3, pmol/l | 76 (64 to 107) | 78 (61 to 100) | .5 |
| Native vitamin D, | 15 (44.1) | 11 (16.4) | .003 |
| Active vitamin D, | 27 (79.4) | 39 (58.2) | .03 |
| Antihypertensive medication, | 18 (52.9) | 41 (61.2) | .4 |
| GH duration, months | 21.5 (7.0–56.75) | n.a. | n.a |
| GH cumulative dose, mg | 703 (250–2142) | n.a. | n.a. |
| PWV, | 0.35 (1.59) | .01 | |
| LVMI, g/m2.7 | 45.93 (10.26) | 45.85 (13.04) | .9 |
| cIMT, | 1.64 (1.29) | 1.73 (1.42) | .8 |
| GH group ( | Controls ( | |||||
|---|---|---|---|---|---|---|
| Variable | Start (E1) | End (E2) | Start (E1) | End (E2) | ||
| Height, | −1.23 (1.07) | −1.02 (1.04) | <.001 | −1.44 (1.31) | −1.50 (1.37) | .7 |
| BMI, | 0.16 (1.01) | 0.03 (1.07) | .089 | 0.25 (1.06) | 0.29 (1.06) | .3 |
| SBP, | 0.59 (0.96) | 0.50 (1.07) | .622 | 0.72 (1.15) | 0.74 (1.11) | .9 |
| DBP, | 0.33 (0.95) | 0.30 (0.98) | .894 | 0.60 (0.86) | 0.61 (0.99) | .9 |
| eGFR, ml/min/1.73 m2 | 19.8 (14.8–32.9) | 16.1 (13.7–31.4) | .039 | 22.2 (16.4–31.9) | 19.7 (13.6–28.5) | <.001 |
| Hemoglobin, g/dl | 11.55 (1.34) | 11.77 (1.68) | .66 | 11.58 (1.5) | 11.50 (1.07) | .7 |
| iPTH, pmol/l | 11.6 (7.3–18.8) | 14.8 | .102 | 12.4 (8.2–29.2) | 17.5 (9.3–32.4) | .006 |
| Calcium, mmol/l | 2.38 (2.24–2.55) | 2.43 (2.31–2.55) | .574 | 2.31 (2.19–2.43) | 2.37 (2.26–2.53) | .001 |
| Phosphate, mmol/l | 1.59 (1.41–1.69) | 1.65 (1.21–1.84) | .521 | 1.57 (1.16–1.74) | 1.61 (1.35–1.73) | .3 |
| IGF1, ng/ml | 456.6 (232.3) | 586.5 (288.2) | .019 | 335.3 (174.0) | 371.0 (197.8) | .08 |
| IGF1, | 1.90 (0.48–2.87) | 2.57 (1.17–3.93) | .079 | 0.48 [(−0.54) −1.49] | 0.67 (−0.48 to 1.38) | .3 |
| sKlotho, pg/ml | 1822 (1499–3322) | 1599 (983–3142) | .845 | 977 (752–1652) | 946 (699–1419) | .9 |
| sKlotho | 0.16 (−0.77 to 1.33) | 0.21 [(−0.77 to 1.38) | .754 | −1.18 (−1.74 to −0.22) | −1.04 (−1.54 to 0.08) | .4 |
| iFGF23, pg/ml | 124 (67–223) | 161 (72–315) | .640 | 97 (74–168) | 110 (66–218) | .2 |
| iFGF23 | 2.94 (1.15–5.09) | 3.68 (1.37–7.08) | 0.588 | 2.25 (1.48–5.18) | 2.60 (1.10–4.49) | .1 |
| 1,25(OH)2D3, pmol/l | 76 (64–107) | 82 (62–1099) | .952 | 78 (61–100) | 68 (49–93) | .08 |
| PWV, | −0.54 (1.52) | −0.52 (1.17) | .862 | 0.35 (1.59) | 0.35 (1.40) | .7 |
| LVMI, g/m2.7 | 44.8 (38.1–53.5) | 46.4 (38.9–56.2) | .980 | 44.2 (37.7–50.0) | 45.1 (39.6–56.2) | .05 |
| LVH (%) | 67.6 | 76.5 | .02 | 67.2 | 79.1 | <.001 |
| cIMT, | 1.64 (1.29) | 1.95 (1.08) | .137 | 1.73 (1.42) | 1.85 (0.77) | .4 |
| Dependent variable | Parameter | β | 95% CI |
|
|---|---|---|---|---|
| sKlotho | GH treatment (yes vs no) | 2.238 | 1.392–3.597 | <.001 |
| IGF1 | 1.194 | 1.072–1.330 | .001 | |
| iFGF23 | 0.898 | 0.841–0.960 | .002 | |
| 1,25(OH)2D3, pmol/l | 1.005 | 1.000–1.009 | .06 | |
| Total cholesterol, mg/dl | 0.996 | 0.991–1.000 | .05 | |
| eGFR, ml/min/1.73 m2 | 1.007 | 0.985–1.030 | .5 | |
| iFGF23 | Sex (male vs female) | 3.885 | 1.620–9.318 | .002 |
| eGFR, ml/min/1.73 m2 | 0.955 | 0.918–0.993 | .02 | |
| Calcium, mmol/l | 51.321 | 8.093–325.442 | <.001 | |
| sKlotho | 0.686 | 0.472–0.998 | .05 |
| Outcome | Parameter | β | 95% CI |
| |
|---|---|---|---|---|---|
| PWV | GH treatment (yes vs no) | 0.579 | 0.358 | 0.938 | .03 |
| iPTH, pmol/l | 1.008 | 1.001 | 1.014 | .02 | |
| SBP | 0.987 | 0.758 | 1.286 | .9 | |
| DBP | 2.098 | 1.531 | 2.875 | <.001 | |
| LVMI | GH treatment (yes vs no) | 0.647 | 0.013 | 31.250 | .8 |
| eGFR, ml/min/1.73 m2 | 0.871 | 0.754 | 1.005 | .6 | |
| Hemoglobin, g/dl | 0.335 | 0.130 | 0.862 | .02 | |
| BMI | 3.199 | 0.827 | 12.371 | .09 | |
| cIMT | GH treatment (yes vs no) | 1.087 | 0.785 | 1.504 | .6 |
| SBP | 1.043 | 0.868 | 1.254 | .6 | |
| DBP | 1.290 | 1.038 | 1.603 | .02 | |
- —Hannover Medical School10.13039/501100005624
- —European Renal Association
- —KfH Foundation for Preventive Medicine10.13039/501100016118
- —German Federal Ministry of Education and Research
Peer Reviews
No public reviews on file for this paper yet. If you reviewed it on a platform where reviews are public (OpenReview, ICLR, NeurIPS, ICML), you can paste yours below so the community can read it here.
Videos
No videos yet. Explain this paper in a talk, walkthrough, or lecture? Add one.
Taxonomy
TopicsParathyroid Disorders and Treatments · Magnesium in Health and Disease · Pancreatitis Pathology and Treatment
INTRODUCTION
Chronic kidney disease (CKD) is characterized by low levels of the anti-aging protein α-Klotho and accelerated cardiovascular (CV) morbidity including left ventricular hypertrophy (LVH), vascular stiffness and atherosclerosis, which are observed even in childhood in up to 50% of patients with CKD stages 3–5 [1, 2]. α-Klotho is a 130-kDa membrane-bound protein mainly expressed in the kidney acting as cofactor for the phosphaturic hormone fibroblast growth factor 23 (FGF23). FGF23 binds to the FGF receptor 1-α-Klotho complex resulting in downregulation of the sodium-dependent phosphate transporters NaPi2a and NaPi2c and suppression of 1,25-dihydroxyvitamin D_3_ [1,25 (OH)2_D_3] synthesis in proximal renal tubules and consecutive enhanced phosphate excretion and decreased 1,25 (OH)2_D_3 levels [3, 4]. α-Klotho occurs in two forms, a membrane-bound aKlotho, and soluble Klotho (sKlotho), which arises from proteolytic cleavage of the extracellular domain of the transmembrane protein. Reduced levels of sKlotho are associated with premature aging, impaired kidney function, and CV disease in the general population and patients with CKD [5, 6, 7].
Growth hormone (GH) is thought to stimulate calcitriol production and the phosphaturic and vascular actions of FGF23 by upregulation of FGF23/Klotho axis [8]. This is based on the observation that short-term GH treatment and endogenous GH excess enhance serum sKlotho concentrations in healthy people, patients with CKD stage 3, and acromegalic patients [8, 9]. Experimental studies indicate that upregulation of Klotho positively affects the CV system by enhancing FGF23 mediated nitric oxide (NO) release from small vessels and reducing oxidative stress, leading to enhanced microvascular function [10]. Likewise, a 7-day treatment with GH in healthy people and adult patients with CKD stages 3–5 increased microcirculation under resting conditions, which was paralleled by reduced total vascular resistance [11].
Therefore, we hypothesized that long-term GH therapy given for treatment of CKD-associated short stature improves serum sKlotho concentrations, and CV morbidity in pediatric CKD patients. To this aim we performed a case-cohort study within the Cardiovascular Comorbidity in Children with Chronic Kidney Disease (4C) study including 101 children with CKD stages 3–5 treated with and without concomitant GH treatment. Patients were assessed for serum concentrations of sKlotho, intact FGF23 (iFGF23), 1,25 (OH)2_D_3, and the somatomedin insulin-like growth factor 1 (IGF1), and major surrogate markers for CV damage including pulse wave velocity (PWV), LV mass index (LVMI), and carotid intima media thickness (cIMT) at two time points 12 months apart.
MATERIALS AND METHODS
Participants and study design
We performed a case-cohort study within the 4C study [1]. The 4C study is a European prospective observational study in pediatric CKD patients with an estimated glomerular filtration rate (eGFR) between 10 and 60 ml/min per 1.73 m^2^ and an age at study inclusion between 6 and 17 years, investigating CV status and a comprehensive set of clinical and laboratory parameters in 6-month intervals. The indication for GH treatment was met by the attending physicians for treatment of CKD-associated growth failure [12]. In 668 patients enrolled in the 4C-study a complete set of yearly CV assessments were available in 104 children receiving GH treatment. From the latter group we identified 34 cases (GH group) with adequate plasma samples for whom 67 non-GH-treated controls (one control was matched for two cases) were selected (Supplementary file 1). Matching was performed in 1:2 ratio for age, baseline eGFR ( \documentclass[12pt]{minimal} \usepackage{amsmath} \usepackage{wasysym} \usepackage{amsfonts} \usepackage{amssymb} \usepackage{amsbsy} \usepackage{upgreek} \usepackage{mathrsfs} \setlength{\oddsidemargin}{-69pt} \begin{document} \pm \end{document} 5 ml/min/1.73 m^2^), primary kidney disease, and treatment with inhibitors of the renin angiotensin system (ACE/ARB). Exclusion criteria were start of dialysis or kidney transplantation during the study period. Written informed consent was obtained from all caregivers and children as appropriate. The study was conducted according to the Declaration of Helsinki guidelines, and all local ethics committees approved the study.
PWV
Aortic PWV was assessed using the oscillometric Vicorder device (SMT medical, Würzburg, Germany). Settings and measurement conditions were as previously reported [13, 14]. The distance from the suprasternal notch to the femoral recording point via the umbilicus was used as path length. The measured values were transformed to z-scores per height using reference values established by our group [13].
cIMT
Ultrasound examination was performed per the Mannheim carotid IMT consensus [15] using an 8-MHz annular array ultrasound imaging system (Siemens Acuson P50 Ultrasound system, Software version 2.1) with integrated digital image evaluation software (Syngo US Workplace, Siemens Medical Solutions, USA Inc.). Five segments of the left and right common carotid artery in the anterior–posterior projection were examined and averaged. All values were transformed to z-scores per height [16].
LVMI
Two-dimensional echocardiography was performed to assess LV volume as previously described [17]. The LVMI was calculated by the Devereux Equation and indexed to the allometric height in meters raised to the power of 2.7 [18]. The sex- and age-specific LVMI partition values of Khoury et al. were used to define LVH [19].
Clinical assessments and laboratory analyses
For each visit, the following variables were extracted from the 4C database: primary kidney disease, weight, height, body mass index (BMI), office systolic and diastolic blood pressure (BP), duration and dose of GH medication, treatment with active and native vitamin D (yes/no), antihypertensive medication (yes/no), and ACEi/ARBs (yes/no); and laboratory parameters including hemoglobin, intact parathyroid hormone (iPTH), calcium, phosphate, bicarbonate, albumin, total cholesterol, high density lipoprotein (HDL), low density lipoprotein (LDL), and triglycerides, which were measured centrally by standard laboratory techniques. eGFR was calculated using the revised Schwartz formula [20]. For each visit plasma and serum in the biobank was used for further laboratory measurements including sKlotho, iFGF23, 1,25 (OH)2_D_3, and IGF1. Enzyme-linked immunosorbent assay kits were used for serum sKlotho (#27998, Immuno-Biological Laboratories, Japan), plasma iFGF23 (#60–6600, Immutopics, San Clemente, CA, USA), plasma IGF1 (# MD58011, IBL International, Hamburg, Germany), and serum 1,25 (OH)2_D_3 (# AC-62F1, Immunodiagnostic System, East Boldon, UK) according to the manufacturer's protocols. All samples were measured in duplicate. Inter-/intra-assay coefficients of variation were <8%.
Statistical analyses
The CV endpoints of the study were the comparison of PWV, cIMT, and LVMI at first observation (E1) and last observation (E2) and their changes from E1 to E2 in patients with and without concomitant GH treatment. Biochemical outcomes tested were sKlotho, iFGF23, IGF1 at E1 and E2, and their changes during the study period. Age and sex adjusted z-scores were calculated for height, BMI, office systolic and diastolic BP, IGF1, sKlotho, and iFGF23 [21-23].
Data are given as mean ± SD/SE or median (interquartile range, IQR) depending on the presence of normal distribution assessed by Shapiro–Wilk test. Comparisons between groups were performed using chi square, t-test and paired t-test, or non-parametric tests (Mann–Witney U, Wilcoxon, or McNemar tests) as appropriate. Spearman correlation and regression analysis were used to test for associations of CV and biochemical outcomes with clinical and laboratory variables. We used generalized estimating equations (GEE) models to account for matching in the design and to evaluate associations between outcomes and variables including age, sex, GH treatment (case versus control), native and active vitamin D supplementation (yes versus no), BMI z-score, systolic/diastolic BP z-score, total cholesterol, HDL, LDL, triglycerides, hemoglobin, serum albumin, albumin corrected calcium, phosphate, iPTH, bicarbonate, 1,25 (OH)2_D_3, IGF1 z-score, and eGFR. Multivariable models were built with candidate independent variables showing a P value of <.10 in the univariate analysis, to account for residual confounding. All models were adjusted for age and sex. In addition, bootstrap mediation analyses was used to examine the effect of IGF1 and sKlotho z-scores on PWV z-scores, and to examine possible mediation to the effect of GH treatment on PWV z-score [24]. The exploratory statistical analysis of all results, as well as correlations with clinical and laboratory parameters with CV endpoints were performed using SPSS 27 software. P values <.05 were considered statistically significant.
RESULTS
Patient characteristics and general laboratory parameters at first observation
Mean age of the study population was 12.1 ± 2.8 years, and median duration of GH treatment in the GH group amounted to 21.5 months (IQR, 7.0–56.7 months). At the time of first observation (E1), GH-treated and untreated patients did not significantly differ with respect to anthropometric parameters, median eGFR, BP values, hemoglobin, serum phosphate, iPTH, 1,25 (OH)2_D_3, and lipids values (Table 1). GH-treated patients showed significantly higher bicarbonate and albumin corrected-Ca levels compared to controls. As expected IGF1 z-scores were significantly higher in the GH group compared to controls (mean difference ± SE, E1: 1.31 ± 0.36, E2: 1.76 ± 0.40, each P < .001) (Fig. 1). sKlotho z-scores were significantly higher in GH-treated patients (mean difference ± SE, E1: 1.19 ± 0.28, E2: 1.08 ± 0.27, each P < .001), while iFGF23 z-scores did not differ between groups (Fig. 1). Native and active vitamin D were administered more frequently in GH-treated patients compared to controls, while there was no difference in the number of antihypertensive medications or the use of ACE/ARBs. Also, there was no significant change in the percentage of patients who were receiving antihypertensive medications in both groups between E1 and E2.
Serum IGF1, soluble Klotho, 1,25(OH)2D3, and iFGF23 concentrations at the first (E1) and second (E2) observations in GH-treated patients (cases) and controls.
Kidney function, FGF23-Klotho-1,25 (OH)2D3 axis and associated factors during study period
The median change in eGFR during the observation period was −2.21 ml/min/1.73 m^2^ (IQR, −5.07 to 0.32, P < .001) in the whole patient cohort, and did not differ between groups (GH group −1.08 ml/min/1.73 m^2^ (IQR, −4.5 to 0.69); controls −2.26 ml/min/1.73 m^2^ (IQR, −5.09 to −0.09), P = .5). During the observation period, serum IGF1 levels and height z-score significantly increased in GH-treated patients, but not in controls; sKlotho z-score, iFGF23 z-score, and 1,25 (OH)2_D_3 concentrations did not significantly change within patient groups, while iPTH levels increased in controls only (Table 2). Serum sKlotho z-score and 1,25 (OH)2_D_3 levels at E2 were significantly higher in GH-treated patients compared to controls (Fig. 1 and Table 2).
In the total study population, sKlotho z-score was positively associated with eGFR (E2 R^2^ = 0.051, P < .05), IGF1 z-score (E1 R^2^ = 0.061, P < .05; E2 R^2^ = 0.153 P < .001), 1,25 (OH)2_D_3 (E1 R^2^ = 0.087, P = .003; E2 R^2^ = 0.038, P = .05) levels, and negatively associated with iFGF23 z-score (E2 R^2^ = 0.093, P = .002) (Fig. 2a-c), and total cholesterol levels (E1 R^2^ = 0.054, P < .05; E2 R^2^ = 0.058, P < .05). The slope of the regression line between sKlotho and eGFR at the final observation (E2) was significant only in controls (β = 1.035, 95%CI 1.01–1.06, P = .005, for interaction between control group and final eGFR) (Fig. 3).
Soluble Klotho z-scores as a function of (a) IGF1 z-scores, (b) iFGF23 z-scores, and (c) 1,25(OH)2D3 levels at the first observation (E1).
Changes in sKlotho z-score as a function of eGFR (ml/min/1.73 m2) during the study period in GH-treated patients (cases) and controls.
In the GEE multivariable model, sKlotho z-sores during the observation period were significantly associated with GH treatment, IGF1 z-score, iFGF23 z-score, and total cholesterol levels, while iFGF23 z-scores were associated with eGFR, male sex, calcium, and sKlotho z-score (Table 3).
PWV, LVMI, and cIMT and associated factors during study period
PWV z-scores were significantly lower in GH-treated patients compared to controls at both the first and last observations (mean difference ± SE, E1 −0.89 ± 0.33; E2 −0.88 ± 0.29, both P < .005). PWV z-scores did not change significantly during the observation period, irrespective of GH treatment (Table 2, Fig. 4). In contrast, LVMI values, LVH prevalence, and cIMT z-scores did not differ between groups (Table 1, Fig. 4). There was also no difference in the prevalence of LVH between GH-treated patients and controls at E2 (Supplementary file 3). However, during the observation period LVMI significantly increased in controls only (Table 2). Numerically, but not statistically significant, more patients in the control group progressed to LVH, which is in line with the significantly increase in LVMI observed in the control group. Finally, no significant changes were noted for cIMT z-scores, irrespective of GH treatment.
Cardiovascular endpoints at baseline and at the end of the observation period in GH-treated patients and controls.
In the total study population, PWV z-score was inversely associated with IGF1 z-score (E1 R^2^ = 0.130, P < .001; E2 R^2^ = 0.095, P = .003), and sKlotho z-score (E1 R^2^ = 0.086, P = .004) (Fig. 5), and positively associated with systolic BP z-score (E1 R^2^ = 0.134, P < .001; E2 R^2^ = 0.157, P < .001), diastolic BP z-scores (E1 R^2^ = 0.206, P < .001; E2 R^2^ = 0.304, P < .001) and iPTH levels (E2 R^2^ = 0.084, P < .01). In GH-treated patients, PWV z-score was inversely associated with duration of GH treatment at baseline (E1 R^2^ = 0.160, P < .05). In GEE multivariable model, PWV z-score during the observation period were significantly associated with GH treatment, diastolic BP z-score, and iPTH levels (Table 4). LVMI associated only with hemoglobin levels in GEE model (Table 4). cIMT z-score was associated with BP values in GEE models (Table 4).
PWV z-scores in GH-treated patients as a function of IGF1 and sKlotho z-scores, and duration of GH treatment at the first observation (E1).
Mediation analysis showed that the effect of GH treatment on PWV z-score is mediated by sKlotho and IGF1 z-score with significant indirect effects coefficients 0.28, SE 0.14, 95% confidence interval (CI) 0.04–0.59 and 0.29, SE 0.17, 95%CI 0.02–0.71, respectively (Supplementary file 2).
DISCUSSION
In this case-cohort study, we investigated our hypothesis that long-term GH treatment in children with CKD stages 3–5 is associated with improved serum sKlotho and CV morbidity with respect to reduced arterial stiffness. The expected decline of sKlotho observed in parallel to declining eGFR in CKD controls [25] was blunted in GH-treated patients. sKlotho levels were already increased at baseline in patients on long-term GH treatment and the difference remained significant during the observation period. Patients treated with GH also presented with lower PWV z-scores at all time points compared to controls indicating reduced vascular stiffness. PWV *z-*scores associated with the duration of GH treatment, IGF1, and sKlotho z-scores suggesting that the beneficial effects of GH treatment on the vasculature are at least partly related to IGF1-induced upregulation of sKlotho levels.
The GH/IGF1 axis may exert several effects on the kidney including kidney glomerular hemodynamics, tubular sodium and water, phosphate, and calcium handling, as well as renal synthesis of 1,25 (OH)2_D_3 and the anti-aging protein α-Klotho [26]. In the present study GH treatment had no adverse effects on CKD progression supporting previous observations in GH-treated CKD patients [27, 28]. Chronic kidney disease-associated GH-insensitivity and/or generally limited renal reserve capacity [26], may explain the comparable decline in eGFR in both patient groups in the study. On the other hand, recent studies indicating that the deficiency of α-Klotho could contribute to GH resistance observed in CKD, the lack of α-Klotho might be preventing proper GH signaling in the kidneys [26, 29].
Previous studies showed that GH treatment increases sKlotho levels both in GH-deficient patients with normal kidney function but also in adults and children with CKD [9, 30-32]. In the present study, higher IGF1 levels associated with significantly higher sKlotho levels, which is in line with observations in healthy children, and GH-sufficient and GH-deficient patients [26, 33], and further supports the concept that the stimulating actions of GH on sKlotho may at least partly mediated by the somatomedin IGF1. Moreover, patients treated with GH had higher levels of sKlotho during the whole study period despite similar levels of iFGF23, while sKlotho decreased with CKD progression in GH-untreated patients only. Thus, GH treatment may attenuate the adverse effect of decreasing eGFR on renal α-Klotho synthesis and thus, sKlotho levels, likely mediated by IGF1, and independently of FGF23 [29].
There is a growing body of evidence that FGF23/Klotho axis has a regulating role in arterial remodeling in patients with CKD [34]. Intimal-media calcifications are a major feature of CKD-associated mineral and bone disorder (CKD-MBD) resulting in vascular stiffness which can be detected by increased PWV. High FGF23 exerts its pathological function on vessels in a Klotho-dependent manner with the disturbed balance between FGF23 and its cofactor α-Klotho contributing to the increased calcification in CKD [35]. Decreased sKlotho levels have been independently associated with arterial stiffness in adult CKD patients [36]. Beyond vascular calcification, sKlotho may exert protective effects on the endothelium and reduce endothelial dysfunction by regulating NO availability [37]. Thus, by increasing NO production resulting in arterial vasodilation, sKlotho reverts the FGF23-induced vasoconstriction observed in the state of Klotho deficiency [10].
These mechanistic insights may explain the lower PWV in GH-treated patients, while the lack of a significant association between cIMT and GH treatment suggest that different mechanisms and not mediated GH effects are responsible for increases in cIMT. In addition, 1,25 (OH)2D3 levels were significantly higher in the GH-treated patients compared to the controls, which is most likely due to the stimulating effects of GH on renal calcitriol synthesis [38]. Since high 1,25 (OH)2D3 levels are associated with increased cIMT in children with CKD, they could at least partially offset the positive effects of GH on the CV system in the present study [39]. Finally, the CV morbidity in CKD is a continuum under the detrimental effect of accumulating traditional and non-traditional risk factors. Each factor may predominantly affect different target organs, with GH treatment predominately affecting PWV-related CV morbidity.
The observed negative association between sKlotho and total cholesterol levels that remained significant in GEE models provides a further insight for the role of sKlotho in CV health. The association between serum sKlotho concentration and hyperlipidemia has been previously described in the adult general population using cross-sectional data from the NHANES 2007–2016 [40]. The potential mechanism by which Klotho negatively correlates with hyperlipidemia might involve anti-inflammatory effects, insulin resistance, and antioxidants. Several investigators discussed that therapeutic approaches to maintain or elevate the sKlotho level could improve arterial stiffness in CKD patients are warranted to be explored. In this concept GH treatment seems appealing, as it may improve CV outcome by attenuating adverse vascular alterations beyond its growth promoting effects in children with CKD.
In two pilot studies in adult CKD patients, short-term GH treatment improved CV risk factors and microcirculation [11, 41], while data on the potential effect of GH on uremic cardiomyopathy are lacking. Finally, the only RCT (OPPORTUNITY study) designed to assess all-cause and CV mortality in adult hemodialysis patients on GH treatment was terminated early due to slow recruitment and was underpowered for conclusions on hard outcomes [42]. Unfortunately, these studies in patients on GH treatment did not measure changes in the FGF23/Klotho system.
The high prevalence of LVH in childhood CKD has been previously highlighted in the 4C cohort [1]. A previous study in children with pre-dialysis CKD and after kidney transplantation did not find a link between FGF23 or sKlotho and LVMI, but the synergistic effect of both low sKlotho levels and high FGF23 levels have been associated with worse LV diastolic function [43]. sKlotho cardioprotective actions independent of FGF23 have been previously proposed in in vitro studies [44], but the results of the present study did not show significant associations between sKlotho and LVMI. GH treatment could also attenuate the adverse increases of LVMI with eGFR decline possibly by enhancing anthropometric measures such as height and BMI *z-*score, but also by maintaining lower cardiac afterload as indicated by lower PWV z-scores at all time points in GH-treated patients in the present study. The lack of association of LVMI with GH treatment may reflect the matching criteria for the study population that included matching for ACE/ARBs between GH-treated patients and controls. ACE/ARBs are known to have a direct effect on the heart independent of BP control, which could explain the lack of difference in LVMI between the GH-treated and non-treated patients. Still, LVMI levels remained stable in GH-treated patients at the end of the 12-month observation period. On the other hand, LVMI significantly increased in controls during the observation period.
The present study has several strengths and limitations. Limitations include the small population sample based on cohort data. The 4C study is an international multicenter study, and thus, it is possible that in an observational study, with ample geographical distribution, some differences in practices between centers could have affected the study results. Based on the study inclusion criteria only 34 GH-treated patients had all criteria, including available biosamples in the biobanking, included in the study. Moreover, biosamples before GH treatment initiation were not available to compare changes in sKlotho before and after GH treatment. Information about puberty including the Tanner stage was not available for the study participants. On the other hand, the present study was specifically designed to evaluate over a 12-month period the effects of GH on arterial stiffness and their sustainability in association to changes of FGF23/Klotho axis, and provided important insights on the interactions of GH/IGF1/Klotho system and CV health in CKD. Of note, the interpretation of the mediation analysis model suggests that IGF1 and sKlotho mediate the relationship between GH and PWV in a limited way within an observational context. An RCT comparing treated and untreated children with GH would not be possible to realize. We used the concept of “pragmatic clinical trials” and designed a controlled intervention in an observational study of a “real-world” cohort approach to promote research within real-world settings to yield clinically relevant results [45].
In conclusion, the present study shows a central role of GH treatment on mitigating arterial stiffness assessed by PWV and likely mediated by its stimulating actions on IGF1/sKlotho. The association of GH treatment with improved arterial stiffness remained significant in models including CKD-MBD parameters and CV risk factors, BP and BMI, may suggest its independent beneficial effect on CV morbidity in CKD patients. The data delivered by the present study may provide the basis of evidence for a future prospective multicenter study and stimulate initiatives for collaboration with networks and industry for further research.
Supplementary Material
sfaf231_Supplemental_Files
The reference list from the paper itself. Each links out to its DOI / PubMed record.
- 1Schaefer F, Doyon A, Azukaitis K et al. Cardiovascular phenotypes in children with CKD: the 4C Study. Clin J Am Soc Nephrol 2017;12:19–28. 10.2215/CJN.0109021627827310 PMC 5220645 · doi ↗ · pubmed ↗
- 2Weaver DJ, Mitsnefes M. Cardiovascular Disease in children and adolescents with chronic kidney disease. Semin Nephrol 2018;38:559–69. 10.1016/j.semnephrol.2018.08.00230413251 · doi ↗ · pubmed ↗
- 3Lindberg K, Amin R, Moe OW et al. The kidney is the principal organ mediating klotho effects. J Am Soc Nephrol 2014;25:2169–75. 10.1681/ASN.201311120924854271 PMC 4178446 · doi ↗ · pubmed ↗
- 4Martin A, David V, Quarles LD. Regulation and function of the FGF 23/klotho endocrine pathways. Physiol Rev 2012;92:131–55. 10.1152/physrev.00002.201122298654 PMC 3306265 · doi ↗ · pubmed ↗
- 5Prud'homme GJ, Kurt M, Wang Q. Pathobiology of the Klotho antiaging protein and therapeutic considerations. Front Aging 2022;3:931331. 10.3389/fragi.2022.93133135903083 PMC 9314780 · doi ↗ · pubmed ↗
- 6Saar-Kovrov V, Donners M, van der Vorst EPC. Shedding of Klotho: functional implications in chronic kidney disease and associated vascular disease. Front Cardiovasc Med 2020;7:617842. 10.3389/fcvm.2020.61784233585584 PMC 7876272 · doi ↗ · pubmed ↗
- 7Neyra JA, Hu MC, Moe OW. Klotho in clinical nephrology: diagnostic and therapeutic implications. Clin J Am Soc Nephrol 2021;16:162–76. 10.2215/CJN.02840320 PMC 779264232699047 · doi ↗ · pubmed ↗
- 8Schmid C, Neidert MC, Tschopp O et al. Growth hormone and Klotho. J Endocrinol 2013;219:R 37–57. 10.1530/JOE-13-028524096965 · doi ↗ · pubmed ↗