Clinical and Laboratory Correlates of Cerebral Blood Flow Velocities and Risks for Stroke Among Steady-State Sickle Cell Anemia Children: A Cross-Sectional Study
Oyetoke C Oderanti, Samuel O Oninla, Moshood A Akintola, Olawale A Abayomi, Funso A Olagunju, Funmilola J Adesokan

TL;DR
This study finds that age, height, blood parameters, and stunting are linked to increased stroke risk in children with sickle cell anemia.
Contribution
The study identifies specific clinical and lab parameters that correlate with cerebral blood flow velocity and stroke risk in children with sickle cell anemia.
Findings
Stunted children had higher abnormal blood flow velocities compared to normal-height children.
White blood cell count and packed cell volume are significantly associated with stroke risk.
Age and height negatively correlate with both blood flow velocity and stroke risk.
Abstract
Background Transcranial Doppler (TCD) ultrasound (US) is commonly used to assess cerebral blood flow velocity and identify abnormal flow patterns. Additionally, clinical and laboratory parameters could be useful for the early detection of sickle cell anemia (SCA) patients who are prone to developing stroke, especially in low-income settings. Objectives This study aims to correlate clinical and laboratory parameters with the risk of stroke according to TCD values in children with steady-state sickle cell anemia. Methods This study used a cross-sectional observational design, with study participants (steady-state SCA children, aged 2-14 years) recruited consecutively. The demographic details, general examination findings, frequency of crisis and blood transfusions, and duration of hydroxyurea usage, as well as the participants’ weight, height, and nutritional indices, were recorded.…
Genes, proteins, chemicals, diseases, species, mutations and cell lines named across the full text — each resolved to its canonical identifier and authoritative record.
Click any figure to enlarge with its caption.
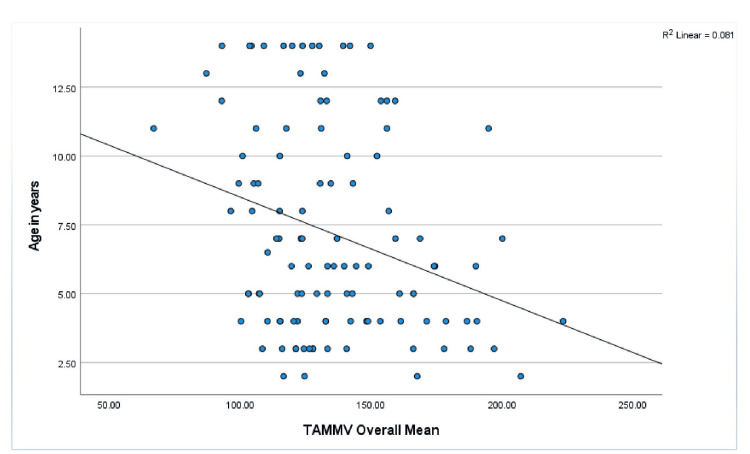 Figure 1
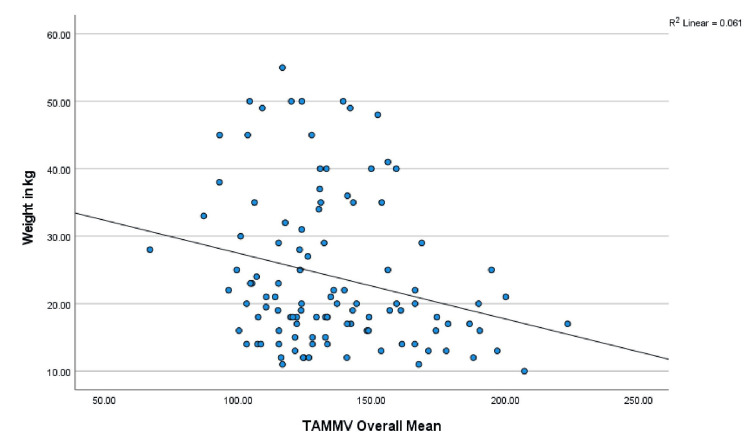 Figure 2
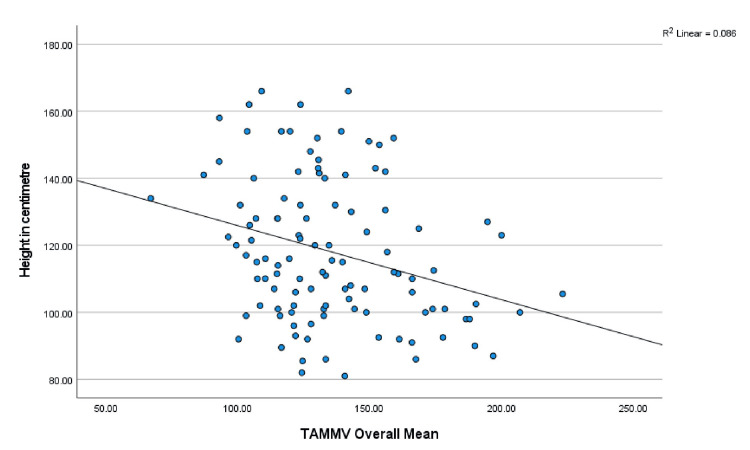 Figure 3
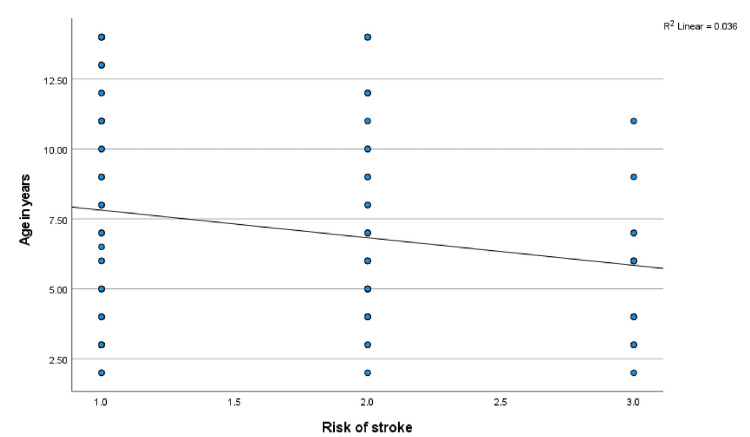 Figure 4
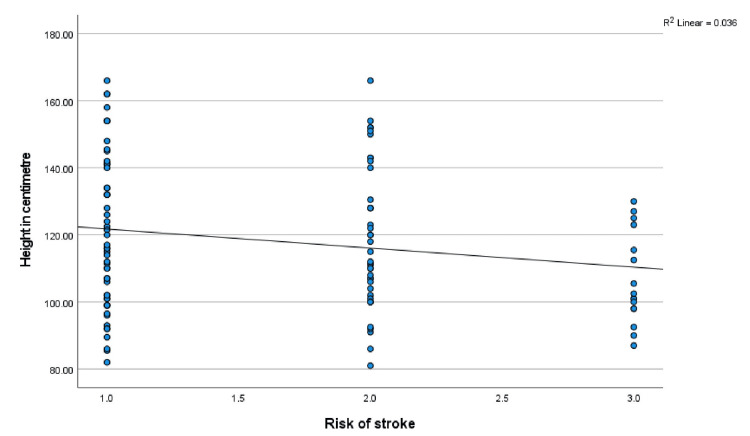 Figure 5
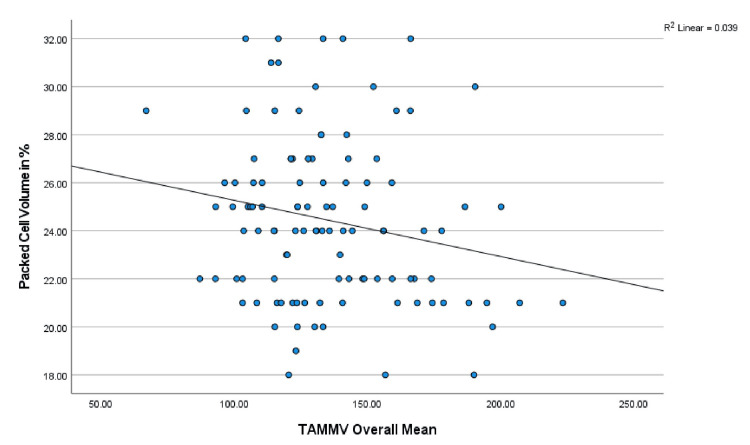 Figure 6
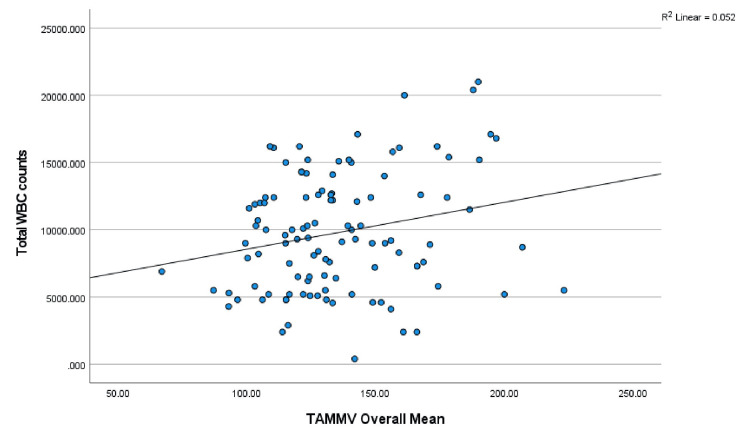 Figure 7
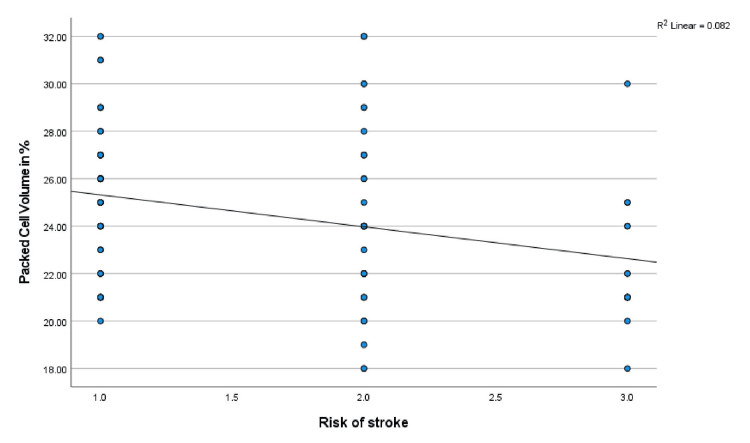 Figure 8
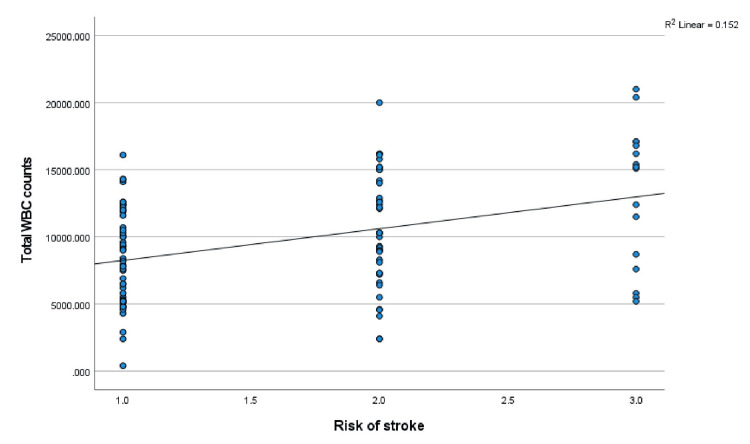 Figure 9
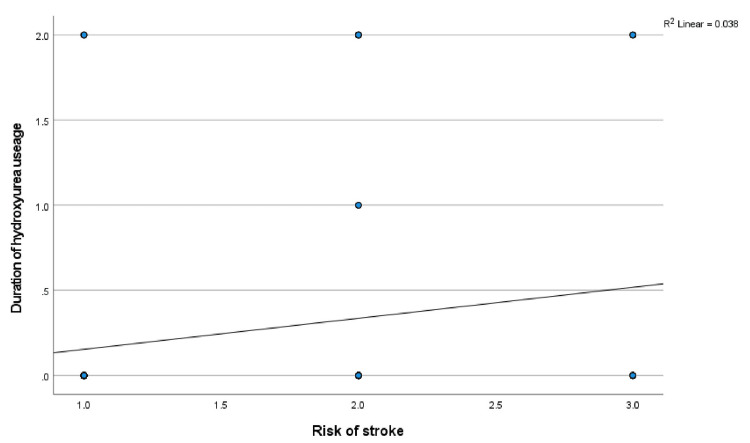 Figure 10
| Nutritional status | Risks for stroke, n (%) | |||||
| Standard | Conditional | High | Total | c2 | p-value | |
| ♦Norm H/A | 53 (52.5) | 35 (34.7) | 13 (12.9) | 101 (100) | 6.252 | 0.044 |
| Stunted | 1 (11.1) | 5 (55.6) | 3 (33.3) | 9 (100) | ||
| Total | 54 (49.1) | 40 (36.4) | 16 (14.5) | 110 (100) | ||
| Body mass index (BMI) | ||||||
| ±Normal weight | 40 (53.3) | 26 (34.7) | 9 (12.0) | 75 (100) | 2.659 | 0.616 |
| Underweight | 7 (46.7) | 5 (33.3) | 3 (20.0) | 15 (100) | ||
| Overweight | 7 (35.0) | 9 (45.0) | 4 (20.0) | 20 (100) | ||
| Total | 54 (49.1) | 40 (36.4) | 16 (14.5) | 110 (100) | ||
| Hematological parameters | Stroke risk types, n (%), Mean ± SD | ||||
| Standard, 54 (49.1%) | Conditional, 40 (36.4%) | High, 16 (14.5%) | F-value | P-value | |
| HbF (%) | 4.46 ± 2.73 | 3.88 ± 2.67 | 5.03 ± 2.60 | 1.163 | 0.316 |
| WBC (x 109 c/l) | 8307.41 ± 3536.11 | 10446.50 ± 4246.66 | 13187.50 ± 5232.57 | 9.654 | 0.000* |
| PCV (%) | 25.222 ± 2.97 | 24.23±3.82 | 22.31 ± 2.77 | 4.985 | 0.009* |
| Duration and frequency (n) | TAMMV Values, Mean ± SD |
|
| |
| None (94) | 134.10 ± 27.61 |
| <6 months (2) | 138.38 ± 21.62 |
| ≥6 months (14) | 144.52 ± 35.74 |
| F-value | 0.815 |
| p-value | 0.445 |
|
| |
| Nil (89) | 134.58 ± 28.92 |
| 1-2 times (17) | 141.24 ± 29.94 |
| 3-5 times (3) | 134.13 ± 17.12 |
| ≥6 times (1) | 123 |
| F-value | 0.311 |
| p-value | 0.817 |
|
| |
| Nil (16) | 147.90 ± 31.74 |
| 1-2 (Mild; 46) | 133.57 ± 28.61 |
| 3-5 (Moderate; 38) | 134.34 ± 28.64 |
| ≥6 (Severe; 10) | 128.98 ± 20.83 |
| F-value | 1.274 |
| p-value | 0.287 |
| Duration and frequency | Risks for stroke, n (%) | |||||
| Standard | Conditional | High | Total | c2 | p-value | |
| Duration of hydroxyurea use | ||||||
| None (94) | 50 (53.2) | 32 (34.0) | 12 (12.8) | 94 (100) | 7.422 | 0.115 |
| <6 mon♦ (2) | 0 (0) | 2 (100) | 0 (0) | 2 (100) | ||
| ≥6 mon♦ (14) | 4 (28.6) | 6 (42.9) | 4 (28.6) | 14 (100) | ||
| Total | 54 (49.1) | 40 (36.4) | 16 (14.5) | 110 (100) | ||
| Frequency of blood transfusion in the preceding 12 months | ||||||
| None | 48 (53.9) | 30 (33.7) | 11 (12.4) | 89 (100) | 11.209 | 0.082 |
| 1-2 times | 5 (29.4) | 7 (41.2) | 5 (29.4) | 17 (100) | ||
| 3-5 times | 0 (0) | 3 (100) | 0 (0) | 3 (100) | ||
| 6 or more | 1 (100) | 0 (0) | 0 (0) | 1 (100) | ||
| Total | 54 (49.1) | 40 (36.4) | 16 (14.5) | 110 (100) | ||
| Frequency of crises in the preceding 12 months | ||||||
| None | 6 (37.5) | 7 (43.80) | 3 (18.8) | 16 (100) | 1.441 | 0.963 |
| 1-2 crises | 24 (52.2) | 16 (34.8) | 6 (13.0) | 46 (100) | ||
| 3-5 crises | 19 (50.0) | 14 (36.8) | 5 (13.2) | 38 (100) | ||
| 6 or more | 5 (50.0) | 3 (30.0) | 2 (20.0) | 10 (100) | ||
| Total | 54 (49.1) | 40 (36.4) | 16 (14.5) | 110 (100) | ||
Peer Reviews
No public reviews on file for this paper yet. If you reviewed it on a platform where reviews are public (OpenReview, ICLR, NeurIPS, ICML), you can paste yours below so the community can read it here.
Videos
No videos yet. Explain this paper in a talk, walkthrough, or lecture? Add one.
Taxonomy
TopicsHemoglobinopathies and Related Disorders · Bone and Joint Diseases · Iron Metabolism and Disorders
Introduction
Sickle cell anemia (SCA) is a common genetic disorder that can be life-threatening [1]. Its life-threatening tendency stems from its severe complications, which include severe anemia, sequestration crisis, strokes, and infections. Among these complications, stroke is the most fearsome complication of sickle cell disease (SCD) [2]. Stroke is defined as a focal neurological deficit resulting from a neurological compromise that persists for more than 24 hours with evidence of a cerebral infarct corresponding to the focal deficit on neuroimaging assessment [3]. Stroke among SCA children is common, with a prevalence of 5%-7% in Nigeria [4,5], and it can be sudden with no warning signs [3]. It affects approximately 10% of patients with homozygous SCD, which is approximately 250 times greater than that in the general pediatric population [5,6]. SCA children are at high risk for stroke, and approximately 11% of them have at least one episode of stroke by 11 years of age [6], or up to 12% by the age of 21 years [7,8]. Some of the predictors of stroke in SCA patients are low fetal hemoglobin concentrations in the blood, abnormal blood flow in cerebral vessels, low hematocrit, and leucocytosis [9,10]. Early detection of SCA patients with a propensity to develop stroke is imperative to achieve good management outcomes [3,11].
In many previous studies, abnormal blood flow velocities in the cerebral arteries of SCA patients have been associated with increased risks of stroke [12,13]. Additionally, studies have shown that patients with higher levels of fetal hemoglobin tend to have normal TCD values and therefore a lower risk for stroke [12-14]. This finding was supported by Hokazono’s study in Sao Paulo, Brazil, which reported a mean HbF level of 18.5 ± 9.3% and a 1.6% high risk of stroke [15], whereas Nigerian studies reported HbF levels between 2.99% and 9.6%, with a high risk for stroke ranging from 4.6% to 10.8% [12,13,16]. However, Steinberg et al., on the other hand, reported no significant associations between HbF concentration and stroke, silent cerebral infarction, or sickle cell vasculopathy in SCD patients [17]. Hydroxyurea (HU) usage also affects cerebral artery velocity, and the use of HU progressively decreases the TCD value over time by increasing the packed cell volume (PCV) and HbF levels [12,18-20].
Stroke is a debilitating illness leading to prolonged morbidity and eventually mortality in SCA patients [11]. Its occurrence in a child with SCA destabilizes the family and increases the burden of care. Therefore, early detection of the risk of stroke in SCA patients via simple, inexpensive, and readily available clinico-laboratory parameters is needed, especially in resource-limited countries. In the literature, however, few studies [9,15] have correlated TCD values with clinical and laboratory parameters, especially in sub-Saharan regions. These studies only correlated clinico-laboratory parameters with TCD values and not with risks for stroke. Additionally, there is no clear identification of clinico-laboratory parameters that can be put together to guide the initiation of stroke preventive measures. Hence, there is a desire to know clinical and laboratory parameters that can predict the risk of stroke. Thus, this study focused on the relationship between risk of stroke and common clinical events, anthropometric measurements, and simple laboratory tests commonly performed in hospitals. The parameters of interest included the frequency of blood transfusions, frequency of crises, hydroxyurea usage, age, weight, height, PCV, WBC counts, and HbF levels to assess their relationship with risks of stroke. To this end, this study aimed to correlate the TCD values and the risks for stroke with the clinical and laboratory parameters of pediatric SCA patients to determine their associations.
Materials and methods
Study design
This study is a prospective, cross-sectional, observational study among steady-state SCA children during routine clinic visits.
Study location and setting
The study was conducted at Ladoke Akintola University of Technology (LAUTECH) Teaching Hospital (LTH), Osogbo, Osun State, Nigeria (now Osun State University Teaching Hospital, Osogbo, Osun State, Nigeria). Steady-state SCA children accessing routine clinic at the pediatric hematologic clinic of the hospital were studied, with ultrasound (US) scans and hematology investigations carried out at the radiology and laboratory departments of the hospital.
Patient recruitment
Steady-state SCA children aged 2-14 years were recruited consecutively for the study, and the inclusion criteria were fulfilled.
Inclusion and Exclusion Criteria
Inclusion criteria: Steady-state children with SCA accessing the sickle cell routine clinic, aged 2-14 years, were included in the study. The steady state in SCA patients is defined as the period when the children with SCA are in an optimal state of health, free from all forms of crisis or other acute complications of SCA in the preceding month [12]. The subjects were assumed to be in a steady state when they satisfied the following criteria: (1) no fever at presentation and at least in the last four weeks, (2) no crisis at presentation and at least in the last four weeks, and (3) not on any medication apart from routine folic acid, vitamin c, proguanil, and those with or without hydroxyurea usage [12]. In addition, only children whose parents or guardians consented and subjects older than seven years assented were included in the study.
The exclusion criteria were children who had any crisis within the last four weeks before data collection, who were on chronic blood transfusion, or who had a stroke in the past. Additionally, children with HbSC or other hemoglobinopathies and children whose parents or guardians did not give consent, or children who were old enough and who refused assents, were excluded.
Sample size determination
The minimum sample size for this study was derived from the Leslie Kish formula: n = z^2^pq/d² [21], and the prevalence (6.9%) of abnormal high-risk blood flow velocity recorded by Oniyangi et al. [13] among patients with sickle cell disease (SCD). In the Leslie Kish formula [21], n represents the sample size calculated, P is the prevalence at 6.9%, q = 1-p, Z is the standard deviation at a 95% confidence level (1.96), and d is the level of precision (5%).
n = 1.96² × 0.069 × 0.931 / 0.05² = 98.7
Therefore, the minimum sample size for this study was 99 steady-state children with SCA.
Data collection
Before data collection, the study protocol was approved by the Ethical Committee of LTH, Osogbo, Nigeria, with the assigned approval number: LTH/EC/2017/04/308. Data for this study were collected between January and July 2018 (six months). The procedures (blood analyses and TCD ultrasound scans) involved in this study were explained to the parents/guardians and some of the study participants (old enough to understand). Thereafter, written informed consent was obtained from all the parents/guardians of the subjects and assent from some of the subjects (older than seven years). A semistructured questionnaire (proforma) culled from previous similar studies [9,15] was used to collect information from the participants. The information obtained included age, sex, genotype, frequency of crisis, frequency of blood transfusions, and usage of hydroxyurea. The data was cross-checked from the study participants’ hospital medical records and reconciled. Additionally, general examination findings, anthropometry measurements, laboratory results, and ultrasound scan assessment findings were recorded in the proforma.
Measurements
The weight and height of each of the study participants were obtained by standard methods. The raw weight and height values were converted into nutritional indices of height for age (H/A), weight for age (W/A), and body mass index (BMI).
During each transcranial Doppler imaging ultrasound velocimetry measurement at the radiology department, the procedure was explained again to both parents and the study participants. All the subjects’ TCD ultrasound scans were performed by a single radiologist, assisted by an ultrasound scanning-trained pediatrician. The study participants were reassured and remained calm, awake, and alert before and during the procedure. The middle and anterior cerebral arteries (MCA and ACA) of the circle of Willis were insonated on both sides of the head through the acoustic window of the temporal bone, which allowed direct visualization of the vessels. Color Doppler was activated with color-coded blood flow to identify the vessels (MCA and ACA). The time-average mean maximum velocity (TAMMV) of blood flow in both arteries (the MCA and ACA) was measured on both sides of the temporal bone and recorded. The procedure took 30 minutes to complete.
The mean velocity (TAMMV value) in centimeters per second (cm/s) for each artery was automatically determined by the TCD imaging ultrasound machine. The overall mean for each of the subjects was derived from the average blood flow velocities in MCA and ACA on both sides of the temporal bone.
Based on the Stroke Prevention Trial (STOP) criteria, where TAMMV values of <170 cm/s indicate standard risk, 170-199 cm/s indicate conditional risk, and ≥200 cm/s indicate high risk [22], each participant’s risk of stroke was assigned. As stroke can occur in any of the cerebral arteries, each participant’s risk of stroke was determined by the highest TAMMV value in any of the insonated arteries.
Hematologic parameters were determined via a Sysmex kx-21 N (hematology autoanalyzer) for full blood count and a CEA996Hu enzyme-linked immunosorbent assay (ELISA) kit by Cloud-Clone Corp, Wuhan, China, for fetal hemoglobin (HbF).
Statistical analysis
The data were analyzed via the Statistical Package for Social Sciences software for Windows, version 26 (IBM SPSS Inc., Chicago, IL). The data are presented in tables and figures. Continuous variables are expressed as the means and standard deviations. Means were compared via Student’s t‑test and analysis of covariance (ANOVA) where appropriate. Comparisons of categorical variables and tests for associations were performed via chi-square tests, and Pearson’s correlation analysis was performed. The level of statistical significance was set at P < 0.05.
Results
A total of 110 steady-state SCA children were studied. Sixty-one (55.5%) participants were males, and 49 (44.5%) were females. The mean age of the study participants was 7.17 ±3.77 years.
Anthropometry
The mean height of the participants was 117 ± 21.97 cm (ranging from 80 to 166 cm), and their weights ranged between 10 and 59 kg, with a mean of 24.20 ± 11.53 kg. The mean and standard deviation (±SD) of H/A and W/A were 97.44 ± 6.55% and 97.38 ± 15.11%, respectively. BMI ranged between 10.60 and 26.30, with a mean of 16.67 ± 2.89. The mid-upper arm circumference of 48 subjects, aged 2-5 years, ranged between 14 and 18 cm, with a mean of 15.62 ± 1.06 cm.
Nutritional status in relation to TAMMV and risk of stroke
About 101 (91.8%) of the subjects had a normal height for age, and nine (8.2%) were stunted. The mean TAMMV value (SD) for the normal height subjects was 133.79 (27.32) cm/s, and it was 154.74 (37.18) cm/s for the stunted height subjects. The difference was statistically significant (t = 2.138, p = 0.035). Seventy-five (68.2%) subjects had normal BMI, 15 (13.6%) had underweight, and 20 (18.2%) were overweight. The mean TAMMV values ± SD of the subjects who had normal BMI (131.58 ±28.88), underweight (141.89 ± 33.62), and overweight (145.41 ±22.88) cm/s were compared, and the comparison yielded no significant differences (∆f = 2.337, p = 0.102). Table 1 shows the prevalence of the various types of risk of stroke in relation to nutritional status. A comparison of the distributions of the various types of risk of stroke between the subjects with a normal height for age and those with stunted height revealed significant differences (p = 0.044), with those with stunted height having a higher prevalence of high risk for stroke. Additionally, subjects who had an abnormal BMI (underweight and overweight) had a relatively greater prevalence of high risk for stroke; however, the difference was not statistically significant.
Age, anthropometry measurements, and nutritional indices correlated with TAMMV and risk of stroke
Age, anthropometry measurements, and nutritional indices were correlated with the mean TAMMV (age: r = -.285, p = 0.003; weight: r = -.247, p = 0.009; W/A: r = .034, p = 0.724; height; r = -.293, p = 0.002; H/A: -.105, p = 0.227; and BMI: r = .014, p = 0.887). Significant negative correlations were observed with age, weight, and height, and Figures 1-3 show scatterplots of the correlations. Additionally, the risks for stroke were correlated with age (r = -.189, p = 0.048), weight (r = -.166, p = 0.083), W/A (r = .034, p = 0.728), height (r = -.191, p = 0.046), and H/A (r = -.115, p = 0.230), and significant negative correlations were observed with age and height (Figures 4, 5 show the scatterplots).
Correlation between TAMMV and age in yearsFigure 1 shows the effect of advancement in age on TAMMV. Pearson’s correlation analysis reveals that as children with SCA increase in age, the cerebral artery velocity decreases significantly.TAMMV: Time-average mean maximum velocity.
Correlation between the TAMMV and weight in kgFigure 2 depicts how weight affects cerebral artery velocity. Pearson’s correlation analysis shows that as children with SCA increase in weight, the cerebral artery velocity decreases significantly.TAMMV: Time-average mean maximum velocity; SCA: Sickle cell anemia.
Correlation between the TAMMV and height in centimetersFigure 3 shows how the height of SCA children is related to the cerebral artery velocity. Pearson’s correlation analysis shows that as the height of children with SCA increases, the cerebral artery velocity decreases significantly.TAMMV: Time-average mean maximum velocity; SCA: Sickle cell anemia.
Correlation between the risk of stroke and age in yearsFigure 4 shows how age variations affect the risk of stroke. Pearson’s correlation analysis reveals that as age increases, the risk of stroke decreases, with the more severe form of risk of stroke significantly prevalent between five and six years of age.
Correlation between the risk of stroke and height in centimetersFigure 5 shows the effect of height on the risk of stroke. Pearson’s correlation analysis reveals that as height increases, the risk of stroke decreases.
Mean hematological parameters, TAMMV, and the risks for stroke
The means of the hematology parameters of the study participants with different stroke risks are shown in Table 2. The white blood cell count increased progressively and significantly as the risk for stroke increased in severity (p = 0.000). However, as the PCV decreased, the risk for stroke increased significantly in severity (p = 0.009).
Correlation of hematological parameters with TAMMV and risk of stroke
Furthermore, the mean TAMMV values were correlated with hematology parameters (PCV, WBC, and HbF) via Pearson’s correlation analysis: PCV: r = -.197, p = 0.039; WBC: r = .227, p = 0.017; and HbF: r = .032, p = 0.737. A significant correlation was established between the TAMMV and both the PCV and WBC. The scatterplots are shown in Figures 6, 7, respectively. Additionally, the risk of stroke was correlated with the following hematology parameters: PCV: r = -.286, p = 0.002; WBC: r = .390, p = 0.001; and HbF: r = .020, p = 0.833. PCV and WBC count were significantly correlated with stroke risk (see Figures 8, 9).
Correlation between TAMMV and PCVFigure 6 shows the effect of PCV levels on the cerebral artery velocity. Pearson’s correlation analysis reveals that as packed cell volume decreases, cerebral artery velocity increases (negative correlation). Thus, decreasing PCV increases the risk of stroke.TAMMV: Time-average mean maximum velocity; PCV: Packed cell volume.
Correlation between TAMMV and WBC countFigure 7 displays the effect of WBC counts on the cerebral artery velocity. Pearson’s correlation analysis reveals that as WBC count increases, cerebral artery velocity increases (positive correlation). Thus, an increasing WBC count increases the risk of stroke.TAMMV: Time-average mean maximum velocity.
Correlation between the risk of stroke and PCVThe effect of variations in the PCV on the risk of stroke is shown in Figure 8. Pearson’s correlation analysis reveals that a decrease in the PCV value progressively worsens the risk of stroke.PCV: Packed cell volume.
Correlation between risks of stroke and WBCThe effect of WBC counts on the risk of stroke is displayed in Figure 9. Pearson’s correlation analysis reveals a positive correlation between WBC count and risk of stroke. Thus, an increasing WBC count progressively increases the risk of stroke.
Relating the mean TAMMV values and risks for stroke with hydroxyurea usage, frequency of blood transfusions, and crises
In Table 3, the mean values of TAMMV related to the duration of hydroxyurea use, blood transfusion frequency, and number of crises were compared. No significant differences were found. Furthermore, Table 4 shows the prevalence of various risks for stroke in relation to hydroxyurea use duration, frequency of blood transfusion, and number of crises, with no statistically significant differences observed.
Clinical parameters correlated with the TAMMV and the risk of stroke
The mean TAMMV values were correlated with the frequency of blood transfusions, number of crises, number of clinic visits in the last 12 months, and duration of hydroxyurea usage. The correlation coefficient and p values are as follows: frequency of blood transfusion: r = -.005, p = 0.956; number of crises: r = -.116, p = 0.229; clinic visits: r = -.061, p = 0.524; and duration of hydroxyurea usage: r = .122, p = 0.203. No significant correlation was observed. Additionally, the risk of stroke was correlated with the frequency of blood transfusion: r = .017, p = 0.862; the number of crises: r = -.062, p = 0.520; clinic attendance: r = -.022, p = 0.823; and duration of hydroxyurea usage: r = .195, p = 0.042. The risk of stroke was significantly correlated with the duration of hydroxyurea use (see Figure 10).
Correlation between risks of stroke and duration of hydroxyurea useFigure 10 shows the relationship between the risk of stroke and hydroxyurea use in this study. Pearson’s correlation analysis reveals that as the risk of stroke increases, the use of hydroxyurea increases (positive correlation).
Discussion
Nutrition is a natural need for all living things, and any lack or overindulgence could predispose an individual to disease conditions. Chronic malnutrition is detrimental to the health of children, especially those suffering from chronic diseases such as SCA. The significantly greater blood flow velocity (TAMMV) and greater risk of stroke among the stunted steady-state SCA children in this study attested to the adverse effects of poor nutrition. This finding is not surprising, as the nonavailability of adequate nutrients places additional stress on the body systems of SCA patients. This finding is similar to that of a study in Jamaica, which reported that increased TAMMV was correlated with height (p = 0.007) but not with height for age or body mass index (BMI) z scores [23]. In contrast, a Northern Nigerian study revealed that severe malnutrition in children with SCA was associated with a lower prevalence of abnormal TCD measurements [24]. The propensity of chronically malnourished subjects to record higher TCD values and a higher prevalence of abnormal risk for stroke in this study could be explained by the fact that malnutrition can exacerbate the severity of SCA complications, such as pain crises, acute chest syndrome, and stroke [25]. This is made possible through the presence of chronic inflammation and oxidative stress, factors that play roles in the development of chronic vasculopathy [26], i.e., stroke predisposing factors.
In this study, age was significantly negatively correlated with the risk of stroke. This finding is similar to the findings of earlier studies showing that children between two and five years of age have a high risk of abnormal TAMMV values and a high risk of stroke [5,9]. The risk is lowest before the age of two years, probably because of the protective influence of fetal hemoglobin on sickling [5,6]. It has been reported that TAMMV values decline progressively with advancing age [9,27], and with this, it was recommended that SCD patients in the first five years of life be priority targets for routine TCD examinations in settings of limited resources [9].
PCV and WBC count are closely related to the tendency of SCA patients to develop stroke. This could be explained by the fact that a low PCV puts patients in hyperdynamic circulation to meet the metabolic (oxygen) needs of the body. In this state, there is an increase in the force of heart contraction and heart rate, thereby leading to an increase in blood flow velocity in the cerebral vessels [10,28]. Low PCV has been reported to predispose SCA patients to stroke occurrence [12,29], and a study reported low hematocrit levels in more than two-thirds of patients with stroke [10]. WBCs, inflammatory cells that promote blood cell adhesion to the vascular endothelium, cause narrowing of the vascular lumen, which increases blood flow velocity. Therefore, the greater the number of WBCs, the greater the blood velocity. George et al. also noted a higher steady-state leucocyte count in more than three-quarters of patients with stroke [10]. This study was unable to establish significant associations or correlations between HbF and the risk of stroke. However, compared with the HbF levels reported in similar studies [12-16], the low mean HbF level (4%) and the high risk of stroke (14.5%) in this study support the fact that a low HbF concentration predisposes SCA patients to the risk of stroke. The failure to demonstrate associations or correlations between HbF and the risk of stroke in this study could stem from the low level of HbF in the present study participants. On the other hand, this study’s findings support Steinberg et al., who reported no significant associations between HbF concentration and stroke, silent cerebral infarction, or sickle cell vasculopathy in SCD patients [17]
The frequency of crises and blood transfusions did not affect the mean TAMMV values or the prevalence of a high risk of stroke. This finding agrees with previous studies that reported no association between disease severity and the presence of elevated TAMMV [12] or the risk of stroke [30]. This is not surprising, as adequate care during each episode of crisis could prevent further complications such as increased blood flow velocity. Part of the care given to SCA patients is blood transfusion, and the availability of blood when the need for transfusion arises helps to prevent severe complications such as stroke. Additionally, in this study, hydroxyurea usage had no significant effect on TAMMV or the prevalence of a high risk for stroke. This could be because only a few study participants were on the drug for a shorter duration. In a study where a significant effect was observed, the study participants were on hydroxyurea for an average of 30 months. [18] Additionally, the fact that hydroxyurea is offered to SCA patients with worsening disease severity or when complications arise will make its effects less pronounced with a shorter duration of usage. This is highlighted in Figure 10, which shows that as the risk of stroke increases, the use of hydroxyurea increases.
Limitations
The limitation of this study stems from the fact that only one of the inflammatory cells (WBCs) was assayed, without platelet or reticulocyte counts, and their inclusion could have provided more insights into the effects of inflammatory cells on SCD morbidity. Additionally, the small number of study participants on hydroxyurea with a shorter duration of usage and the use of the alkaline denaturation method for the HbF assay might have affected the results of this study. The strengths of this study stem from the correlation of clinical and laboratory parameters with both TAMMV and risks of stroke, the identification of parameters associated with risks of stroke, and drawing inferences to guide the initiation of stroke preventive measures.
Conclusions
This study demonstrated that age, height, PCV, WBC count, and stunting status are significantly positively or negatively correlated with TAMMV and the risk of stroke. Therefore, children who have these abnormal laboratory parameters and are malnourished should be given high priority in routine TCD examinations in the setting of limited resources. Additionally, for children between the ages of two and five years who are stunted with high WBC counts and low PCV, TCD examination should be mandatory; if this examination facility is not available, stroke preventive measures should be activated. This proactive measure will facilitate early detection and management of the risk of stroke in SCA patients, especially in resource-limited countries.
The reference list from the paper itself. Each links out to its DOI / PubMed record.
- 1Systematic literature review shows gaps in data on global prevalence and birth prevalence of sickle cell disease and sickle cell trait: call for action to scale up and harmonize data collection J Clin Med Colombatti R Hegemann I Medici M Birkegård C 55381220233768560410.3390/jcm 12175538 PMC 10488271 · doi ↗ · pubmed ↗
- 2Newborn screening for sickle cell disease (SCD) in Awka South East Nigeria J Blood Discord Transfus Ejiofor OS Efobi C Emechebe GO 39892018
- 3Guidelines for the primary prevention of stroke: a guideline for healthcare professionals from the American Heart Association/American Stroke Association Stroke Goldstein LB Bushnell CD Adams RJ 5175844220112112730410.1161/STR.0b 013e 3181 fcb 238 · doi ↗ · pubmed ↗
- 4Strokes in children with sickle cell disease at the National Hospital Abuja Nigeria. Niger J Paediatr Oniyangi O Ahmed P Otuneye OT Okon J Aikhionbare HA Olatunji OO Akano AO 158164402013
- 5Assessment of the risk of stroke in children with sickle cell anemia using transcranial doppler ultrasound with imaging in Northwestern Niger J Paediatr Jibir BW Wudil JU Muuta I Adeodu OO 290297492023
- 6Cerebrovascular accidents in sickle cell disease: rates and risk factors Blood Ohene-Frempong K Weiner SJ Sleeper LA 288294911998 https://pubmed.ncbi.nlm.nih.gov/9414296/9414296 · pubmed ↗
- 7Stroke in a cohort of patients with homozygous sickle cell disease J Pediatr Balkaran B Char G Morris JS Thomas PW Serjeant BE Serjeant GR 3603661201992153828010.1016/s 0022-3476(05)80897-2 · doi ↗ · pubmed ↗
- 8Stroke in children with sickle cell anaemia in Sokoto: a ten-year review Res. J. of Health Sci Jiya NM Ahmad MM Baba J 11312032015 https://rjhs.org/index.php/home/article/view/115