Astragalean819: An Astragalean clade‐specific bait set to resolve phylogenetic relationships in Astragalus
Daniele Buono, Gudrun Kadereit, Diego F. Morales‐Briones

TL;DR
This study creates a specialized DNA bait set to better understand the evolutionary relationships within the large Astragalus plant genus.
Contribution
The novel contribution is the development and validation of a clade-specific bait set (Astragalean819) for the Astragalean clade of Astragalus.
Findings
The bait set recovered an average of 739.3 loci covering 75% of target reference length.
Phylogenetic inference using the bait set provided full support for all nodes and aligned with current subgeneric classifications.
The bait set effectively retrieves informative loci to clarify complex relationships in the Astragalean clade.
Abstract
Astragalus (Fabaceae) is the largest genus of flowering plants, with about 3100 species. Most phylogenies of the genus are based on a few nuclear or plastid loci (with one exception that uses ~100 loci) and usually provide poorly resolved trees and even conflicting subgeneric classifications. Target enrichment can greatly improve phylogenetic resolution, even at recently diverged taxonomic units, by generating sequences for hundreds of phylogenetically informative, putative single‐copy loci. However, a specific bait set for the Astragalean clade is still lacking. In this study, we use transcriptome data from 17 species in the Astragalean clade (of which eight are Astragalus) to identify putative single‐copy nuclear loci to build a bait set for target enrichment. This resulted in 819 exons from 686 genes across the Astragalean clade. The bait set was validated with a phylogenetic study…
Genes, proteins, chemicals, diseases, species, mutations and cell lines named across the full text — each resolved to its canonical identifier and authoritative record.
Click any figure to enlarge with its caption.
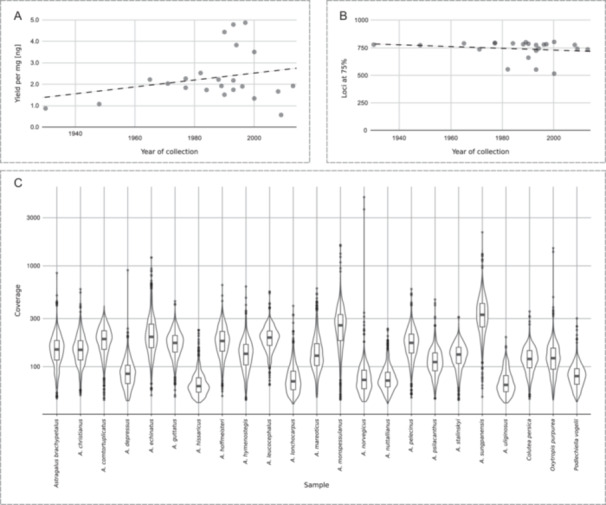 Figure 1
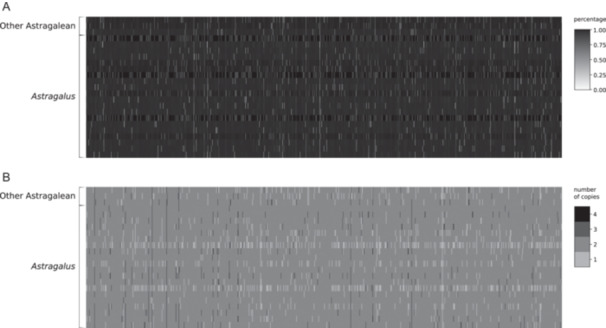 Figure 2
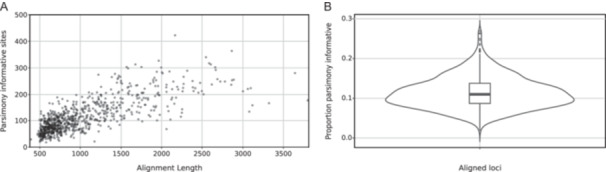 Figure 3
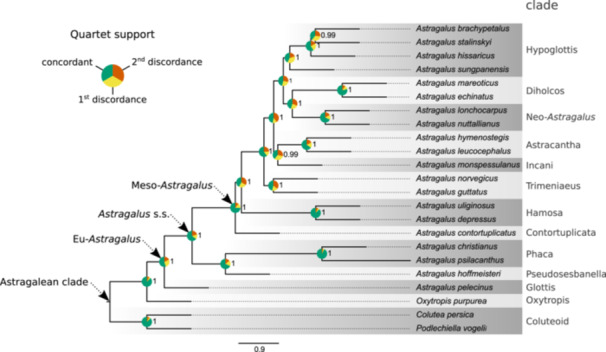 Figure 4
| Species | No. of reads | No. of reads on target (%) | No. of exons with reads | No. of exons with sequences | No. of exons with sequences >50% of the target length | No. of exons with sequences >75% of the target length | No. of exons with paralog warning based on length | No. of exons with paralog warning based on depth | Total no. of bases recovered |
|---|---|---|---|---|---|---|---|---|---|
|
| 13,096,388.00 | 2,197,494 (16.8%) | 819 | 794 | 790 | 780 | 28 | 43 | 757,905 |
|
| 10,890,516.00 | 2,162,531 (19.9%) | 819 | 790 | 784 | 775 | 21 | 30 | 761,679 |
|
| 12,954,696.00 | 2,476,545 (19.1%) | 819 | 798 | 795 | 792 | 23 | 25 | 771,726 |
|
| 3,803,474.00 | 1,081,395 (28.4%) | 819 | 759 | 754 | 738 | 16 | 18 | 722,751 |
|
| 21,947,158.00 | 4,067,973 (18.5%) | 819 | 804 | 801 | 796 | 287 | 373 | 772,437 |
|
| 14,311,544.00 | 2,414,407 (16.9%) | 819 | 798 | 796 | 794 | 16 | 18 | 771,000 |
|
| 5,194,436.00 | 818,111 (15.7%) | 819 | 613 | 594 | 556 | 11 | 12 | 578,916 |
|
| 6,693,262.00 | 2,560,090 (38.2%) | 819 | 796 | 794 | 792 | 17 | 20 | 781,161 |
|
| 8,930,610.00 | 1,986,014 (22.2%) | 819 | 797 | 793 | 784 | 36 | 42 | 761,667 |
|
| 13,467,798.00 | 2,747,841 (20.4%) | 819 | 805 | 805 | 802 | 19 | 20 | 777,093 |
|
| 5,926,928.00 | 1,440,551 (24.3%) | 819 | 728 | 706 | 662 | 216 | 253 | 680,127 |
|
| 9,754,798.00 | 2,638,608 (27%) | 819 | 805 | 804 | 788 | 239 | 293 | 763,911 |
|
| 12,255,330.00 | 4,235,194 (34.6%) | 819 | 786 | 782 | 777 | 24 | 30 | 758,790 |
|
| 6,846,986.00 | 918,944 (13.4%) | 819 | 593 | 580 | 554 | 9 | 12 | 569,157 |
|
| 5,466,098.00 | 1,430,111 (26.2%) | 819 | 763 | 758 | 726 | 300 | 354 | 719,895 |
|
| 8,200,056.00 | 2,252,069 (27.5%) | 819 | 752 | 750 | 745 | 13 | 13 | 721,428 |
|
| 4,518,478.00 | 1,592,032 (35.2%) | 819 | 792 | 791 | 781 | 23 | 31 | 770,313 |
|
| 8,108,134.00 | 1,800,468 (22.2%) | 819 | 789 | 788 | 784 | 19 | 20 | 755,565 |
|
| 15,393,230.00 | 5,932,392 (38.5%) | 819 | 814 | 811 | 805 | 29 | 64 | 787,215 |
|
| 4,429,540.00 | 789,492 (17.8%) | 819 | 544 | 537 | 517 | 10 | 12 | 534,834 |
|
| 7,406,784.00 | 1,663,545 (22.5%) | 819 | 791 | 787 | 778 | 26 | 31 | 759,198 |
|
| 12,328,132.00 | 1,824,155 (14.8%) | 819 | 756 | 752 | 742 | 13 | 23 | 729,177 |
|
| 6,924,508.00 | 1,203,549 (17.4%) | 819 | 746 | 746 | 737 | 16 | 16 | 730,305 |
|
|
|
|
|
|
|
|
|
|
|
|
|
|
|
Peer Reviews
No public reviews on file for this paper yet. If you reviewed it on a platform where reviews are public (OpenReview, ICLR, NeurIPS, ICML), you can paste yours below so the community can read it here.
Videos
No videos yet. Explain this paper in a talk, walkthrough, or lecture? Add one.
Taxonomy
TopicsPlant Ecology and Taxonomy Studies · Botany, Ecology, and Taxonomy Studies · Genetic diversity and population structure
TARGET ENRICHMENT
Currently, sequencing whole genomes is a state‐of‐the‐art technique that is a rich source of information. However, bioinformatic and computational challenges arise when analyzing datasets derived from large genomes, including many plant groups (Zhang et al., 2025). Furthermore, the effort and cost required to obtain whole‐genome data are often unnecessary in phylogenomic studies where an appropriate number of phylogenetically informative, single‐copy loci can be sufficient (Andermann et al., 2020). Using low‐copy or single‐copy nuclear (SCN) genes is highly beneficial for plant phylogenetics because they offer more rapidly evolving loci than the commonly used chloroplast and ribosomal sequences (Small et al., 2004; Zimmer and Wen, 2015). Target enrichment is one of several reduced‐representation strategies focusing on selected single‐copy loci across the genome (Mandel et al., 2014). The data obtained from those hundreds or even thousands of loci can resolve complex phylogenetic scenarios that involve processes such as incomplete lineage sorting or reticulate evolution. Target enrichment allows the sequencing effort to be focused on the desired loci, making this method particularly appropriate for museum and herbarium specimens, where highly degraded and fragmented DNA with sequences less than 100 bp is normally expected (McKain et al., 2018; Brewer et al., 2019; Forrest et al., 2019; Andermann et al., 2020). This method uses short RNA probes (usually 80–120 bp) that hybridize to complementary sequence library fragments (McKain et al., 2018). Hybridized fragments can be bound to magnetic beads and separated from the rest of the library, improving the depth of coverage for the genes of interest. This characteristic makes the method useful for analyzing specific variants, sequencing exomes and large numbers of genes, and inferring genome duplications and orthologous genes.
Probe design was a limitation of target enrichment in the past and was originally focused on highly conserved loci to achieve broad taxonomic coverage (Faircloth et al., 2012; Pezzini et al., 2023). However, the increasing availability of transcriptome sequence data across all major clades has facilitated the design of custom probe sets for specific plant groups (McKain et al., 2018; Vatanparast et al., 2018). Universal probe sets (e.g., Angiosperms353; Johnson et al., 2019) are developed to target mostly highly conserved loci, and while they are very useful in non‐model systems that lack a reference genome, they may not be able to provide enough data to resolve relationships in cases where introgression and low sequence divergence occur (Chau et al., 2018; Yardeni et al., 2022). When rapid radiation occurs, lineage‐specific probe sets can thus provide a higher amount of useful data to resolve shallow phylogenetic relationships (e.g., Eserman et al., 2021; Siniscalchi et al., 2021). Additionally, hybridization efficiency depends on the similarity between probes and target genomic regions (Cronn et al., 2012). Taxon‐specific probes, designed using genetic data obtained from a few species in the clade of interest, show higher performance compared to universal probe sets because they are less biased toward more conserved regions and provide higher resolution at a finer taxonomic scale, recovering more genomic variation (Pezzini et al., 2023).
THE MEGA‐GENUS ASTRAGALUS
Astragalus L. (Fabaceae) belongs to the large Papilionoideae subfamily (~14,000 species; LPWG, 2017) in the so‐called inverted repeat–lacking clade (Wojciechowski et al., 2004). The genus is considered the largest in the flowering plants, with approximately 3100 species (POWO, 2024), which is about 800 more than the second‐largest genus, Taraxacum F. H. Wigg (Asteraceae; Moonlight et al., 2024). Most of the species (~2600) occur in the Eastern Hemisphere (Old World), and about 500 species are exclusive to the Western Hemisphere (New World) (Welsh, 2007; Podlech and Zarre, 2013). Although Astragalus has attracted considerable scientific attention and has been the focus of extensive research, a well‐supported phylogeny and comprehensive explanation for its remarkable diversity remain elusive. Numerous attempts have been made to resolve the backbone phylogeny of the genus using various molecular markers. Among the most recent studies, Azani et al. (2017, 2019) built a representative phylogeny (comprising 150 and 189 Astragalus species, respectively) of most clades in the Eastern Hemisphere based on nuclear ITS and plastid trnK/matK. In the present study, we follow the clade nomenclature established by Azani et al. (2017), who identified 11 well‐supported major clades within a monophyletic Eu‐Astragalus, which includes the Glottis clade (comprising the genus Biserrula L.) and Astragalus sensu stricto. Despite this framework, their phylogeny suffered from poor resolution and several polytomies at shallow levels (Azani et al., 2017). Analyses of whole‐plastome sequences have also been attempted (e.g., Su et al., 2021); however, those often produce discordant topologies compared to nuclear phylogenies (Soltis and Kuzoff, 1995; Záveská et al., 2019; Maylandt et al., 2024).
Folk et al. (2024) reconstructed the largest phylogeny of the genus so far based on a selection of 100 loci designed to target sequences of the whole nitrogen‐fixing clade (Soltis et al., 1995) as part of the NitFix sequencing initiative (Kates et al., 2024). This notable effort included around 850 Astragalus species, including ~370 species exclusive to the Western Hemisphere, known as Neo‐Astragalus, and ~470 Eastern Hemisphere species. Their results, however, were hindered by poor resolution, especially at shallow nodes, particularly in Neo‐Astragalus. Even though the main clades recovered by Folk et al. (2024) overlapped partially with previous phylogenetic studies (Azani et al., 2017; Su et al., 2021), many nodes still conflicted with them (e.g., a paraphyletic Eu‐Astragalus with the segregation of the Biserrula genus from Astragalus, or Neo‐Astragalus being sister to the Hypoglottis and Diholcos clades). Given its remarkable species richness, widespread distribution across semi‐arid regions of the Northern Hemisphere, and exceptionally high diversification rates (Folk et al., 2024), Astragalus represents an ideal model clade for investigating phylogenetic diversity at shallow evolutionary scales (Cavender‐Bares, 2019). However, the absence of a comprehensive and well‐supported phylogeny remains a major limitation for studies seeking to uncover the processes driving its lineage diversification.
OBJECTIVES
In this study, we had two goals: (1) to investigate the DNA quality obtained from historical to recent herbarium specimens of Astragalus and its usability for high‐throughput sequencing, and (2) to investigate the capability of a custom bait set for target enrichment, Astragalean819, to build a robust phylogeny of Astragalus, focusing on relationships at the subgeneric level. In regard to the first goal, plant material from herbarium collections is an invaluable resource when studying large groups, especially when the sampling areas are logistically or politically inaccessible (e.g., for Astragalus; Folk et al., 2024). Here, we leveraged the large, near‐complete Astragalus collection of the Botanische Staatssammlung München herbarium, which includes about 22,000 specimens with a worldwide distribution. For our second aim, the Astragalean819 bait set included 819 putative single‐copy loci derived from transcriptome data of Astragalean taxa. We expected that the combination of a large number of nuclear targets and taxon‐specific probe design would deliver the first fully resolved backbone phylogeny for the genus. Custom bait sets like this one are increasingly recognized as powerful tools in evolutionary biology, enabling high‐resolution phylogenomic analyses even from degraded or historical DNA sources. Their broad applicability across related taxa offers enormous potential for addressing questions of diversification, biogeography, and trait evolution at various taxonomic scales. Target enrichment was tested using genomic DNA extracted from herbarium specimens as old as 95 years, representing all of the sections currently supported by molecular data in the genus, as well as three species from other genera within the Astragalean clade.
METHODS
Bait set design
To design our custom bait set for the Astragalean clade (sensu Sanderson and Wojciechowski, 1996), we identified putative SCN genes using MarkerMiner v.1.2 (Chamala et al., 2015) with default settings, except that the minimum transcript length was set to 500 bp. We used transcriptomes of 17 species (eight from representatives of Astragalus and nine from other genera across the Astragalean clade; Zhao et al., 2021) (Appendix S1, see Supporting Information with this article), as well as the genomes of Cicer arietinum L. (Varshney et al., 2013), Medicago truncatula Gaertn. (Tang et al., 2014), and Trifolium pratense L. (De Vega et al., 2015) as references. MarkerMiner was run individually using the same parameters for each of the three reference genomes. SCN genes identified with MarkerMiner were further filtered and split into exons using GoldFinder (Vargas et al., 2019), requiring genes with a minimum length of 500 bp and coverage of at least three species. This resulted in 1361, 1414, and 1276 filtered genes using C. arietinum, M. truncatula, and T. pratense as reference, respectively. To avoid potential chimeric sequences from paralogous copies during the assembly of multi‐exon genes (Morales‐Briones et al., 2018), we selected loci on an exon rather than a gene basis. If loci selection resulted in several exons of the same gene, we did not assemble them together; rather, we treated each exon as its own evolutionary unit for phylogenetic analysis. For exon selection, GoldFinder results for each MarkerMiner run were first merged using the Arabidopsis thaliana (L.) Heynh. gene names, resulting in 2109 shared and unique genes identified from each reference. Individual exon alignments from those 2109 genes were first filtered to keep only those of at least 500 bp, resulting in 3359 exons from 929 genes. Individual exon FASTA files were realigned using MACSE v.2.06 (Ranwez et al., 2018) to correct codon frames and visually inspected in GENEIOUS v.11.1.5 (https://www.geneious.com) to remove potential misassemblies from the starts or ends of the alignments. Additionally, exon alignments were filtered to include only those at least 500 bp in length and with pairwise identity between 75% and 98% across the alignment. Final exon selection was done by prioritizing identical shared exons among all three references, resulting in 819 exons from 686 genes across the Astragalean clade. For bait design, we filtered the 819 exon alignments to include only two sequences, one from a species of Astragalus and one from a species of any other genus within the Astragalean clade. The custom set of 80‐bp biotinylated RNA baits (myBaits) was manufactured by Daicel Arbor Biosciences (Ann Arbor, Michigan, USA) with a 2× tiling density, and the final kit included 36,572 baits. To assess the overlap with the “universal” Angiosperms353 bait set, we identified the corresponding Arabidopsis thaliana gene names reported by Johnson et al. (2019) and matched them with the gene names from the output of MarkerMiner. Similarly, we identified loci shared with the NitFix bait set (Kates et al., 2024) by manually searching the identical sequences from the NitFix target file into the Arabidopsis thaliana coding DNA sequence file provided by MarkerMiner.
DNA isolation, library preparation, and sequencing
We selected 23 species to represent the 10 major clades recognized in Astragalus by Azani et al. (2017), Su et al. (2021), and Folk et al. (2024). Herbarium specimens were preferred based on recency, certainty of determination, and visual assessment of preservation (greener specimens were favored). DNA was extracted from ~20 mg of dry herbarium plant material using the NucleoSpin Plant II kit (Macherey‐Nagel, Düren, Germany), following the manufacturer's manual with the following modifications: (1) in step 2a, cell lysis was performed using 600 μL of buffer PL1, no RNase A was added because the plant material was too old to preserve significant amounts of RNA (which would have interfered with the next steps), and incubation lasted for 1.5 h; (2) in step 6, an extra washing was performed, adding 350 μL of buffer PW2 before drying the membrane completely; and (3) DNA was eluted in 50 μL of buffer PE (5 mM Tris/HCl, pH 8.5). DNA concentration was measured using an Invitrogen Qubit 4 Fluorometer with the High Sensitivity (HS) assay kit (Thermo Fisher Scientific, Waltham, Massachusetts, USA), and fragmentation was visually evaluated on a 1% agarose gel. For all samples, regardless of the fragmentation observed on the agarose gel, genomic DNA was diluted to 250 ng in 55 μL of buffer PE and sonicated using the same program with a Covaris M220 Focused‐ultrasonicator (Covaris, Woburn, Massachusetts, USA) to obtain DNA fragments of approximately 350 bp. We accurately profiled the sonicated sample size distribution using an Agilent 4150 TapeStation System with the High Sensitivity D1000 ScreenTape (Agilent Technologies, Santa Clara, California, USA). Libraries were prepared using the NEBNext Ultra II DNA Library Prep Kit for Illumina and the NEBNext Multiplex Oligos for Illumina (Dual Index Primers Set 1; New England Biolabs, Ipswich, Massachusetts, USA), following the manufacturer's protocol. Because we used ~250 ng of starting DNA, we performed a size selection of adapter‐ligated DNA (step 3 of the protocol), adjusting by the average sample size measured with TapeStation for each sample, as recommended by the manufacturer's protocol. The adapter‐ligated DNA was amplified with eight PCR cycles, and each library was profiled using the Qubit and TapeStation, as described above.
Individual libraries were mixed in 16 sample pools (the second pool included additional libraries, which were used in another study) using the same DNA amounts (250 ng) for each library and pooling together libraries with similar average fragment sizes (ranging from 277 to 526 bp). Pooled libraries were dried by vacuum centrifugation and then resuspended in 7 μL of nuclease‐free water. Target enrichment was performed using the myBaits Hybridization Capture Kits (Arbor Biosciences), following the manufacturer's protocol (v.5.02). The hybridization temperature (T H) and wash temperature (T W) were both set at 60°C. The enriched libraries were amplified with 10 PCR cycles. After amplification, the pooled libraries were purified using the NucleoSpin Gel and PCR Clean‐up Kit (Macherey‐Nagel) and characterized by measuring concentration and fragment sizes using the Qubit and TapeStation. The two enriched pools were again pooled in equimolar quantities (7 nM) and sequenced at the Core Facility Genomics of the Helmholtz Zentrum München, Germany (Deutsches Forschungszentrum für Gesundheit und Umwelt). Sequencing was performed on an Illumina NextSeq 1000 sequencing system with 150‐bp paired‐end reads, aiming for 1000× coverage per sample.
Assembly and phylogenetic inference
Raw read quality control was performed using FastQC v.0.11.8 (Andrews, 2010) and MultiQC v.1.19 (Ewels et al., 2016). Duplicated reads (identical or nearly identical sequences with some mismatches from PCR) were removed using ParDRe v.2.2.5, with the default setting of zero allowed mismatches (González‐Domínguez and Schmidt, 2016). To cut sequencing adapters and poor‐quality sequences, we used Trimmomatic v.0.39 (parameters: ILLUMINACLIP: TruSeq_ADAPTER: 2:30:10 SLIDINGWINDOW: 4:5 LEADING: 5TRAILING: 5 MINLEN: 25) (Bolger et al., 2014). Quality control of deduplicated and clean reads was done with FastQC and MultiQC, and loci were assembled with HybPiper v.2.1.5 (Johnson et al., 2016). The percentage similarity threshold for the sliding window (‐‐exonerate_hit_sliding_window_thresh option) and the percent identity threshold for retaining Exonerate hits (‐‐thresh option) were set to 85, the option ‐‐chimeric_stitched_contig_edit_distance was set to 0, and ‐‐chimeric_stitched_contig_discordant_reads_cutoff was set to 1. The target file (option ‐t_dna) consisted of all the Astragalean sequences for 819 loci used for bait design. We used Diamond v.2.1.8 (Buchfink et al., 2021) to map reads to the target loci and used the paralog_retriever function included in HybPiper to obtain coding sequences from putative alternative long paralogs. Sequences were aligned using MACSE v.2.07 (Ranwez et al., 2018), and AMAS was used to assess the informativeness of individual loci (Borowiec, 2016). To remove sites that showed missing data, we used Pxclsq v.1.3 (Brown et al., 2017) by setting the minimum column occupancy to 0.1 (10%). Gene trees were inferred using IQ‐TREE v.2.3.0 (Minh et al., 2020) with standard model selection for ModelFinder (option ‐m TEST; Kalyaanamoorthy et al., 2017) and 1000 Ultrafast bootstrap replicates for node support. We masked tips in the gene trees that were either monophyletic or paraphyletic, and retained the tip with the most unambiguous characters in the trimmed alignment (Yang et al., 2015). We used TreeShrink v.1.3.9 (Mai and Mirarab, 2018) to remove abnormally long branches using a quantile value of 0.1 and excluding outgroups. Final homologous FASTA files were generated from those trees and aligned using OMM MACSE v.12.01 (Ranwez et al., 2018). Homologous gene trees were then generated from those sequences using IQ‐TREE with the same settings as above. To infer a coalescent‐based species tree, we used ASTRAL‐Pro3 v1.19.3.5 (Zhang and Mirarab, 2022), using the final homologous trees as input, as this tool allows for multi‐copy genes, and setting the option ‘‐‐support 2’ to obtain local posterior probabilities (LPP) and quartet scores for each internal node. To estimate the amount of off‐target chloroplast data in our raw reads, we used Fast‐Plast v.1.2.9 (McKain and Wilson, 2017) and attempted to assemble plastome sequences, using default settings and Fabales for read mapping (‐‐bowtie_index). A more detailed phylogenetic analysis was performed by Buono et al. (2025a), including additional taxa.
RESULTS
Selected loci and bait set testing
A list of the 686 genes included in the Astragalean819 bait set is provided in Appendix S2. The 819 exons belonging to those 686 genes had a cumulative length (capture space) of 796,855 bp, with an average exon length of 972.96 bp (ranging from 417 to 3798 bp). We obtained an overlap of 43 loci with Angiosperms353 and 88 loci with NitFix (Appendix S2). DNA extractions were successful for all 23 specimens tested, with yields ranging from 650 to 5600 ng of genomic DNA (Figure 1A, Appendix S3). Fragmentation was assessed on agarose gel (results not shown) and was very high, especially for the oldest specimens (the oldest being from 1930; Appendix S3). Nevertheless, profiles of the enriched libraries matched the expected size (ranging from ~200 to ~600 bp, with peaks around 350 bp; results not shown) and concentration (~11 and ~16 ng/µL). Sequencing was successful for all samples, with raw sequences ranging between 2.8 million and 13.8 million.
Genomic DNA and targeted genes recovered from herbarium material. (A) Scatter plot showing genomic DNA yield obtained from one milligram of dry leaf compared with specimen age. A weak trend was observed (dashed line, R 2 = 0.067). (B) Scatter plot showing loci recovered with at least 75% of the target sequence length vs. specimen age. A non‐significant effect of age on the loci recovered was observed (R 2 = 0.033). (C) Violin plot showing average mapped locus coverage per sample. A logarithmic scale for coverage was used to enhance the clarity of the plot.
Assembly and alignment statistics
HybPiper assembly statistics are summarized in Figure 2 and Table 1. We obtained high percentages of targeted genes (Figure 2A), and all 819 targeted loci were mapped on the reads for all samples (Table 1). On average, across all samples, we obtained 9,515,168.9 reads (4,757,584 paired reads, as we used paired‐end reads), of which 2,184,065.7 (23.0%) were mapped to sequences using DIAMOND (ranging from 13.4% for A. norvegicus Weber to 38.5% for A. sungpanensis E. Peter; Table 1). No strong correlation was found between the number of raw reads sequenced and the age of the specimens (R ^2^ = 0.078; Appendix S4). This resulted in an average locus depth of coverage higher than 100× for most samples (Figure 1C). The average number of loci recovered with sequences more than 75% of the mean target length (i.e., the number of exons with sequences >75% of the target length) was 739.3, ranging from 517 (A. uliginosus L.) to 805 (A. leucocephalus Graham ex Benth.) (Table 1, Figure 1B). We observed a negligible effect of sample age on the number of loci at 75% (R ^2^ = 0.033; Figure 1B). We obtained, on average, 76.2 paralog warnings per sample, based on sequencing depth, ranging from 12 (A. hissaricus Lipsky, A. norvegicus, A. uliginosus) to 373 (A. echinatus Murray; Table 1, Figure 2B). Finally, on average, the total number of bases recovered was 727,663.0, ranging from 534,834 (A. uliginosus) to 787,215 (A. sungpanensis), with sequences retrieved from all 819 exons belonging to 686 genes. We were able to assemble partial plastome sequences from off‐target regions using Fast‐Plast, obtaining, on average, 64.5% of the known angiosperm chloroplast gene sequences across samples, ranging from 3.7% (A. monspessulanus L.) to 80.2% (six samples; Appendix S5). Alignment statistics obtained with AMAS are summarized in Figure 3 (for complete results, see Appendix S6). On average, across loci, we observed 6.8% of missing data (ranging from 0% to 40.8%). The number of variable sites per locus ranged from 63 to 873 (average 252.8), with an average of 113.7 parsimony‐informative sites (ranging from 18 to 423). This resulted in an average of 11.4% parsimony‐informative sites across all loci (ranging from 1.8% to 26.9%).
Heatmaps showing the results of the HybPiper assembly. (A) The length of the retrieved loci is represented as the percentage relative to the reference. (B) Number of paralogs flagged in each locus.
Parsimony‐informative sites in sequences retrieved by HybPiper. (A) Scatter plot showing the number of parsimony‐informative sites against the alignment length. (B) Violin plot showing the distribution of the proportion of parsimony‐informative sites across all aligned loci (average 11.4%, ranging from 1.8% to 26.9%).
Phylogenetic inference
We obtained a coalescent‐based phylogeny using ASTRAL‐Pro3 from 819 homologous gene trees, which was fully supported (LPP = 1) for all but two nodes (LPP = 0.99) (Figure 4). Quartet topologies were mostly concordant with the species tree for most of the nodes, with an average of 60.6% (ranging from 39.3% to 92.6%) for the concordant topology and 18.6% (ranging from 3.8% to 36.9%) and 20.8% (ranging from 3.5% to 39.4%) for the two discordant alternatives. We recovered a monophyletic Eu‐Astragalus, comprising all Astragalus species included in 11 clear infrageneric clades, albeit with a very limited number of taxa to represent them, which exhibited a strong overlap with previous studies (Azani et al., 2017; Su et al., 2021; Folk et al., 2024).
Coalescent species tree inferred by ASTRAL‐Pro based on 819 homologous gene trees. Numbers to the right of nodes indicate local posterior probability. Pie charts at internal nodes indicate the percentage of quartets in gene trees that agree with the shown main topology (green; average 60.6%, minimum 39.3%, maximum 92.6%), the first alternative topology (yellow; average 18.6%, minimum 3.9%, maximum 36.9%), and the second alternative topology (orange; average 20.8%, minimum 3.5%, maximum 39.4%). Section names follow Azani et al. (2017).
DISCUSSION
In the present work, we explored the possibility of obtaining a strong phylogenetic signal to resolve subgeneric relationships in Astragalus by using genomic DNA obtained from herbarium material and an Astragalean‐specific bait set for target enrichment. Herbarium specimens were the sole source of genomic DNA, and despite some specimens being more than 50 years old (notably, A. nuttallianus DC. was collected in 1930), we were able to obtain a sufficient amount of genomic DNA (with a minimum of 650 ng). There was no apparent correlation between age and genomic DNA yield (Figure 1A), although our sampling was biased towards more recent specimens, with only a few (26%) collected before 1980. The observed high fragmentation (results not shown) was expected (McKain et al., 2018; Brewer et al., 2019; Forrest et al., 2019; Andermann et al., 2020); nevertheless, there was no apparent negative trend between specimen age and the number of loci recovered (Figure 1B). Additionally, because the bait set was designed using transcriptomes from several Astragalean taxa, no differences were observed between Astragalus species and the three Astragalean species in terms of genomic DNA yield and loci recovered (Table 1).
In Astragalus, many phylogenetic studies have relied on a few nuclear/plastid markers, such as ITS and matK (e.g., Kazempour Osaloo et al., 2005; Dizkirici et al., 2014; Azani et al., 2017, 2019; Duan et al., 2024), which have the advantage of being quite conserved among taxa and thus easy to amplify and sequence using Sanger sequencing (Baldwin et al., 1995; Shaw et al., 2014). Additionally, because of their ubiquitous usage, many sequences are available online, including for many Astragalus species. On the other hand, their conserved nature becomes a disadvantage when the goal is to obtain a sufficient resolution to resolve a shallow phylogeny (i.e., at low taxonomic levels or rapidly diverging lineages) (Small et al., 2004). As a result, the attempts to produce a strongly supported and well‐resolved backbone phylogeny in Astragalus using ITS/matK have been unsuccessful, probably also due to the relatively recent radiation of the genus ~16 Mya (12.27–20.76 Mya; Azani et al., 2019). Moreover, whole‐plastome phylogenies, like the one produced by Su et al. (2021), are limited because plastomes evolve in a manner similar to a single gene (Doyle, 2022). Additionally, while biparental plastid inheritance has been observed in some legumes (Rajora and Mahon, 1995; Zhang et al., 2003; Matsushima et al., 2008), the mode of organellar inheritance in Astragalus is still unknown. The higher level of sequence variation in low‐copy nuclear loci makes their use preferable compared to organellar genes, which are biparentally inherited (Small et al., 2004). In this context, target enrichment offers an easy way to obtain multiple single‐copy loci across the whole genome of Astragalean species.
Loci with high variability, low number of paralogs, and long average length are desirable for phylogenomics (McKain et al., 2018; Ning et al., 2024). Although our alignment statistics showed high sequence divergence and informativeness (Figure 3), we obtained paralog warnings from HybPiper based on depth for several samples (Table 1). Interestingly, the most paralog warnings were generated for species belonging to the Diholcos clade (A. mareoticus Delile and A. echinatus) and the Neo‐Astragalus clade (A. lonchocarpus Torr. and A. nuttallianus) (Table 1). The paralogy observed can be attributed to whole‐genome duplication events across the phylogeny of Fabaceae (e.g., Zhao et al., 2021). In a study by Folk et al. (2024) designed to target taxa in the whole nitrogen‐fixing clade (NitFix; Kates et al., 2024), the low phylogenetic resolution may have been caused by high levels of paralogy resulting from the use of a more general bait set in a group where polyploidy is quite common. Overall, plants exhibit a high prevalence of paralogous genes, and a proper evaluation of their effect and orthology inference is necessary (Morales‐Briones et al., 2022). A clade‐specific bait set facilitates orthology inference more effectively than a more general or universal one. Evaluation of the paralogy in our dataset is explored in Buono et al. (2025a) as it goes beyond the scope of this study; however, here we used a coalescent‐based method that addresses paralogy and orthology during tree inference.
We obtained a high number of targeted sequences per sample (Table 1). Additionally, by using off‐target sequences, we were able to obtain chloroplast sequences (Appendix S5), similar to studies on other plant groups (e.g., Baldwin et al., 2023; Bratzel et al., 2023). Even though we could not assemble entire plastomes, the sequences recovered may still contain enough information to build a robust phylogeny (Granados‐Mendoza et al., 2020; Bentz and Leebens‐Mack, 2024). Based on their different recombination dynamics, the recovered plastome sequences should be treated as a single gene using a concatenated approach, rather than as an average multi‐intron gene (Doyle, 2022). The usability of plastome sequences for phylogenetic inference is evaluated in a separate study (Buono et al., 2025a).
The coalescent‐based species tree inferred with Astral‐Pro based on 819 homologous gene trees had full support for all nodes (LPP ≥ 0.99; Figure 4). Additionally, the topology we obtained largely aligns with previous works (Su et al., 2021; Folk et al., 2024), and there is a close overlap between the clades recovered and those proposed by Azani et al. (2017). Among the most significant discrepancies we observed with Folk et al. (2024) are the placement of Neo‐Astragalus taxa inside the Diholcos clade instead of as an independent clade and the inclusion of the Glottis clade (here represented by Astragalus pelecinus (L.) Barneby) inside Eu‐Astragalus. The placement of those two clades in our tree instead aligns with the results of Azani et al. (2017). To better understand intrageneric relationships within Astragalus, such as the placement of the Glottis clade, a much denser sampling across clades is required (see Buono et al., 2025a). Nonetheless, our current results demonstrate that Astragalean819 has the potential to obtain a robust backbone phylogeny and provide enough data to analyze complex relationships within the genus. We estimated an overlap of 88 loci with NitFix and 43 loci with Angiosperms353 (Appendix S2). This overlap suggests that, once missing data are accounted for, newly produced Astragalean819 data can be combined with publicly available datasets from previous studies, thereby significantly increasing the sampling size, as shown in previous studies (Siniscalchi et al., 2021). A final consideration regarding our sequencing effort is the decision to target approximately 1000× coverage for the enriched libraries. Although such high coverage likely exceeded what was strictly necessary to recover all targeted loci, it proved advantageous in complex cases. Specifically, previous work has demonstrated that higher sequencing depth facilitates the successful assembly of multiple paralogous copies in groups with histories of whole‐genome duplications (Morales‐Briones et al., 2022). Therefore, determining the appropriate sequencing depth in future studies should be guided by the complexity of the clade and the specific research goals.
With the present work, we demonstrated that (1) herbarium material is a reliable source of genomic DNA for reconstructing Astragalus phylogeny using target enrichment methods, as already shown by Folk et al. (2024), and (2) the 819 putative single‐copy loci targeted by Astragalean819 contain strong phylogenetic information, enabling the recovery of a robust phylogeny of Astragalus. The bait set we developed represents a valuable resource for future research on the evolutionary history of the largest genus of flowering plants. Because the probes were designed from representatives across the whole Astragalean clade, they are broadly transferable and will facilitate phylogenomic and macro‐evolutionary studies throughout the group, opening new opportunities to explore diversification, biogeography, and trait evolution, while unlocking the vast and underutilized genomic potential stored in herbarium collections worldwide.
AUTHOR CONTRIBUTIONS
D.F.M.B. and G.K. conceived the idea. D.B. and D.F.M.B. performed the experiments and conducted formal analyses. All authors contributed to the scientific discussion and the final manuscript draft, and all authors approved the final version of the manuscript.
Supporting information
Appendix S1: Transcriptomes of species belonging to the Astragalean clade generated by Zhao et al. ( 2021) and utilized for bait design in this study. Appendix S2: List of genes included in the Astragalean819 bait set. Reference gene names correspond to Cicer arietinum (CA), Medicago truncatula (MT), and Trifolium pratense (TP) used as reference. The respective gene name for Arabidopsis thaliana (AT) is provided. The inclusion of the same genes in Angiosperms353 (Johnson et al., 2019) and NitFix (Kates et al., 2024) is indicated. Appendix S3: Voucher information of samples and results of genomic DNA extractions.
Appendix S4: Variation in the number of raw reads sequenced from each specimen according to specimen age. The dashed line represents the trend line (R² = 0.078). Appendix S5: Summary of plastome assembly statistics. Appendix S6: AMAS statistics produced from raw homologous sequences.
The reference list from the paper itself. Each links out to its DOI / PubMed record.
- 1Andermann, T. , M. F. Torres Jiménez , P. Matos‐Maraví , R. Batista , J. L. Blanco‐Pastor , A. L. S. Gustafsson , L. Kistler , et al. 2020. A guide to carrying out a phylogenomic target sequence capture project. Frontiers in Genetics 10: e 1407.10.3389/fgene.2019.01407 PMC 704793032153629 · doi ↗ · pubmed ↗
- 2Andrews, S. 2010. Fast QC: A quality control tool for high throughput sequence data. Website: http://www.bioinformatics.babraham.ac.uk/projects/fastqc/ [accessed 8 September 2025].
- 3Azani, N. , A. Bruneau , M. F. Wojciechowski , and S. Zarre . 2017. Molecular phylogenetics of annual Astragalus (Fabaceae) and its systematic implications. Botanical Journal of the Linnean Society 184(3): 347–365.
- 4Azani, N. , A. Bruneau , M. F. Wojciechowski , and S. Zarre . 2019. Miocene climate change as a driving force for multiple origins of annual species in Astragalus (Fabaceae, Papilionoideae). Molecular Phylogenetics and Evolution 137: 210–221.31102688 10.1016/j.ympev.2019.05.008 · doi ↗ · pubmed ↗
- 5Baldwin, B. G. , M. J. Sanderson , J. M. Porter , M. F. Wojciechowski , C. S. Campbell , and M. J. Donoghue . 1995. The ITS region of nuclear ribosomal DNA: A valuable source of evidence on angiosperm phylogeny. Annals of the Missouri Botanical Garden 82: 247–277.
- 6Baldwin, E. , M. Mc Nair , and J. Leebens‐Mack . 2023. Rampant chloroplast capture in Sarracenia revealed by plastome phylogeny. Frontiers in Plant Science 14: e 1237749.10.3389/fpls.2023.1237749 PMC 1049797337711293 · doi ↗ · pubmed ↗
- 7Bentz, P. C. , and J. Leebens‐Mack . 2024. Developing Asparagaceae 1726: An Asparagaceae‐specific probe set targeting 1726 loci for Hyb‐Seq and phylogenomics in the family. Applications in Plant Sciences 12(5): e 11597.39360194 10.1002/aps 3.11597 PMC 11443443 · doi ↗ · pubmed ↗
- 8Bolger, A. M. , M. Lohse , and B. Usadel . 2014. Trimmomatic: A flexible trimmer for Illumina sequence data. Bioinformatics 30(15): 2114–2120.24695404 10.1093/bioinformatics/btu 170PMC 4103590 · doi ↗ · pubmed ↗