A systems-level insight into PHB-driven metabolic adaptation orchestrated by the PHB-binding transcriptional regulator AniA (PhaR)
Antonio Lagares, Elizaveta Krol, Tina Jühling, Timo Glatter, Anke Becker

TL;DR
This study reveals how the PHB-binding regulator PhaR coordinates bacterial carbon metabolism and gene expression in response to nutrient conditions.
Contribution
The study provides a systems-level view of PhaR's role as a metabolic sensor and regulator in PHB metabolism and global gene expression.
Findings
PhaR regulates exopolysaccharide production and central carbon metabolism in response to PHB accumulation.
PHB acts as a metabolic integrator linking nutrient availability to transcriptional responses.
PhaR controls TCA cycle entry and Entner-Doudoroff pathway genes in both free-living and symbiotic states.
Abstract
Poly(3-hydroxybutyrate) (PHB) is a carbon and energy storage polymer, whose accumulation under nutrient imbalances with excess carbon is common in bacteria. PhaR is a conserved transcriptional regulator that associates with PHB granules in several species. Although its role in modulating PHB storage and metabolism has been extensively studied across the bacterial phylogeny, a systems-level view of PhaR’s dual function as a metabolic sensor and regulator is lacking. Here, we integrated co-expression network analysis with proteome profiling across multiple mutant backgrounds (lack of PhaR [AniA] and/or PHB synthesis) in the free-living state of the PHB-accumulating α-proteobacterial root nodule symbiont Sinorhizobium meliloti. This analysis was enriched by identifying direct regulatory targets of PhaR through a regulon-centric computational multistep search for DNA-binding site motifs…
Genes, proteins, chemicals, diseases, species, mutations and cell lines named across the full text — each resolved to its canonical identifier and authoritative record.
Click any figure to enlarge with its caption.
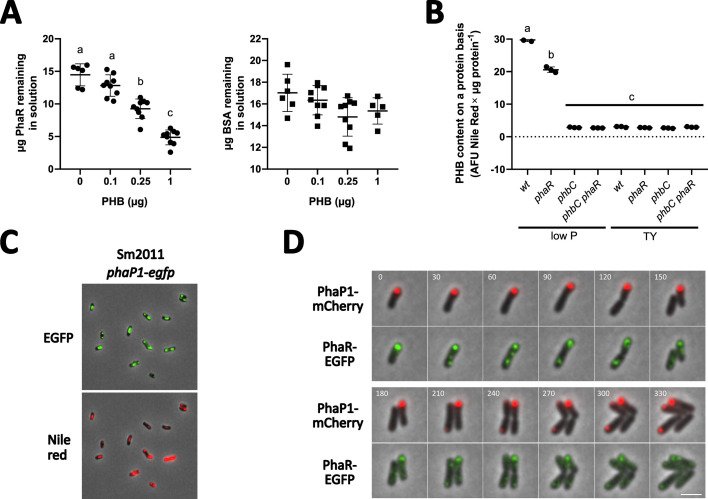 Fig 1
Fig 1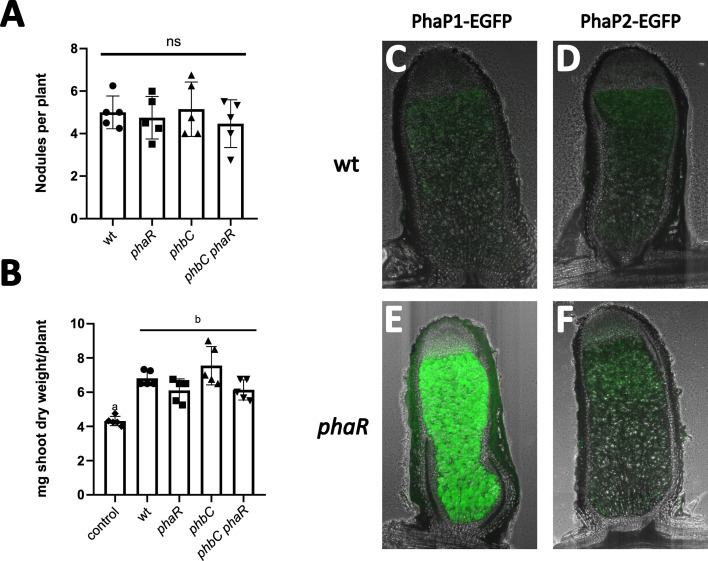 Fig 2
Fig 2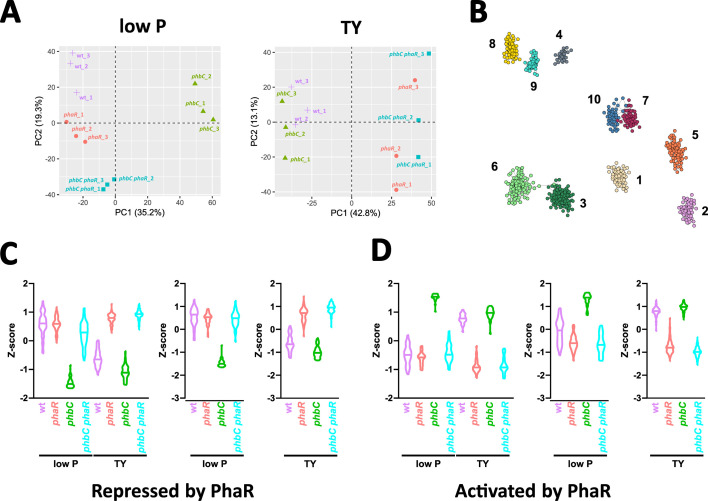 Fig 3
Fig 3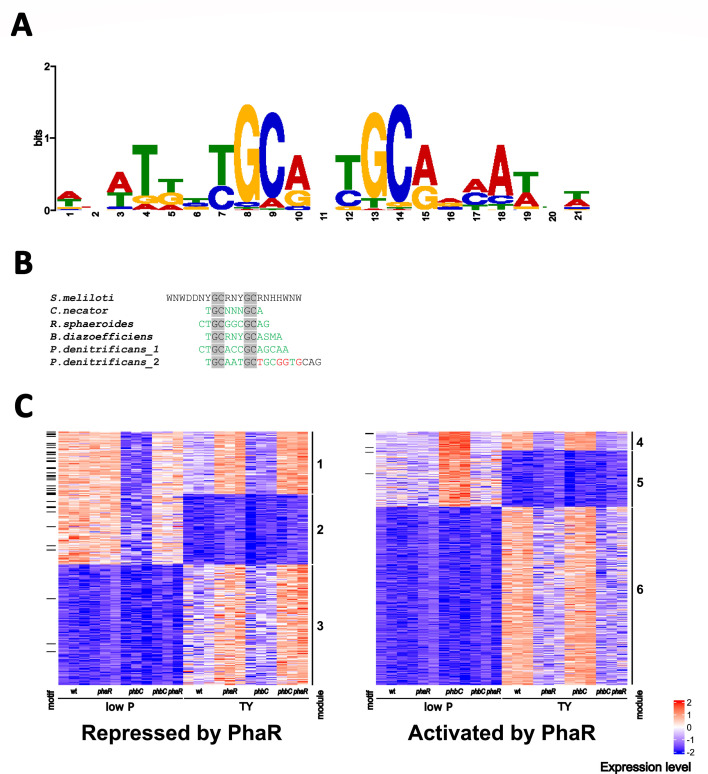 Fig 4
Fig 4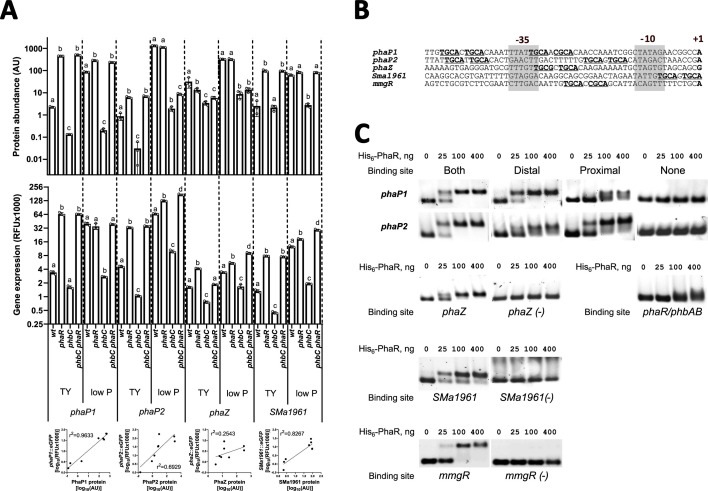 Fig 5
Fig 5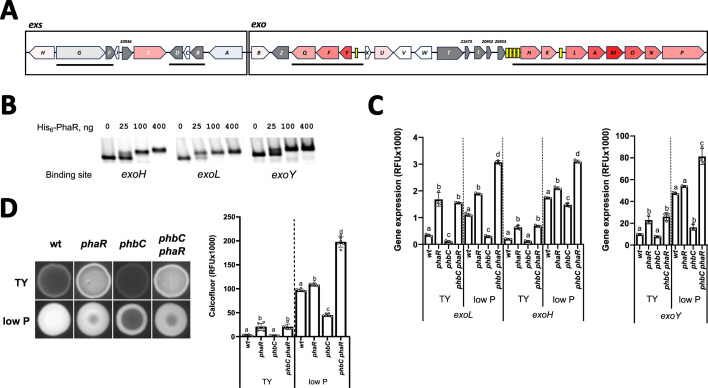 Fig 6
Fig 6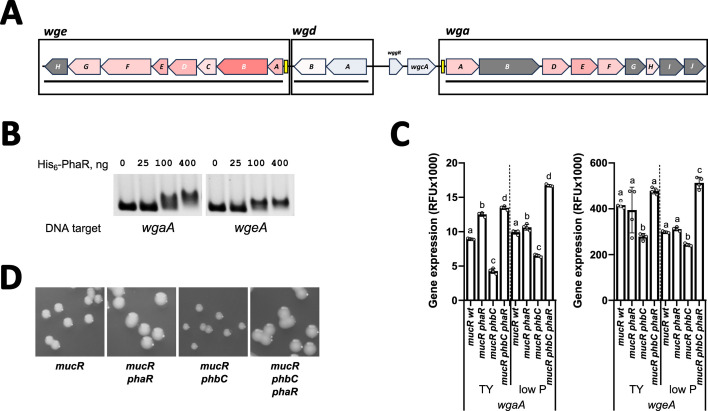 Fig 7
Fig 7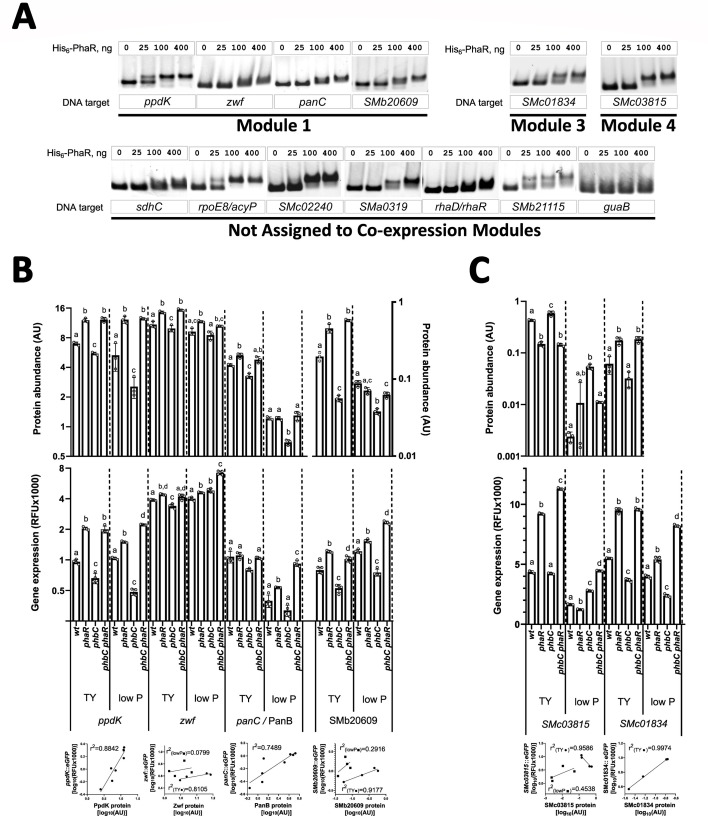 Fig 8
Fig 8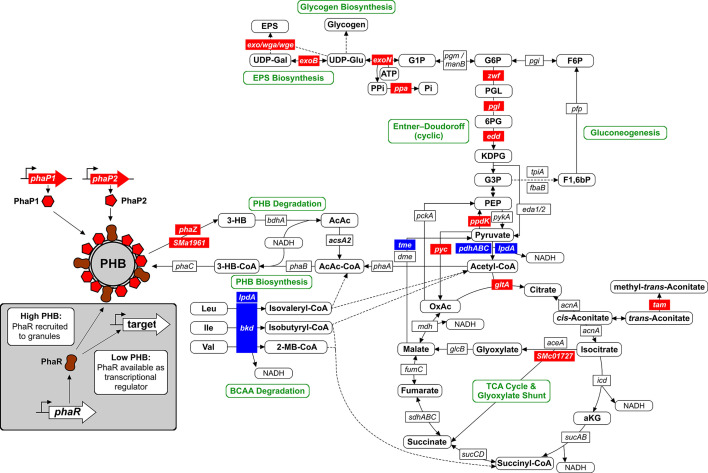 Fig 9
Fig 9| Strain or plasmid | Properties | Reference |
|---|---|---|
| Sm2011 | Wild type, Strr | ( |
| Rm101 | Sm2011, | ( |
| | Sm2011 ∆ | This work |
| | Sm2011 ∆ | This work |
| | Sm2011 ∆ | This work |
| | Rm101 ∆ | This work |
| | Rm101 ∆ | This work |
| | Rm101 ∆ | This work |
| Sm2011 PhaP1-EGFP | Sm2011 | This work |
| Sm2011 PhaP2-EGFP | Sm2011 | This work |
| Sm2011 PhaR-EGFP | Sm2011 | This work |
| DH5a | F– | ( |
| S17-1 | ( | |
| BL21 (DE3) | ( | |
| Plasmids | ||
| pK18mob:: | ( | |
| pK18mob2-EGFP | ( | |
| pSRKKm-EGFP | pSRKKm carrying EGFP coding sequence, Kmr | ( |
| pWH844 | Protein expression vector containing N-terminal His-tag sequence Ampr | ( |
| pPHU-EGFP | pPHU231 carrying EGFP coding sequence. Tcr | ( |
| pLK114 | pPHU-EGFP with promoter region of | ( |
| pLK115 | pPHU-EGFP with promoter region of | ( |
| pPhaRdel | pK18mob:: | This work |
| pPhbCdel | pK18mob:: | This work |
| pPhaP1-EGFP | pK18mob2-EGFP carrying C-terminal portion of PhaP1 | This work |
| pPhaP2-EGFP | pK18mob2-EGFP carrying C-terminal portion of PhaP2 | This work |
| pPhaR-EGFP | pK18mob2-EGFP carrying C-terminal portion of PhaR | This work |
| pWH844-phaR | pWH844 carrying | This work |
| pPHU-PhaP1prCDS-mCherry | pPHU231 carrying complete | This work |
| pBBRKm-EGFP | pSRKKm carrying EGFP coding sequence, EcoRI fragment containing | This work |
| pPHU-phaP1-EGFP | pPHU-EGFP with promoter region of | This work |
| pPHU-phaP1-EGFP-proximal | pPHU-EGFP with promoter region of | This work |
| pPHU-phaP2-EGFP | pPHU-EGFP with promoter region of | This work |
| pPHU-phaP2-EGFP-proximal | pPHU-EGFP with promoter region of | This work |
| pPHU-1961-EGFP | pPHU-EGFP with promoter region of | This work |
| pPHU-phaZ1-EGFP | pPHU-EGFP with promoter region of | This work |
| pPHU-phaR-EGFP | pPHU-EGFP with promoter region of | This work |
| pPHU-guaB-EGFP | pPHU-EGFP with promoter region of | This work |
| pSRKKm-exoY-EGFP | pSRKKm-EGFP with promoter region of | This work |
| pSRKKm-exoL-EGFP | pSRKKm-EGFP with promoter region of | This work |
| pSRKKm-exoH-EGFP | pSRKKm-EGFP with promoter region of | This work |
| pSRKKm-ppdK-EGFP | pSRKKm-EGFP with promoter region of | This work |
| pSRKKm-03815-EGFP | pSRKKm-EGFP with promoter region of | This work |
| pSRKKm-02240-EGFP | pSRKKm-EGFP with promoter region of | This work |
| pSRKKm-01834-EGFP | pSRKKm-EGFP with promoter region of | This work |
| pSRKKm-20609-EGFP | pSRKKm-EGFP with promoter region of | This work |
| pSRKKm-panC-EGFP | pSRKKm-EGFP with promoter region of | This work |
| pSRKKm-sdhC-EGFP | pSRKKm-EGFP with promoter region of | This work |
| pSRKKm-smb21115-EGFP | pSRKKm with promoter region of | This work |
| pBBRKm-rhaD-EGFP | pBBRKm-EGFP with promoter region of | This work |
| pBBRKm-zwf-EGFP | pBBRKm-EGFP with promoter region of | This work |
| pBBRKm-0319-EGFP | pBBRKm-EGFP with promoter region of | This work |
| pBBRKm-PacyP-EGFP | pBBRKm with promoter region of | This work |
| Gene name | Protein function | Module | Log2( | |
|---|---|---|---|---|
| Low P | TY | |||
|
| Probable transcriptional regulator syrB3 | 1 |
| 0.42 |
|
| Thiolase | 1 |
| 0.44 |
|
| Nonspecific acid phosphatase | 1 | 0.43 |
|
|
| ABC transporter, periplasmic solute-binding protein | 1 |
|
|
|
| Aminotransferase | 1 |
| 0.27 |
|
| Poly(3-hydroxybutyrate) depolymerase, EC 3.1.1.- | 1 |
|
|
|
| Histidine kinase, EC 2.7.13.3 | 1 |
|
|
|
| Putative two-component response regulator protein | 1 |
|
|
|
| Uncharacterized protein | 1 |
|
|
|
| Putative acetyltransferase, cysElacA/lpxA/nodL family protein, EC 2.3.1.- | 1 | 0.44 |
|
|
| Exopolysaccharide production protein ExoF | 1 |
|
|
|
| Succinoglycan biosynthesis protein ExoH | 1 |
|
|
|
| Endo-1,3-1,4-β-glycanase ExoK, EC 3.2.1.- | 1 |
|
|
|
| Succinoglycan biosynthesis protein ExoL, EC 2.-.-.- | 1 |
|
|
|
| Succinoglycan biosynthesis protein ExoO, EC 2.4.-.- | 1 |
|
|
|
| UTP-glucose-1-phosphate uridylyltransferase, EC 2.7.7.9 | 1 |
|
|
|
| Succinoglycan biosynthesis transport protein ExoP | 1 |
|
|
|
| Putative stomatin-like protein | 1 | 0.38 |
|
|
| Probable pilin glycosylation protein | 1 |
|
|
|
| Putative glycosyltransferase protein | 1 | 0.48 |
|
|
| Uncharacterized protein | 1 |
|
|
|
| Pyruvate phosphate dikinase, EC 2.7.9.1 | 1 |
|
|
|
| β-Lactamase, EC 3.5.2.6 | 1 |
| 0.47 |
|
| (S)-2-haloacid dehalogenase, EC 3.8.1.2 | 1 |
|
|
|
| Trans-aconitate 2-methyltransferase, EC 2.1.1.144 | 1 |
|
|
|
| Putative oxidoreductase transmembrane protein | 1 | 0.22 |
|
|
| Hypothetical signal peptide protein | 1 | 0.38 |
|
|
| PHB phasin 1 | 1 |
|
|
|
| Hypothetical signal peptide protein | 1 | 0.29 |
|
|
| Probable carboxymethylenebutenolidase, EC 3.1.1.45 | 1 | 0.23 |
|
|
| Uncharacterized protein | 1 |
| 0.31 |
|
| UPF0229 protein | 1 | 0.21 |
|
|
| AAA_PrkA domain-containing protein | 1 | 0.34 |
|
|
| Carbohydrate kinase, EC 2.7.1.- | 1 |
| 0.21 |
|
| Putative isocitrate lyase family protein | 1 |
| 0.20 |
|
| 3-Methyl-2-oxobutanoate hydroxymethyltransferase, EC 2.1.2.11 | 1 |
|
|
|
| Urease subunit b, EC 3.5.1.5 | 1 |
|
|
|
| Urease subunit γ, EC 3.5.1.5 | 1 |
|
|
|
| Uncharacterized protein | 1 |
|
|
|
| Citrate synthase, EC 2.3.3.16 | 1 |
|
|
|
| PHB phasin 2 | 1 |
|
|
|
| Putative fructose transport system kinase, EC 2.7.1.33 | 1 |
| 0.26 |
|
| Probable glycine betaine ABC transporter, periplasmic substrate-binding component | 1 |
| 0.30 |
|
| Manganese ABC transporter periplasmic substrate binding protein | 1 |
|
|
|
| LysM domain-containing protein | 1 | 0.22 |
|
|
| IIA component of PTS system | 1 | 0.27 |
|
|
| Efflux pump membrane transporter | 1 | 0.30 |
|
|
| Putative multidrug efflux system | 1 | 0.40 |
|
|
| Phosphogluconate dehydratase, EC 4.2.1.12 | 1 | 0.34 |
|
|
| 6-Phosphogluconolactonase, 6PGL, EC 3.1.1.31 | 1 | 0.13 |
|
|
| Inorganic pyrophosphatase, EC 3.6.1.1 | 1 |
|
|
|
| Pyruvate carboxylase, EC 6.4.1.1 | 1 |
|
|
|
| Hypothetical transcription regulator protein | 1 |
|
|
|
| 3-Isopropylmalate dehydrogenase, EC 1.1.1.85 | 1 | 0.35 |
|
|
| Ribonuclease VapC, RNase VapC, EC 3.1.-.- | 1 | 0.06 |
|
|
| Hypothetical signal peptide protein | 1 | 0.05 |
|
|
| Histidine ammonia-lyase, EC 4.3.1.3 | 2 |
| ND |
|
| Sulfate adenylyltransferase subunit 2, EC 2.7.7.4 | 2 |
| ND |
|
| Periplasmic nitrate reductase, electron transfer subunit | 2 |
| ND |
|
| Cupin_2 domain-containing protein | 2 |
| ND |
|
| Uncharacterized protein | 2 |
| ND |
|
| Uncharacterized protein | 2 |
| ND |
|
| Putative transcriptional regulator, araC family protein | 2 |
| ND |
|
| Exopolysaccharide production protein ExoQ | 2 |
| ND |
|
| Exopolysaccharide production protein ExoY | 2 |
| ND |
|
| ATP-grasp domain-containing protein | 2 |
| ND |
|
| Putative calcium-binding exported protein | 2 |
| ND |
|
| Uncharacterized protein | 2 |
| ND |
|
| Putative MPA1 family auxiliary surface saccharide export protein, EC 2.7.10.1 | 2 |
| ND |
|
| Putative polysaccharide export outer membrane protein | 2 |
| ND |
|
| Putative membrane protein WgeE (Formerly ExpE5) | 2 |
| ND |
|
| Putative glycosyltransferase WgeD | 2 |
| ND |
|
| Putative bifunctional glycosyltransferase WgeB | 2 |
| ND |
|
| Putative Ca2+-binding protein WgeA | 2 |
| ND |
|
| Putative membrane-anchored protein WgaE | 2 |
| ND |
|
| Uncharacterized protein | 2 |
| ND |
|
| Putative C6 polyol ABC transporter, permease component | 2 |
| ND |
|
| Uncharacterized protein | 2 |
| ND |
|
| Biotin transport regulator | 2 |
| ND |
|
| HWE_HK domain-containing protein | 3 | ND |
|
|
| Oxidoreductase | 3 | ND |
|
|
| Aminotransferase | 3 | ND |
|
|
| ABC transporter, ATP-binding protein | 3 | ND |
|
|
| Amino acid oxidase | 3 | ND |
|
|
| L-2,4-diaminobutyrate decarboxylase, EC 4.1.1.86 | 3 | ND |
|
|
| Putative transport protein | 3 | ND |
|
|
| Putative cytochrome o ubiquinol oxidase chain I protein, EC 1.10.3.- | 3 | ND |
|
|
| Hypothetical transmembrane protein | 3 | ND |
|
|
| Hypothetical transmembrane protein | 3 | ND |
|
|
| Trk system potassium uptake protein | 3 | ND |
|
|
| Histidine kinase, EC 2.7.13.3 | 3 | ND |
|
|
| Glutathione-dependent peroxiredoxin, EC 1.11.1.27 | 3 | ND |
|
|
| Integrase | 3 | ND |
|
|
| Putative NAD-dependent formate dehydrogenase δ subunit, EC 1.2.1.2 | 3 | ND |
|
|
| Fatty acid CoA ligase, EC 6.2.1.- | 4 | −0.49 |
|
|
| Epimerase | 4 | −0.29 |
|
|
| RepA2 replication protein | 4 |
| −0.44 |
|
| Probable 4-hydroxyproline 2-epimerase, EC 5.1.1.8 | 4 |
| −0.42 |
|
| Putative enoyl-CoA hydratase protein, EC 4.2.1.17 | 4 | −0.28 |
|
|
| Putative α-L-arabinofuranosidase protein, EC 3.2.1.55 | 4 |
|
|
|
| 7-Cyano-7-deazaguanine synthase, EC 6.3.4.20 | 4 |
|
|
|
| Putative organic hydroperoxide resistance protein | 4 |
| −0.46 |
|
| Putative methionine ABC transporter, periplasmic solute-binding protein | 4 |
|
|
|
| Uncharacterized protein | 4 |
|
|
|
| Methylmalonate-semialdehyde dehydrogenase, EC 1.2.1.27 | 4 |
|
|
|
| Fe3+ ABC transporter | 4 |
| −0.17 |
|
| PNPLA domain-containing protein | 4 |
|
|
|
| Pyruvate dehydrogenase E1 component subunit b, EC 1.2.4.1 | 4 |
| −0.27 |
|
| Dihydrolipoyllysine-residue acetyltransferase E2 component of pyruvate dehydrogenase complex, EC 2.3.1.12 | 4 |
| −0.16 |
|
| NADP-dependent malic enzyme, NADP-ME, EC 1.1.1.40 | 4 |
| −0.48 |
|
| Ribosome hibernation promotion factor, HPF | 4 |
| −0.23 |
|
| Putative hydrolase | 4 |
| −0.47 |
|
| Putative methionine ABC transporter, ATP-binding component | 4 |
|
|
|
| 2-Oxoisovalerate dehydrogenase E1 component α- subunit of branched-chain α-keto acid dehydrogenase, EC 1.2.4.4 | 4 |
|
|
|
| 2-Oxoisovalerate dehydrogenase E1 component b subunit of branched-chain α-keto acid dehydrogenase, EC 1.2.4.4 | 4 |
|
|
|
| Dihydrolipoamide acetyltransferase component of pyruvate dehydrogenase complex, EC 2.3.1.- | 4 |
|
|
|
| Dihydrolipoyl dehydrogenase, EC 1.8.1.4 | 4 |
|
|
|
| 50S ribosomal subunit assembly factor BipA, EC 3.6.5.- | 4 |
| −0.34 |
|
| Putative non-heme chloroperoxidase, EC 1.11.1.10 | 4 |
|
|
|
| Putative ATP binding ABC transporter | 4 |
|
|
|
| Putative NADH dehydrogenase transmembrane protein, EC 1.6.99.3 | 4 |
| −0.27 |
|
| Phosphomethylpyrimidine synthase ThiC, EC 4.1.99.17 | 5 |
| ND |
|
| Thiazole synthase ThiG, EC 2.8.1.10 | 5 |
| ND |
|
| Hydroxymethylpyrimidine/phosphomethylpyrimidine kinase ThiD, EC 2.7.1.49 | 5 |
| ND |
|
| Putative membrane protein | 5 |
| ND |
|
| Protein required for diacylglyceryl-N,N,N-trimethylhomoserine biosynthesis | 5 |
| ND |
|
| Uncharacterized protein | 5 |
| ND |
|
| Short-chain alcohol dehydrogenase-related dehydrogenase | 6 | ND |
|
|
| Gluconolactonase/regucalcin homolog | 6 | ND |
|
|
| Short-chain alcohol dehydrogenase-related dehydrogenase | 6 | ND |
|
|
| Uncharacterized protein | 6 | ND |
|
|
| Uncharacterized protein | 6 | ND |
|
|
| ABC transporter, periplasmic solute-binding protein | 6 | ND |
|
|
| ABC transporter, periplasmic solute-binding protein | 6 | ND |
|
|
| Sensor histidine kinase | 6 | ND |
|
|
| ABC transporter, periplasmic solute-binding protein | 6 | ND |
|
|
| Dehydrogenase, FAD-dependent | 6 | ND |
|
|
| GabD3 succinate-semialdehyde dehydrogenase, EC 1.2.1.16 | 6 | ND |
|
|
| Alcohol dehydrogenase, EC 1.1.1.- | 6 | ND |
|
|
| ABC transporter, ATP-binding protein | 6 | ND |
|
|
| Spermidine/putrescine import ATP-binding protein PotA, EC 7.6.2.11 | 6 | ND |
|
|
| Isomerase | 6 | ND |
|
|
| Permease | 6 | ND |
|
|
| Uncharacterized protein | 6 | ND |
|
|
| ABC transporter, periplasmic solute-binding protein | 6 | ND |
|
|
| ABC transporter, ATP-binding protein | 6 | ND |
|
|
| ABC transporter, periplasmic solute-binding protein | 6 | ND |
|
|
| Thiamine pyrophosphate-requiring protein | 6 | ND |
|
|
| Uncharacterized protein | 6 | ND |
|
|
| Diaminobutyrate-2-oxoglutarate aminotransferase, EC 2.6.1.76 | 6 | ND |
|
|
| Rhizobactin receptor (TonB-dependent siderophore receptor RhtA) | 6 | ND |
|
|
| ABC transporter, ATP-binding protein | 6 | ND |
|
|
| Putative oxidoreductase, EC 1.-.-.- | 6 | ND |
|
|
| 2-Oxoglutarate dehydrogenase E1 component (α-ketoglutarate dehydrogenase) | 6 | ND |
|
|
| ABC transporter, periplasmic solute-binding protein | 6 | ND |
|
|
| Putative acetoin catabolism regulatory protein | 6 | ND |
|
|
| Probable FAD-dependent oxidoreductase, EC 1.14.13.8 | 6 | ND |
|
|
| Probable dehydrogenase, EC 1.17.1.4 | 6 | ND |
|
|
| Uncharacterized protein | 6 | ND |
|
|
| Histidine kinase, EC 2.7.13.3 | 6 | ND |
|
|
| S-(hydroxymethyl)glutathione dehydrogenase, EC 1.1.1.284 | 6 | ND |
|
|
| S-formylglutathione hydrolase, EC 3.1.2.12 | 6 | ND |
|
|
| Putative cytochrome c protein | 6 | ND |
|
|
| Putative cytochrome c protein | 6 | ND |
|
|
| Peripla_BP_6 domain-containing protein | 6 | ND |
|
|
| Glutathione-dependent formaldehyde-activating enzyme, EC 4.4.1.22 | 6 | ND |
|
|
| Thioredoxin domain-containing protein | 6 | ND |
|
|
| Ribulose bisphosphate carboxylase large chain, EC 4.1.1.39 | 6 | ND |
|
|
| Transketolase, TK, EC 2.2.1.1 | 6 | ND |
|
|
| Phosphoribulokinase PRKase, EC 2.7.1.19 | 6 | ND |
|
|
| Fructose-1,6-bisphosphatase class 1, EC 3.1.3.11 | 6 | ND |
|
|
| Putative ABC transporter sugar-binding protein | 6 | ND |
|
|
| Uncharacterized protein | 6 | ND |
|
|
| Putative oxidoreductase protein | 6 | ND |
|
|
| Uncharacterized protein | 6 | ND |
|
|
| Inositol-phosphate phosphatase, EC 3.1.3.25 | 6 | ND |
|
|
| Fe(3+) ions import ATP-binding protein FbpC 1, EC 7.2.2.7 | 6 | ND |
|
|
| Putative ABC transporter iron-binding protein | 6 | ND |
|
|
| Sn-glycerol-3-phosphate import ATP-binding protein UgpC, EC 7.6.2.10 | 6 | ND |
|
|
| Glutathione transferase, EC 2.5.1.18 | 6 | ND |
|
|
| TRAP-type small permease component | 6 | ND |
|
|
| Putative ABC transporter periplasmic sugar-binding protein | 6 | ND |
|
|
| Probable sugar ABC transporter | 6 | ND |
|
|
| Putative cell division protein FtsK-like protein | 6 | ND |
|
|
| Uncharacterized protein | 6 | ND |
|
|
| Putative sugar ABC transporter | 6 | ND |
|
|
| S-methyl-5-thioribose kinase, EC 2.7.1.100 | 6 | ND |
|
|
| Uncharacterized protein | 6 | ND |
|
|
| Putative sugar uptake ABC transporter periplasmic solute-binding protein | 6 | ND |
|
|
| Putative sugar uptake ABC transporter periplasmic solute-binding protein | 6 | ND |
|
|
| Putative sugar uptake ABC transporter ATP-binding protein | 6 | ND |
|
|
| 3-Oxoacyl-[acyl-carrier-protein] reductase, EC 1.1.1.100 | 6 | ND |
|
|
| Epimerase domain-containing protein | 6 | ND |
|
|
| Putative sugar uptake ABC transporter periplasmic solute-binding protein | 6 | ND |
|
|
| Ribose import ATP-binding protein RbsA 3, EC 7.5.2.7 | 6 | ND |
|
|
| 4-Aminobutyrate transaminase, EC 2.6.1.19 | 6 | ND |
|
|
| Hypothetical adenylate cyclase, truncated protein | 6 | ND |
|
|
| Putative small heat shock protein, hsp20 family | 6 | ND |
|
|
| Putative small heat shock protein, hsp20 family | 6 | ND |
|
|
| Uncharacterized protein | 6 | ND |
|
|
| Putative transcriptional regulator, GntR family protein | 6 | ND |
|
|
| Uronate isomerase, EC 5.3.1.12 | 6 | ND |
|
|
| ABC transporter, periplasmic solute-binding protein | 6 | ND |
|
|
| Uncharacterized protein | 6 | ND |
|
|
| CENP-V/GFA domain-containing protein | 6 | ND |
|
|
| Putative oxobutyric acid and 3-methyl oxovaleric acid ABC transporter, permease component | 6 | ND |
|
|
| Aminotran_5 domain-containing protein | 6 | ND |
|
|
| UvrABC system protein C, Protein UvrC | 6 | ND |
|
|
| Putative 2-component receiver domain protein | 6 | ND |
|
|
| Probable methyl-accepting chemotaxis protein | 6 | ND |
|
|
| Uncharacterized protein | 6 | ND |
|
|
| Putative ferredoxin protein | 6 | ND |
|
|
| 6,7-dimethyl-8-ribityllumazine synthase 2, EC 2.5.1.78 | 6 | ND |
|
|
| Glycerol-3-phosphate dehydrogenase, EC 1.1.5.3 | 6 | ND |
|
|
| Putative polyol ABC transporter, ATP-binding component | 6 | ND |
|
|
| Putative acyl-CoA dehydrogenase, EC 1.3.99.3 | 6 | ND |
|
|
| Probable chemoreceptor (Methyl-accepting chemotaxis) transmembrane protein | 6 | ND |
|
|
| Ribose transport system permease | 6 | ND |
|
|
| Malate/L-lactate dehydrogenase family protein, EC 1.1.1.- | 6 | ND |
|
|
| Putative oxidoreductase, EC 1.-.-.- | 6 | ND |
|
|
| Transcriptional regulatory protein | 6 | ND |
|
|
| Histidine kinase, EC 2.7.13.3 | 6 | ND |
|
|
| Putative periplasmic binding ABC transporter | 6 | ND |
|
|
| Putative ATP-binding ABC transporter | 6 | ND |
|
|
| Putative permease transmembrane protein | 6 | ND |
|
|
| Putative D-fucose, pyruvic acid or L-fucose ABC transporter, ATP-binding component | 6 | ND |
|
|
| Putative L-fucose dehydrogenase, EC 1.1.1.122 | 6 | ND |
|
|
| Probable chemoreceptor glutamine deamidase CheD, EC 3.5.1.44 | 6 | ND |
|
|
| Probable GMC-type oxidoreductase, EC 1.1.99.- | 6 | ND |
|
|
| Putative methionine ABC transporter, permease component | 6 | ND |
|
|
| Uncharacterized protein | 6 | ND |
|
|
| Probable heat shock protein | 6 | ND |
|
|
| Putative acyl-CoA synthetase, EC 6.2.1.- | 6 | ND |
|
|
| Uncharacterized protein | 6 | ND |
|
|
| Putative oxidoreductase | 6 | ND |
|
|
| Putative amino acid or peptide ABC transporter, periplasmic solute-binding component | 6 | ND |
|
|
| Oxidoreductase, EC 1.-.-.- | 6 | ND |
|
|
| Oxidoreductase, EC 1.-.-.- | 6 | ND |
|
|
| Uncharacterized protein | 6 | ND |
|
|
| Extracytoplasmic solute receptor protein (TRAP transporter) | 6 | ND |
|
|
| DUF1638 domain-containing protein | 6 | ND |
|
|
| L-sorbose dehydrogenase, EC 1.1.99.- | 6 | ND |
|
|
| Short-chain dehydrogenase/reductase, EC 1.1.1.100 | 6 | ND |
|
|
| Putative dehydrogenase transmembrane protein | 6 | ND |
|
|
| MFS-type transport protein | 6 | ND |
|
| Gene | Metabolic role | Sequence | Replicon | Coordinates | Position relative to ATG | Position relative to TSS | Gene context | Proteome profile | His6-PhaR binding |
|---|---|---|---|---|---|---|---|---|---|
|
| PHB metabolism |
| Chr | 797221-797241 | 108 | 65 | Mc | Module 1 | Efficient |
|
| 797239-797259 | 90 | 47 | ||||||
|
| PHB metabolism |
| Chr | 1598752-1598772 | 91 | 75 | Mc | Module 1 | Efficient |
|
| 1598780-1598800 | 63 | 47 | ||||||
|
| PHB metabolism |
| pSymA | 1116538-1116518 | 79 | 14 | Mc | Module 1 | Efficient |
|
| PHB metabolism |
| Chr | 24214-24234* | 221 | 39 | Mc | NR | Efficient |
|
| PHB metabolism |
| Chr | 3046679-3046699* | N/A | 13 | Mc | N/A | Efficient |
|
| Transcription regulation |
| Chr | 3547851-3547871 | 97 | 77 | Mc | ND | Weak |
|
| EPS metabolism |
| pSymB | 1180870-1180890 | 362 | 292 | 1st | Module 1 | Efficient |
|
| 1180978-1180998 | 254 | 184 | ||||||
|
| 1181079-1181099 | 153 | 83 | ||||||
|
| 1181112-1181132 | 120 | 50 | ||||||
|
| EPS metabolism |
| pSymB | 1183193-1183213 | 69 | ND | 3rd | Module 1 | Efficient |
|
| EPS metabolism |
| pSymB | 1173908-1173888 | 369 | 351 | 1st | Module 1 | Efficient |
|
| Central C pathways |
| Chr | 1022888-1022908 | 184 | 161 | Mc | Module 1 | Efficient |
|
| Central C pathways |
| Chr | 1623538-1623518 | 128 | 89 | Mc | Module 1 | NE |
|
| 1623476-1623456 | 66 | 27 | ||||||
|
| Central C pathways |
| Chr | 770806-770786* | 78 | 53 | 1st | Module 1* | Weak |
|
| Intermediate metabolism |
| Chr | 3348337-3348317 | 70 | 39 | Mc | Module 1 | NE |
|
| Pantothenate metabolism |
| Chr | 2327062-2327042* | 185 | 144 | 1st | Module 1* | Weak |
|
| Unknown |
| Chr | 1063525-1063505 | 161 | 148 | 1st | Module 1 | NE |
|
| Unknown |
| Chr | 1062724-1062704 | 36 | ND | 2nd | Module 1 | NE |
|
| Unknown |
| pSymB | 1622073-1622093 | 95 | ND | 1st | Module 1 | Efficient |
|
| IIA of PTS regulatory system |
| Chr | 48591-48571 | 63 | 35 | 1st | Module 1 | NE |
|
| Transport |
| Chr | 3283596-3283616 | 333 | 311 | 1st | Module 1 | NE |
|
| Transport |
| Chr | 224438-224418 | 151 | 108 | 1st | Module 1 | NE |
|
| Transport |
| pSymA | 999179-999159 | 314 | 282 | 1st | Module 1 | NE |
|
| Unknown |
| Chr | 2996060-2996080 | 59 | 59 | Mc | Module 1 | NE |
|
| Unknown |
| Chr | 1667000-1666980 | 122 | 85 | Mc | Module 1 | NE |
|
| 1666954-1666934 | 76 | 39 | ||||||
|
| Unknown |
| Chr | 329335-329315 | 141 | ND | Mc | Module 1 | NE |
|
| Unknown |
| Chr | 1258391-1258371 | 501 | 479 | Mc | Module 1 | NE |
|
| Unknown |
| Chr | 1216599-1216619 | 233 | 128 | Mc | Module 1 | NE |
|
| Unknown |
| Chr | 3322196-3322176 | 48 | 33 | Mc | Module 1 | NE |
|
| Unknown |
| pSymB | 488953-488933 | 470 | 421 | 1st | Module 1 | NE |
|
| EPS metabolism |
| pSymB | 985929-985949 | 131 | 97 | 1st | Module 2 | Weak |
|
| EPS metabolism |
| pSymB | 980325-980305 | 83 | 67 | 1st | Module 2 | Weak |
|
| EPS metabolism |
| pSymB | 970887-970867* | 90 | ND | 8th | ND | NE |
|
| EPS metabolism |
| pSymB | 813544-813564 | 77 | 54 | 1st | Module 2 | NE |
|
| Unknown |
| Chr | 2065197-2065217 | 286 | 234 | Mc | Module 2 | NE |
|
| 2065400-2065420 | 83 | 31 | ||||||
|
| Transport |
| pSymB | 807902-807882 | 159 | 126 | Mc | Module 2 | NE |
|
| Unknown |
| pSymA | 300150-300170 | 421 | 390 | Mc | Module 2 | NE |
|
| Unknown |
| Chr | 2659515-2659495 | 105 | 38 | Mc | Module 3 | Efficient |
|
| Transport |
| pSymB | 1237849-1237829 | 160 | 160 | 1st | Module 3 | NE |
|
| Sugar nucleotide metabolism |
| pSymB | 685336-685316 | 59 | ND | Mc | Module 3 | NE |
|
| Transport |
| Chr | 3483070-3483050* | 63 | ND | 1st | Module 4 | Efficient |
|
| Ribosome hibernation |
| Chr | 411180-411160 | 195 | 170 | Mc | Module 4 | NE |
|
| Histidine metabolism |
| pSymA | 214937-214957 | 484 | ND | 5th | Module 4 | NE |
|
| Unknown |
| Chr | 2157276-2157256 | 336 | ND | 1st | Module 5 | NE |
|
| 2157321-2157301 | 381 | ND | ||||||
|
| Sulfur metabolism |
| Chr | 1038610-1038590 | 464 | ND | 1st | Module 5 | NE |
|
| Central C pathways |
| Chr | 3334402-3334382* | 142 | 58 | 1st | ND | Weak |
|
| Transcription regulation |
| pSymB | 1605799-1605819* | 290 | ND | 1st | ND | Efficient |
|
| Intermediate metabolism |
| pSymB | 1605819-1605799* | 114 | ND | Mc | NR | |
|
| Intermediate metabolism |
| Chr | 605229-605209* | 50 | ND | Mc | ND | Efficient |
|
| Transcription regulation |
| pSymA | 177855-177875* | 118 | ND | Mc | ND | Efficient |
|
| Sugar metabolism |
| Chr | 694088-694068* | 131 | ND | 1st | NR | Weak |
|
| Transcription regulation |
| Chr | 694068-694088* | 90 | 77 | 1st | ND | |
|
| Signaling |
| pSymB | 757235-757215* | 129 | 27 | 1st | NR | Weak |
|
| Nucleotide metabolism |
| Chr | 836029-836049* | 183 | 167 | Mc | NR | None |
|
| Unknown |
| Chr | 927364-927344* | 122 | 122 | 1st | NR | NE |
|
| Oxidative phosphorylation |
| Chr | 1377097-1378017* | 262 | 200 | 1st | ND | NE |
|
| Cell wall biosynthesis |
| Chr | 207016-207036* | 228 | 176 | Mc | ND | NE |
|
| Unknown |
| Chr | 207036-207016* | 253 | 184 | Mc | ND | |
|
| Unknown |
| Chr | 1127684-1127704* | 53 | 38 | 1st | NR | NE |
|
| Transport |
| Chr | 534610-534630* | 114 | 14 | Mc | ND | NE |
|
| Fatty acid metabolism |
| Chr | 534630-534610* | 244 | 172 | Mc | NR | |
|
| Unknown |
| Chr | 502102-502122* | 334 | ND | Mc | ND | NE |
|
| Unknown |
| pSymA | 1099973-1099993* | 244 | ND | 2nd | ND | NE |
|
| Unknown |
| pSymA | 1270906-1270886* | 184 | ND | 1st | ND | NE |
|
| Unknown |
| pSymA | 1270886-1270906* | 444 | ND | Mc | ND |
- —Deutsche Forschungsgemeinschafthttp://dx.doi.org/10.13039/501100001659
- —Alexander von Humboldt-Stiftunghttp://dx.doi.org/10.13039/100005156
Peer Reviews
No public reviews on file for this paper yet. If you reviewed it on a platform where reviews are public (OpenReview, ICLR, NeurIPS, ICML), you can paste yours below so the community can read it here.
Videos
No videos yet. Explain this paper in a talk, walkthrough, or lecture? Add one.
Taxonomy
TopicsBiofuel production and bioconversion · Microbial Fuel Cells and Bioremediation · Legume Nitrogen Fixing Symbiosis
INTRODUCTION
Poly(3-hydroxybutyrate) (PHB) is a storage polymer accumulated by many bacterial species in the form of intracellular granules, called carbonosomes (1, 2). Under growth-limiting conditions and if a utilizable C source is available, PHB is synthesized through the polymerization of β-hydroxybutyryl residues by a PHB synthase. The process begins with the condensation of two acetyl-CoA molecules to form acetoacetyl-CoA, followed by reduction to β-hydroxybutyryl-CoA by means of NAD(P)H. These steps are catalyzed by β-ketothiolase and acetoacetyl-CoA reductase, respectively (3). PHB is degraded by PHB depolymerases, and the products are modified yielding acetyl-CoA and reduced redox coenzymes. The PHB granule surface is shielded from the bacterial cytoplasm by phasins; other PHB granule-associated proteins include PHB synthases and depolymerases as well as a transcription regulator called PhaR in many species (4).
In the model organism for PHB biosynthesis, the β-proteobacterium Cupriavidus necator (formerly Ralstonia eutropha), PhaR has been shown to repress the transcription of genes encoding phasins (5). PhaR acts as a transcription repressor when no PHB is produced and is sequestered to the surface of PHB granules away from the DNA when PHB accumulates, thus ensuring tight regulation of phasin abundance relative to produced PHB (6). Similar functions of PhaR homologs were also identified in α-proteobacteria; in Rhodobacter sphaeroides and Paracoccus denitrificans, PhaR also represses phasin gene expression (7, 8). The ability of R. sphaeroides PhaR to bind DNA was confirmed, and the binding sequence was determined as 5′-CTGCNNNGCAG-3′ (9). In vitro binding of PhaR to PHB was documented in Paracoccus denitrificans (8). In the α-proteobacterial rhizobia Rhizobium etli and Bradyrhizobium diazoefficiens, identified PhaR homologs were shown to have a broader role in gene expression control (10–13).
Despite these advances in understanding the function of PhaR, no study has yet provided a high-resolution global analysis of the PhaR regulon in the context of its dual role as a metabolic sensor and regulator. To fill this gap, we devised an approach combining co-expression network analysis with proteomics across multiple mutant backgrounds using the model symbiotic soil-dwelling α-proteobacterium Sinorhizobium meliloti. In S. meliloti, a chromosomally encoded phaR homolog was first identified and named aniA (for anaerobically*-*induced gene A; for consistency, renamed phaR in our study) by Povolo and Casella (14). The symbiosis between S. meliloti and legumes of the genera Melilotus, Medicago, and Trigonella results in the formation of indeterminate root nodules, in which the colonizing bacteria exist either in a vegetative state or as differentiated nitrogen-fixing bacteroids. Establishment of symbiosis is a complex multistep process that involves signaling and adaptation. The extensive genetic, phenotypic, and molecular characterization of S. meliloti, combined with an advanced global understanding of its metabolism in its free-living and symbiotic lifestyles, makes it an ideal model for exploring the dual role of PhaR (AniA) at a molecular systems level (15)
S. meliloti stores excess carbon as intracellular PHB granules as its main carbon storage compound (16), and its PHB metabolon has been extensively studied (17–20). The phasins PhaP1 (SMc00777) and PhaP2 (SMc02111) were identified as granule-associated proteins necessary for efficient PHB accumulation (21). An active PHB metabolism in free-living conditions has been shown to play a crucial role in regulating the expression of nitrogen metabolism genes, likely through the involvement of an Fnr-type transcription factor (22). Studies by Ratcliff and Denison (23–25) explored PHB’s role in bet-hedging and persistence, demonstrating asymmetrical distribution of PHB granules between mother and daughter cells under nutrient limitation in S. meliloti. In symbiosis, PHB is accumulated at early stages during the infection, but PHB granules are not observed in N_2_-fixing bacteroids (3).
S. meliloti PhaR shares between 39% and 83% amino acid similarity with studied PhaR homologs from α- and β-proteobacteria. Mutation of phaR (aniA) in S. meliloti Rm41 reduces PHB accumulation while increasing glycogen and exopolysaccharide (EPS) production. Furthermore, this mutation alleviates growth defects in a phbC mutant when pyruvate is used as the sole carbon source (14, 26). Similar findings in R. etli phaR (aniA) mutants confirm the conserved function of this gene in symbiotic rhizobia (10). Moreover, phaR depletion in S. meliloti leads to overproduction of the small RNA MmgR (27), which finetunes PHB accumulation, likely via post-transcriptional repression of phasin gene expression (28). Consequently, functional PhaR may be crucial for proper phasin production during the onset of PHB synthesis. While the ability to produce PHB was not crucial for symbiotic performance of S. meliloti, PhaR provided a competitive advantage at early stages of the symbiotic interaction (29). Along with PHB, S. meliloti accumulates glycogen and produces the exopolysaccharides succinoglycan (EPSI) and galactoglucan (EPSII), which have a critical role during symbiosis (30).
Our study provides broad and deep insights into the PhaR regulon in S. meliloti through a systems-level analysis. We advance the knowledge of the PhaR DNA-binding site by uncovering previously undetected extended AT-rich arms and describing conserved PhaR regulatory targets in the PHB metabolon, novel targets that are likely conserved but not yet reported in PhaR-bearing bacteria, and variations in targets among phylogenetically related bacteria. We report proteomic, biochemical, and phenotypic evidence supporting a role for PhaR in regulating key steps of central carbon and EPS metabolism consistent with its previously proposed role in coordinating carbon fate under nutrient imbalance, and implying a broader regulatory role beyond intermediate metabolism. Our co-expression network analysis reveals that PhaR functions as both a metabolic sensor and a global gene regulator by combining its evolutionarily conserved ability to bind both DNA and PHB.
MATERIALS AND METHODS
Strains, plasmids, and growth conditions
The strains and plasmids used in this study are listed in Table 1. Escherichia coli used for cloning and conjugation was grown at 37°C on lysogeny broth (LB) medium (10 g/L tryptone, 5 g/L yeast extract, 5 g/L NaCl). When required, kanamycin (50 mg/L) or tetracycline (10 mg/L) was added. S. meliloti was cultured at 30°C on TY medium (5 g/L tryptone, 3 g/L yeast extract, 0.4 g/L CaCl_2_.2H_2_O), or 3-(N-morpholino)propanesulfonic acid (MOPS)-buffered phosphate-limiting minimal medium, regarded further as low P medium (10 g/L MOPS, 10 g/L mannitol, 3.55 g/L Na glutamate, 1 mM MgSO_4_, 0.25 mM CaCl_2_, 10 mg/L FeCl_3_.6H_2_O, 1 mg/L biotin, 3 mg/L H_3_BO_3_, 2.23 mg/L MnSO_4_.4H_2_O, 0.287 mg/L ZnSO_4_.7H_2_O, 0.125 mg/L CuSO_4_.5H_2_O, 0.065 mg/L CoCl_2_.6 H_2_O, 0.12 mg/L NaMoO_4_.2H_2_O, 0.1 mM KH_2_PO_4_). When required, streptomycin was added at 600 mg/L, kanamycin at 200 mg/L, and tetracycline at 10 mg/L. In liquid cultures, antibiotic concentrations were halved.
Cloning and genetic manipulations
The constructs used in this work were generated using standard genetic techniques. Plasmids were transferred to S. meliloti by conjugation with E. coli S17-1. The primers used are listed in Table S4.
Deletions of phaR and phbC were generated using constructs pPhaRdel and pPhbCdel, which contained DNA fragments upstream and downstream of the target gene, along with the negative sucrose selection marker sacB. Double recombinants with gene deletions were selected on LB agar containing 10% sucrose, as previously described (28), and verified by PCR.
To generate C-terminal translation fusions to enhanced green fluorescent protein (EGFP) at the native genomic locus, the 3´-terminal portion of the gene (approximately 300 bp, excluding the stop codon) was cloned into the suicide vector pK18mob2-EGFP to generate an in-frame fusion. The resulting constructs were integrated into the S. meliloti genome.
Promoter-EGFP fusions were generated by inserting the promoter region, including the translation start codon and up to the first 10 codons of the downstream gene, into the replicative low-copy plasmid pPHU231-EGFP or the replicative medium-copy plasmids pSRKKm-EGFP or pBBRKm-EGFP. This created an in-frame fusion of the first few codons of the gene of interest to EGFP.
A construct for the purification of His_6_-tagged PhaR was generated by inserting the protein coding sequence into the expression vector pWH844.
EGFP measurements
For promoter-EGFP assays, overnight precultures in TY medium were diluted 1:500 in fresh culture medium and grown in a 96-well polystyrene flat-bottom plate (Greiner) with 100 µL of medium per well. The plates were shaken at 1,200 rpm at 30°C. EGFP fluorescence and optical density (OD) were measured using a TECAN spectrophotometer (excitation 488 nm, emission 522 nm, gain 82). Fluorescence values were calculated as relative fluorescence units, which represent the fluorescence intensity divided by the optical density. Unless otherwise indicated, background fluorescence from corresponding strains carrying empty vectors pPHU231-EGFP or pSRKKm-EGFP was subtracted. Three to four independent transconjugants of each strain containing the promoter-EGFP fusion were used as biological replicates.
Protein purification
E. coli BL21 strain carrying pWH844-phaR was grown in LB with ampicillin (100 µg/mL) to an optical density at 600 nm of 0.4 at 37°C, then induced with 500 µM isopropyl β-D-1-thiogalactopyranoside (IPTG) for 7 h at 30°C or for 16 h at room temperature (RT). Cells from 100 mL of culture were harvested by centrifugation at 4,000 × g, resuspended in 6 mL of binding buffer (1.76 g/L Na_2_HPO_4_.2H_2_O, 1.4 g/L NaH_2_PO_4_.H_2_O, 29.2 g/L NaCl, 20 mM imidazole, pH 7.4), and lysed using a French press. The lysates were cleared by centrifugation at 20,000 × g and 4°C for 40 min, and 2,400 µL of the supernatant was applied to a His SpinTrap column (GE Healthcare). The column was washed three times with binding buffer, and the protein was eluted with elution buffer (binding buffer supplemented with 500 mM imidazole). Protein purity was assessed by SDS-PAGE and Coomassie blue staining, and the protein concentration was determined using the Bradford reagent.
In vitro PHB binding
The binding reactions were performed using 10 µg of protein and 0, 0.1, 0.25, or 1 µg of crystalline PHB in 5 mM Tris-HCl (pH 8.5), in a total volume of 100 µL, in triplicate. Reactions were incubated at RT for 1 h with shaking at 1,000 rpm, then centrifuged at 20,000 × g for 5 min at RT. Ninety microliters of the supernatant was mixed with 410 µL of water and subjected to a Bradford assay to estimate the remaining soluble protein.
Electrophoretic mobility shift assay (EMSA)
An EMSA reaction mixture consisted of 10 mM Tris-HCl (pH 8.5), 50 mM KCl, 0.025 A260 units of sonicated salmon sperm DNA (GE Healthcare), 1.0 mg/mL of bovine serum albumin (Sigma), and 10 ng of Cy3-labeled DNA, in a final volume of 10 µL. The protein was added as indicated, in 1 µL of an appropriate dilution in the elution buffer. The reaction mixture was incubated at room temperature for 30 min. Then, 1.5 µL of 90% glycerol was added, and the reaction mixtures were loaded onto a 2% agarose gel. Following electrophoresis at 3 V/cm in TAE buffer (40 mM Tris, 20 mM acetic acid, 1 mM EDTA) at room temperature for 2 h, gels were scanned using a Typhoon 8600 variable-mode imager (Amersham Bioscience).
Plant assays
Medicago sativa cv. Eugenia seeds were surface-sterilized with sulfuric acid for 10 min, washed six times with sterile water, and transferred to plant agar (41). The seeds were germinated in the dark overnight at 4°C, followed by 24 h at 30°C. Bacterial overnight cultures in TY medium were diluted 1:10 with sterile water, and 100 µL of the suspension was plated onto the lower half of plant agar plates. Four seedlings were placed on each plate, and plants were grown at 22°C and 90% humidity in an 18 h light/6 h night photoperiod for 3 weeks.
To determine shoot dry weight, the shoots of four plants from a single agar plate were dried at 60°C for 2 days and then weighed. Nodule numbers were assessed by visual examination. The total number of nodules per plate (four plants) was counted and used to calculate the average number of nodules per plant.
Microscopy
Microscopy of bacteria on 1% agarose pads was performed using Nikon Eclipse Ti-E microscope with DIC objective 100×, CFI Apochromat TIRF Oil objective (numerical aperture of 1.49), and phase contrast objective Plan Apo l 100× 1.45 oil with AHF HC filter sets F36-504 TxRed (ex bp 562/40 nm, bs 593 nm, em bp 624/40 nm) and F36-525 EGFP (exc bp 472/30 nm, beam splitter 495 nm, em bp 520/35 nm). Images were acquired with an Andor iXon3 885 EMCCD camera. For time-lapse microscopy, bacteria were imaged on low phosphate medium agarose pads at 30°C, with images acquired every 15 min. Microscopy of nodules was performed on fresh 100 µm longitudinal nodule sections using a 20× objective lens. Nodule slices were prepared using a Leica VT 1000 S vibratome.
Total protein quantification
Total protein content was determined with the bicinchoninic acid (BCA) assay (Pierce BCA Protein Assay Kit, Thermo Scientific). Briefly, biomass equivalent to 1 OD unit was collected from each culture by centrifugation and resuspended in 100 µL of Laemmli buffer lacking bromophenol blue (31.5 mM Tris-HCl, pH 6.8, 10% glycerol, 1% sodium dodecyl sulfate). The cells were lysed by heating at 100°C for 10 min, followed by centrifugation at 12,000 × g for 1 min. Protein quantification was performed on 10 µL of the clarified supernatant according to the manufacturer’s instructions. A standard curve was generated using bovine serum albumin (BSA) solutions prepared in the same buffer, which was used to interpolate protein concentrations in the samples.
PHB quantification
Nile red-based staining was employed to visualize PHB granules using a fluorescence microscope and to quantify PHB in stationary-phase cultures of S. meliloti strains under different growth conditions, following a previously published protocol (42). Briefly, biomass equivalent to 0.5 OD units was collected by centrifugation (1 min, 12,000 × g) and incubated for 30 min with 35% EtOH in phosphate-buffered saline (PBS, pH 7.2). The cells were centrifuged (1 min, 12,000 × g), the supernatant was discarded, and the pellet was resuspended in 1 mL PBS (pH 7.2). From a 0.1 mg/mL Nile red stock solution in dimethyl sulfoxide (DMSO), 10 µL was added to the bacterial suspension. Following 30 min of incubation, 100 µL aliquots were transferred to a 96-well plate, and OD (600 nm) and fluorescence (excitation at 488 nm, emission at 585 nm) were measured using a Tecan Infinite plate reader. Fluorescence values were normalized to OD, and subsequently to total protein content, yielding arbitrary fluorescence units per µg protein.
Quantitative proteomic analyses
S. meliloti strains were grown for 48 h in TY and MOPS-buffered low P media. For protein extraction, frozen cell pellets were resuspended in water and homogenized, then treated with 2% sodium lauroyl sarcosinate (SLS) in HEPES buffer pH 7.5 and heated for 15 min at 90°C. Proteins were reduced with 5 mM Tris(2-carboxyethyl) phosphine (Thermo Fisher Scientific) at 90°C for 15 min and alkylated using 10 mM iodoacetamide (Sigma Aldrich) at 20°C for 30 min in the dark. Proteins were precipitated with a sixfold excess of ice-cold acetone, followed by two methanol washing steps. Dried proteins were reconstituted in 0.2% SLS, and the amount of proteins was determined by bicinchoninic acid protein assay (Thermo Scientific). For tryptic digestion, 50 µg protein was incubated in 0.5% SLS and 1 µg of trypsin (Serva) at 30°C overnight. Desalted peptides were then analyzed by liquid chromatography-mass spectrometry using an Ultimate 3000 RSLC nano connected to an Exploris 480 mass spectrometer (both Thermo Scientific). Label-free quantification of data-independent acquisition raw data was done using DIA-NN. Further details on sample processing, analytical set up, and bioinformatics analysis are described in the supplemental methods.
RESULTS
PhaR binds PHB in vitro and regulates global gene expression dependent on PHB production
The ability of PhaR from S. meliloti to bind PHB was evaluated in vitro. Purified His_6_-PhaR, but not BSA, which was conceived as a negative control, was effectively removed from the solution upon incubation with a suspension of non-soluble PHB and subsequent centrifugation (Fig. 1A). We determined that approx. 10 µg of His_6_-PhaR (ca. 440 pmoles) bind to 1 µg of crystalline PHB in a total volume of 100 µL (Fig. 1A).
PhaR associates with PHB granules and modulates PHB accumulation under nutrient-limiting conditions in low-phosphate medium. (A) In vitro binding of crystalline PHB by His6-PhaR. The total protein remaining in solution after incubation of PhaR (filled circles) or BSA (filled squares) with increasing amounts of crystalline PHB is shown. Error bars represent the standard deviation from at least five replicates. Statistical analysis for each experiment was conducted using analysis of variance, followed by Tukey’s multiple-comparison test. Bars labeled with different letters indicate statistically significant differences (P < 0.0001). (B) PHB levels to total protein are shown with filled circles for wild-type (wt), phaR, phbC, and phbC phaR strains in the stationary phase of growth under conditions permissive (low P medium) and non-permissive (TY medium) for PHB accumulation. (C) Microscopy images of cells expressing PhaP1-EGFP, stained with Nile red after 24 h of growth in low P medium. Scale bar: 5 µm. (D) Time-lapse microscopy of S. meliloti 2011 expressing PhaP1-mCherry and PhaR-EGFP, grown on agarose pads in low P medium. Time is indicated in minutes.
To obtain further evidence supporting the hypothesis that PhaR associates with PHB in vivo, we analyzed the colocalization of phasins and PhaR with PHB granules. Phasin PhaP1, previously identified as a PHB granule-associated protein (21), was initially used to visualize PHB granules. For this purpose, the coding sequence of EGFP was integrated at the native genomic location of phaP1 to replace its stop codon. As expected, PhaP1-EGFP foci colocalized with Nile red-stained PHB granules (Fig. 1C), showing that this fusion protein can be used as a marker for PHB granules. Colocalization of PhaR-EGFP and PhaP1-mCherry observed by time-lapse microscopy in living cells then confirmed the recruitment of PhaR to PHB (Fig. 1D).
To characterize PhaR-mediated gene regulation and its dependence on PHB accumulation in S. meliloti, we generated Sm2011 mutants with deletions of phaR and/or PHB synthase gene phbC. PHB content was quantified in the wild-type as well as in the phaR and/or phbC mutant strains, which were grown to the stationary phase in TY complex medium and MOPS-buffered minimal medium limited in phosphate, hereafter referred to as low P medium (Fig. 1B) (43). Consistent with previous reports (14), phaR cells grown in low P medium contained ~30% less PHB than the wild-type, while wild-type and phaR cells grown in TY medium were indistinguishable from phbC cells that are unable to synthesize the carbon storage polymer. In agreement with these results, no PHB granules were visualized under the microscope upon Nile red staining of wild-type or phaR cells grown in TY medium or phbC mutant cells grown in either medium (Fig. S1). Thus, we further considered the growth in low P medium as permissive for PHB accumulation, in contrast to growth in TY medium, which supported no or little PHB production.
Sm2011 phaR, phbC, and phbC phaR strains formed pink, healthy nodules on M. sativa roots, indistinguishable from those induced by the wild type. Plant shoot dry weight and nodule numbers did not significantly differ between strains (Fig. 2A and B). We analyzed nodules from wild-type and phaR strains carrying chromosomally integrated phasin-EGFP fusions, using fluorescence as a readout of PhaR activity. Weak PhaP1-EGFP and PhaP2-EGFP signals appeared in the nitrogen fixation zone of wild-type nodules, while phaR mutants strongly overproduced PhaP1-EGFP, with PhaP2-EGFP unchanged (Fig. 2C through F). This mirrored the TY medium pattern (Fig. S1), which aligns with the fact that indeterminate nodule bacteria also produce little PHB, keeping PhaR free to regulate its target regulon.
PhaR is active during symbiosis but is not essential for nodule formation or nitrogen fixation. (A, B) Symbiotic phenotypes of strains with varying PhaR and PhbC activity: (A) number of pink nodules formed per plant, (B) plant shoot dry weight. Data represent the averages from 20 plants inoculated with each of the indicated strains. Statistical analysis was performed using analysis of variance followed by Tukey’s multiple-comparison test. Bars marked with different letters indicate significant differences (P < 0.01). (C–F) Microscopy images of longitudinal sections of nodules. (C) Sm2011 carrying PphaP1-EGFP, (D) Sm2011 carrying PphaP2-EGFP, (E) phaR mutant carrying PphaP1-EGFP, (F) phaR mutant carrying PphaP2-EGFP. Acquisition time was set at 1 s, except for E, for which it was set at 200 ms due to higher signal intensity.
Consistent with the model that PhaR homologs regulate transcription and are titrated by PHB granules, deletion of phaR significantly affected the proteome of S. meliloti only when PHB storage was minimal or absent (e.g., in phbC mutant cells grown in either medium, or in phbC^+^ cells grown in TY medium), as shown by a principal component analysis (PCA) of the proteomic data (Fig. 3A). Furthermore, deletion of phbC under PHB-permissive conditions resulted in proteomic changes that contrasted with the effects of phaR deletion in a phbC mutant background. This difference is likely due to the release and increased availability of free PhaR molecules. With regard to the phbC phaR proteome, this is reflected in a nearly complete reversal of the shift of the phbC proteome relative to the wild-type proteome along the x-axis of the PCA plot (Fig. 3A, left panel).
Co-expression networks reveal PhaR-driven proteome adjustments linked to PHB sensing. (A) Principal component analysis of proteomes from three biological replicates of wild-type (purple symbols) and mutant (phaR, coral; phbC, green; phbC phaR, turquoise) strains grown in low P (left panel) and TY (right panel) media. (B) Network spatial visualization showing genes grouped based on their co-expression patterns across strains and growth conditions, as determined by the analysis using the hCoCena package. Genes are color-coded according to their respective co-expression modules, with each module assigned a signature number from 1 to 10. (C) Violin plot displaying the expression profiles of proteins repressed by PhaR, clustered in modules 1 to 3, across mutant backgrounds and growth media. For each protein, the Z-scored abundances from three replicate proteomes were averaged. Each violin represents the distribution of these averaged protein abundances. (D) Violin plot displaying the expression profiles of proteins activated by PhaR, clustered in modules 4 to 6, across mutant backgrounds and growth media. For each protein, the Z-scored abundances from three replicate proteomes were averaged. Each violin represents the distribution of these averaged protein abundances.
Building on our basic analyses, which confirmed that in S. meliloti PhaR interacts with PHB granules and that this interaction likely affects the regulatory activity of PhaR, we sought to identify the genes regulated by PhaR. To achieve this, we integrated the global protein expression data collected across various mutant backgrounds and growth conditions and constructed a weighted co-expression network using the hoCoCena package to identify genes with expression patterns consistent with PhaR regulation (44). Genes with similar expression patterns across strains/conditions were clustered into modules. We identified 10 modules that were further classified based on their enrichment in proteins of differential abundance in TY and low P media in the phbC strain compared to the phbC phaR strain (Fig. 3B). This pattern indicates proteins that are regulated by PhaR in a PHB-independent manner (Fig. 3C and D).
Modules 1 to 3 were enriched in proteins showing increased levels upon phaR deletion (Table S3). The abundance profiles of these proteins across the different mutational backgrounds and growth conditions tested would be consistent with repression of their genes by PhaR (Fig. 3C). This supports the model in which PhaR actively regulates gene expression when this regulator is not sequestered by PHB. Conversely, modules 4 to 6 showed enrichment in proteins downregulated upon phaR deletion (Table S3). In the tested settings, these proteins showed abundance profiles that would be consistent with activation of their genes by PhaR (Fig. 3D). Proteins in modules 1 and 4 were produced in both media, whereas those in modules 2 and 5, and 3 and 6, were exclusively detected in low P and TY media, respectively. Modules 7 to 10 contained proteins whose abundance was differently affected by PhaR in the different growth conditions (not shown), likely reflecting indirect responses to PhaR or regulation influenced by external factors specific to each condition.
Modules 1 to 3 were significantly enriched in proteins involved in C storage metabolism, specifically related to PHB and EPS biosynthesis (Table 2; Table S3). Levels of PHB granule-associated phasins PhaP1 and PhaP2, along with the PHB depolymerase SMa1961, were increased in the phaR mutant background. Proteins encoded by the EPSI and EPSII biosynthetic clusters (exo/exs and wga/wge, respectively) are associated with these modules. Module 1 includes enzymes from central carbon metabolic pathways such as the Entner-Doudoroff (6-phosphogluconolactonase, Pgl*;* and phosphogluconate dehydratase, Edd), as well as enzymes from the TCA cycle and glyoxylate shunt (citrate synthase, GltA; isocitrate lyase, SMc01727), and gluconeogenesis (pyruvate phosphate dikinase, PpdK; pyruvate carboxylase, Pyc). Inorganic pyrophosphatase (Ppa) and urease components UreA and UreB are also grouped in module 1, along with Tam (putative trans-aconitate methyltransferase, SMc00225) and Dhe (putative (S)-2-haloacid dehalogenase, SMc00103). ExoF3 (module 2) and SMb21248 (module 1) belong to a Clr-regulated 30 kb gene cluster involved in polysaccharide metabolism (45). From module 1, the proteins SMc03998, SMc02051, SMb20609, and SMb20727, all with unknown functions, exhibited notable fold changes in the phbC phaR compared to the phbC strain (Table 2). Notably, in addition to the EPSII biosynthesis gene cluster-related proteins, NodP (encoding subunit 2 of the sulfate adenylyltransferase, an enzyme involved in sulfate activation) stands out in module 2 with a strong upregulation in the absence of PhaR.
Among proteins that clustered in modules 4 to 6, components of the bacterial α-keto-acid dehydrogenase complexes, pyruvate dehydrogenase (encoded by the operon pdh), and branched-chain α-keto-acid dehydrogenase (encoded by the operon bkd), showed a strong positive regulation by PhaR (Table 2). While the structural components (EI- and EII proteins PdhA/B/C and BkdA/B) are specific for each complex, EIII proteins (LpdA proteins) are common components of all α-keto-acid dehydrogenases and likely interchangeable (46). Remarkably, ThiC/G/D, which are involved in the biosynthesis of thiamine pyrophosphate—a cofactor shared by the α-keto-acid dehydrogenase complexes—showed positive regulation by PhaR. However, these proteins were only detected in low P medium (module 5), likely due to repression of their production by the exogenous thiamine present in complex TY medium. Noteworthy, the levels of the Calvin-Benson-Bassham cycle-related proteins CbbF/P/T/L, detected only during growth in TY medium, were strongly positively influenced by PhaR. CbbA (whose coding gene in pSymB forms an operon together with cbbFPTLSX, ppe, and SMb20194) did not cluster in module 6 in the co-expression analysis, although it showed a significant upregulation upon phaR mutation in TY medium (Table S2). The methyl-accepting chemotaxis proteins McpT and McpZ (47) clustered in module 6, which groups proteins detected exclusively in complex medium, with large fold ratios indicating a strong activation by PhaR. Remarkably, 30% of the genes detected in TY medium as activated by PhaR (module 6) are associated with membrane-transport functions (i.e., ABC-type transporter, TRAP transporter).
Regulon-centric identification of the PhaR DNA-binding motif in S. meliloti enables a genome-wide exploration of direct PhaR targets
The DNA-binding motif of PhaR homologs has been well characterized in several α-proteobacteria (8, 9, 11). In S. meliloti, there is limited evidence suggesting that this motif is conserved. One study has shown that PhaR (AniA) acts as a repressor of the small non-coding RNA MmgR, which notably plays a role in regulating PHB accumulation (28). The promoter region of mmgR contains a putative binding site for PhaR that closely resembles previously published motifs (27).
To identify the DNA-binding motif recognized by PhaR in S. meliloti, we conducted a regulon-centric MEME search for conserved palindromic DNA sequences in the upstream regions of genes encoding proteins whose levels were affected by PhaR, specifically those included in modules 1 to 6. We discovered the palindromic motif WNWD_2_NYGCRNYGCRNH_2_WNW, which was present in 50 promoter regions, with a clear enrichment in genes belonging to module 1, and ~30% of them (e.g., 22 genes out of 71 genes grouped in module 1) having at least one copy in their upstream sequence (Fig. 4; Table 3). Conversely, the motif was found in only seven genes activated by PhaR (e.g., genes in modules 4 to 6). The high sequence identity shared between the identified motif and PhaR consensus binding sequences reported in related species (Fig. 4B) suggests that this sequence is likely the DNA sequence targeted by PhaR in S. meliloti. Our systemic approach to identifying the motif improved its definition and revealed extended AT-rich arms, which had not been reported so far in other species (Fig. 4A).
Regulon-centric identification of the PhaR target DNA-binding motif in S. meliloti. (A) Consensus PhaR-binding site predicted using MEME (48) to search for conserved palindromic DNA sequences in the promoter region of genes that were clustered in modules 1 to 6. (B) Alignment of PhaR-binding motifs experimentally characterized in multiple species. The conserved palindromic GC pairs are highlighted in gray. Positions in homologous motifs that match the consensus sequence determined in S. meliloti are shown in green. Conversely, non-matching positions are shown in red. (C) Heatmaps depict the Z-scored abundances of PhaR-regulated proteins assigned to modules 1 through 6 across strains grown in low P and TY media. Data from three biological replicates of each strain grown in each condition are displayed in separate adjacent columns. Features with at least one predicted PhaR DNA-binding motif in their promoter regions are indicated with horizontal lines on the left side of the plots. The Z-scored expression levels of each protein in each proteome (ranging from −2 to +2) are represented using the following color scale: blue indicates low expression, white represents intermediate expression, and red denotes high expression.
Using FIMO, we then scanned the upstream regions of genes annotated in the S. meliloti genome for the conserved motif. This approach aimed to uncover additional PhaR target genes that may have remained undetected through our initial strategy, which relied on a limited set of proteins identified through proteomics. Since a motif search in upstream regions of genes putatively regulated by PhaR is likely to fail if it is not a monocistronic gene or the first gene of a polycistronic operon, this analysis sought to find the motifs in the promoter regions of such operons. Indeed, we identified a putative PhaR-binding motif upstream of the zwf gene (SMc03070), which encodes glucose-6P dehydrogenase and is the first gene in an operon followed by pgl and edd (whose encoded proteins clustered in module 1). Similarly, panC (SMc01880) contains a putative PhaR-binding sequence and is positioned at the start of the pantothenate biosynthetic operon, which includes panB (module 1). Table 3 lists the putative binding sites and their associated genes identified by the MEME search, as well as the 20 previously undetected binding sites with the highest score from the further FIMO search that were located in intergenic regions (complete FIMO output table in Table S5). Eleven of these sequences were further tested for binding to PhaR, as described below.
PhaR senses PHB and regulates its metabolic modulon, targeting phasins and the degradative branch in S. meliloti
PHB-granule-associated phasins PhaP1 and PhaP2, along with the PHB depolymerase SMa1961, displayed proteomic profiles across the tested mutant backgrounds and growth conditions that align with genes repressed by PhaR (Fig. 5A, top plots). These genes showed the strongest repression by PhaR in the proteomic analysis, with log_2_(fold change) ranging from 2 to 11 in the phbC phaR compared to the phbC mutant. The promoters of phaP1, phaP2, and SMa1961 contain putative PhaR-binding motifs (Fig. 5B). Specifically, the phaP1 and phaP2 promoters each have two copies of the palindromic sequence, arranged flanking the −35 promoter element. In contrast, SMa1961 has a single putative binding sequence located between the −10 element and the transcriptional start site. Furthermore, the genome-wide search using FIMO identified a putative binding site immediately downstream to the −35 element in the sequence upstream of a second PHB depolymerase gene, phaZ (SMc02770) (Table 3; Fig. 5B). Although PhaZ did not exhibit changes at the proteomic level indicative of regulation by PhaR (Fig. 5A, top plots), we considered the possibility of an indirect effect that might mask this regulation and opted to investigate it further. Notably, our FIMO search also identified the presence of the motif in the promoter region of mmgR (28) (Fig. 5B; Table 3).
PhaR senses PHB and exerts direct control over its modulon. (A) (Top plots) Levels of PHB-associated phasins PhaP1, PhaP2, and PHB depolymerases PhaZ and SMa1961 across mutant backgrounds during growth in TY and low P media. Protein abundances are indicated in arbitrary units (AU), retrieved from proteomic data. Error bars represent standard deviation of three biological replicates. Statistical analysis was conducted using analysis of variance (ANOVA) followed by a permutation-based false discovery rate (FDR) correction for multiple comparisons. Bars labeled with different letters indicate statistically significant differences (P-adj < 0.05). (Central plots) Promoter activity of phasins and PHB depolymerase genes. Fluorescence of promoter-EGFP fusions expressed from medium- or low-copy number plasmid derivatives (see Table 1) was measured after 48 h of cultivation. Error bars represent standard deviation of three to four biological replicates. Statistical analysis was conducted using ANOVA, followed by Tukey’s multiple-comparison test for each gene and growth condition. Bars labeled with different letters indicate statistically significant differences (P < 0.001). (Bottom plots) Correlation analysis between promoter activity of phaP1, phaP2, phaZ, and SMa1961 genes with levels of encoded proteins. The r2 values are indicated on the plots. (B) Promoter regions of phasins phaP1/2, PHB depolymerases phaZ and SMa1961, and mmgR. Transcription start site is shown with a letter in bold, −35 and −10 promoter elements are marked by gray boxes, and PhaR-binding palindromes are bolded and underlined. (C) EMSAs with purified His6-PhaR and DNA fragments corresponding to sequences of promoters for phaP1, phaP2, phaZ, SMa1961, mmgR, and phaR/phbAB.
The activity of phaP1 and SMa1961 promoters, as assessed by low-copy number plasmid-borne promoter-EGFP fusions, correlated well with the corresponding protein abundances across the different mutant backgrounds, both under conditions that are permissive and non-permissive for PHB synthesis (with r^2^ = 0.9633 and r^2^ = 0.8267, respectively, Fig. 5A, bottom plots). Unlike PhaP1, however, PhaP2 was abundant only in PHB-producing, phosphate-limited wild-type or phaR mutant cells, but not in cells of the phbC or phbC phaR strains grown in TY or low P media (Fig. 5A, top plots). This was in contrast to the high activation of the phaP2 promoter in phaR and phbC phaR strains regardless of the growth medium (r^2^ = 0.6929, Fig. 5A, bottom plots). These results suggest that removal of PhaR—either through binding to PHB granules or through gene deletion—is sufficient to drive high levels of PhaP1 production. In contrast, the production and/or stability of PhaP2 appears to depend on both the absence of PhaR and presence of PHB granules, highlighting distinct post-transcriptional regulatory and/or stability mechanisms for each phasin. Noteworthy, the phaZ promoter activity displayed a profile pattern consistent with a gene typically repressed by PhaR, even though not correlating with PhaZ levels (r^2^ = 0.2543, Fig. 5A, bottom plots). This suggests that post-transcriptional mechanisms independent of PhaR operate on phaZ to finetune PhaZ abundance.
Next, we tested the binding of His_6_-PhaR to the DNA fragments containing the promoter regions of phaP1, phaP2, SMa1961, phaZ, and mmgR using an EMSA. PhaR binding was classified as efficient when a complete band shift occurred with 100 ng of His_6_-PhaR per reaction. Binding was considered low efficiency if the shift was diffuse or required 400 ng of His_6_-PhaR. All promoter regions tested exhibited a clear shift when incubated with increasing amounts of PhaR (Fig. 5C). Excluding or introducing point mutations in the palindromic regions from each corresponding sequence abolished the shifts in the EMSA, providing strong evidence that these palindromes represent PhaR-binding sites (promoter variants detailed in Fig. S2). For both phaP1 and phaP2, either the proximal or distal copy of the binding site was sufficient to promote PhaR binding in the EMSA.
Since autoregulation of phaR homologs has been reported in other bacteria (8), we analyzed the phaR/phbAB intergenic region for binding by PhaR. Although two sequence motifs resembling the consensus site were found using FIMO, they fell below the threshold set for inclusion. Nonetheless, an electrophoretic mobility shift was observed, but only at the highest protein concentration tested (Fig. 5C). The promoter activity of phaR was slightly reduced in the phaR mutant background, whereas the promoter activity of phbA remained unaffected by phaR (data not shown). Additionally, no putative PhaR-binding site was detected in the promoter region of phbC, consistent with the failure to detect PhaR binding in the EMSAs and the unaltered promoter activity in response to PHB production or in case of phaR deletion (results not shown). Taken together, these data suggest that PhaR regulates the expression of PHB depolymerase genes, but not the expression of the genes involved in PHB biosynthesis.
PhaR links exopolysaccharide biosynthesis to PHB production
In S. meliloti, exopolysaccharide biosynthetic enzymes are strongly downregulated by PhaR, as revealed by the proteomic analysis ([Fig. 6A and 7A](#F6 F7)). Notably, regulation of gene products of the EPSII biosynthetic cluster is evident only during growth under low phosphate conditions, where the gene cluster becomes active due to the release of MucR-mediated repression (50). The identification of a conserved PhaR-consensus binding sequence within the promoter regions of three genes associated with EPSI biosynthesis (e.g., exoH, exoL, and exoY) and three genes related to EPSII production (e.g., wgaA, wgeA, and wgeH) suggests direct regulation of these biosynthetic pathways by PhaR. To investigate this, we analyzed the binding of PhaR to the promoter regions of the EPSI biosynthesis genes exoH, exoL, and exoY, and the EPSII biosynthesis genes wgaA and wgeA using EMSA.
Succinoglycan (EPSI) biosynthesis regulation by PhaR. (A) Scaled genetic scheme showing proteome-level regulation of EPSI exo and exs cluster expression. Proteins encoded by genes highlighted in red showed significant upregulation in low P medium in the phbC phaR compared to the phbC mutant background, indicative of PhaR-mediated gene repression, with the intensity of the red color proportional to the log2(fold change) determined for each gene product. Proteins encoded by genes in gray were not detected. Operons, as described by Schlüter et al. (49), are indicated by solid lines below the scheme. Predicted PhaR-binding sites (listed in Table 3) are represented by yellow boxes. (B) EMSAs with purified His6-PhaR and the promoter regions of exoH, exoL, and exoY genes. (C) Promoter activity of EPSI biosynthesis genes. Fluorescence mediated by promoter-EGFP fusions was measured after 48 h of cultivation. Error bars represent standard deviation of three to four biological replicates. Statistical analysis was conducted using analysis of variance, followed by Tukey’s multiple-comparison test for each gene and growth condition. Bars labeled with different letters indicate statistically significant differences (P < 0.001). (D) EPSI production determined by calcofluor fluorescence quantification (right panel) of colonies that developed on agar plates of TY and low P media (left panel).
Galactoglucan (EPSII) biosynthesis regulation by PhaR. (A) Scaled genetic scheme showing proteome-level regulation of wge, wgd, and wga operons of the EPSII biosynthesis gene cluster. Proteins encoded by genes highlighted in red showed significant upregulation in TY medium in the phbC phaR compared to the phbC mutant background, indicative of PhaR-mediated gene repression, with the intensity of the red color proportional to the log2(fold change) determined for each gene product. Proteins encoded by genes in gray were not detected. Operons, as described by Schlüter et al. (49), are indicated by solid lines below the scheme. Predicted PhaR-binding sites (listed in Table 3) are represented by yellow boxes. (B) EMSAs with purified His6-PhaR and the promoter regions of wgaA and wgeA genes. (C) Promoter activity of EPSII wgaA and wgeA biosynthesis genes. Fluorescence mediated by promoter-EGFP fusions was measured after 48 h of cultivation. Error bars represent standard deviation of three to four biological replicates. Statistical analysis was conducted using analysis of variance, followed by Tukey’s multiple-comparison test for each gene and growth condition. Bars labeled with different letters indicate statistically significant differences (P < 0.001). (D) Morphology of colonies developed by the indicated strains grown on TY agar.
The promoter regions of EPSI biosynthesis genes exoH, exoL, and exoY efficiently bound PhaR (Fig. 6B). Thus, regulation of these promoters by PhaR likely controls the expression of the exoHKLAMNOP and exoYFQZ operons, which include 12 out of the 19 genes involved in EPSI biosynthesis. Promoter-EGFP assays further showed increased transcription of exoY, exoL, and exoH in phaR-deficient strains (Fig. 6C). During growth in TY medium, these promoters were repressed in the presence of phaR, with strongest repression observed in the phbC mutant. To analyze EPSI production, we performed growth assays in the presence of calcofluor, a fluorescent dye that binds to this EPS and allows its production to be assessed by the fluorescence of agar cultures (Fig. 6D). During growth on TY medium, the phaR strain exhibited significantly higher fluorescence than the wild type, suggesting enhanced EPSI production in the absence of PhaR. In low P medium, both the wild type and phaR strains displayed similar fluorescence, suggesting comparable levels of EPSI production. Thus, PhaR reduces EPSI production by repressing the transcription of the exoYFQZ and exoHKLAMNOP operons in PHB-dependent manner.
Furthermore, we observed weak PhaR binding at the promoter region of wgaA (Table 3; Fig. 7B). The wgaA promoter drives the expression of 10 wga genes involved in the biosynthesis of EPSII (32). In Sm2011 and its derivatives, EPSII biosynthesis genes, including wgaA, are repressed by the transcriptional regulator MucR (50). To analyze the regulation of EPSII biosynthesis by PhaR and PHB, phaR and phbC mutations were introduced into a mucR deletion strain. Deletion of phaR in the mucR strain resulted in a slight increase in wgaA promoter activity; however, deletion of phbC reduced the PwgaA-EGFP fluorescence signal by approximately twofold (Fig. 7C). In contrast, the wgeA promoter, which drives expression of the wge operon, did not display phaR-mediated regulation in the mucR strain. Although the regulation of wgaA was moderate, the mucoidity of the mucR strain increased notably upon deletion of phaR and decreased upon mutation of phbC (Fig. 7D).
Remarkably, ppa, encoding the inorganic pyrophosphatase—an enzyme catalyzing the hydrolysis of pyrophosphate (PPi) to phosphate—was associated with module 1. This reaction is essential for maintaining low PPi levels, a condition necessary to thermodynamically favor the activation of phosphate sugars to nucleotide sugars (e.g., ExoN-catalyzed activation of glucose-1P to UDP-glucose, a precursor of EPS biosynthesis). Notably, a PhaR-binding motif was identified in the promoter region of ppa, suggesting that ppa is a direct target repressed by PhaR.
The PhaR regulon extends beyond PHB and EPS metabolism
Putative consensus binding sites for PhaR were found in the promoter regions of the module 1-associated genes ppdK, gltA, and manX (Table 3), suggesting direct regulation by PhaR. The binding of PhaR to the ppdK promoter was tested as a proxy to confirm a direct involvement of PhaR in these processes. Efficient binding was detected between PhaR and the promoter region of ppdK (Fig. 8A), and ppdK promoter-driven expression of the EGPF reporter was dependent on phaR and correlated well with PpdK levels in both media (r^2^ = 0.8842, Fig. 8B, bottom plots).
The PhaR regulon extends beyond PHB and EPS metabolism. (A) EMSA assays with purified His6-PhaR and DNA fragments corresponding to sequences of promoters for ppdK, zwf, panC, SMb20609, SMc01834, SMc03815, sdhC, SMc02240, SMa0319, rhaD/R, SMb21115, and guaB. (B) (Top plots) Levels of module 1-clustered proteins PpdK, Zwf, SMb20609, and PanB across mutant backgrounds during growth in TY and low P media. Protein abundances are indicated in arbitrary units (AU), retrieved from proteomic data. Error bars represent standard deviation of three biological replicates. Statistical analysis was conducted using analysis of variance (ANOVA) followed by a permutation-based false discovery rate (FDR) correction for multiple comparisons. Bars labeled with different letters indicate statistically significant differences (P-adj <0.05). (Central plots) Promoter activity of the corresponding genes. Fluorescence of promoter-EGFP fusions expressed from medium or low-copy number plasmid derivatives (see Table 1) was measured after 48 h of cultivation. Error bars represent standard deviation of three to four biological replicates. Statistical analysis was conducted using ANOVA, followed by Tukey’s multiple-comparison test for each gene and growth condition. Bars labeled with different letters indicate statistically significant differences (P < 0.01). (Bottom plots) Correlation analysis between promoter activity of ppdK, zwf, SMb20609, and panC genes with levels of encoded proteins (except for panC, where correlation was calculated with PanB levels). The r2 values are indicated on the plots. (C) Correlation analysis between promoter activity of SMc01834 and SMc03815 genes with levels of encoded proteins. The r2 values are indicated on the plots.
PhaR was also found to exert mild repression on levels of Zwf, Pgl, and Edd enzymes catalyzing the initial steps of sugar catabolism through the ED pathway, which results in glyceraldehyde-3P and pyruvate as end products (Fig. 8B; Table 2). zwf, pgl, and edd are organized in an operon, and a putative binding site for PhaR was found immediately upstream to the −35 box of the leading promoter (Table 3). Weak binding of His_6_-PhaR to the zwf promoter region was confirmed through an EMSA (Fig. 8A), and regulation at the transcriptional level was supported by changes in fluorescence mediated by the Pzwf-EGFP reporter fusion in TY medium but not in low P (r^2^(TY) = 0.8105 and r^2^(lowP) = 0.0799, Fig. 8B, bottom plots). While Zwf was not clustered along with Pgl and Edd in module 1 (e.g., displaying a regulatory pattern compatible with PhaR repression subjected to PHB modulation), its levels do increase in the phbC phaR compared to the phbC mutant background (analysis of variance [ANOVA], P-adj <0.05). Though the fold changes for Zwf, Pgl, and Edd were rather modest, even subtle adjustments in enzyme levels may contribute to the overall metabolic response governed by PhaR.
As noted above, the FIMO search identified a PhaR-binding motif within the panC promoter region (Table 3). panC is the first gene in an operon that also includes panB coding for 3-methyl-2-oxobutanoate hydroxymethyltransferase, which is associated with module 1 (Table 2). This enzyme catalyzes the initial step in the biosynthesis of pantothenate—a precursor of coenzyme A—after diverging from the valine biosynthesis pathway. An EMSA revealed a weak interaction between PhaR and this motif (Fig. 8A), and PpanC-EGFP reporter fusion activity suggests direct transcriptional regulation of this operon by PhaR, in good correlation with the proteomic pattern observed for PanB (r^2^ = 0.7489, Fig. 8B, bottom plots).
From module 1, SMb20609 showed dependence on phaR. Efficient binding of His_6_-PhaR to the SMb20609 promoter region (Table 3) was demonstrated by an EMSA (Fig. 8A). The activity pattern of a PSMb20609-EGFP reporter fusion displayed a strong correlation with the protein levels during growth in TY media, suggesting direct regulation of SMb20609 by PhaR at the transcriptional level (r^2^(TY)=0.9177 and r^2^(lowP) = 0.2916, Fig. 8B, bottom plots).
The promoter regions of SMc01834 and SMc03815 were selected as representatives to analyze the direct binding and regulation by PhaR to promoters from genes that contain a PhaR-consensus binding motif and belong to modules 3 and 4, respectively. Both promoters bound His_6_-PhaR efficiently (Fig. 8A). While the PSMc01834-EGFP fusion reported promoter activities in all mutant backgrounds that correlated well with the corresponding protein abundances in TY (r^2^(TY)=0.9974, Fig. 8C, bottom plots), the activities of the PSMc03815-EGFP fusion followed a pattern consistent with a PhaR-repressed gene. This contrasts with the behavior observed for SMc03815 in the proteome analysis and is reflected by a negative correlation index (r^2^(TY)=0.9586 with slope_(TY)_ = −0.6945 and r^2^(lowP) = 0.4538, Fig. 8C, bottom plots).
Finally, we explored the potential binding of PhaR to promoters where a consensus binding motif was detected with FIMO, specifically in genes encoding proteins that were either absent in the proteome or did not cluster in co-expression modules. EMSAs demonstrated that His_6_-PhaR bound to PsdhC, PSMc02240, PSMa0319, and PSMb21115, and to the intergenic regions between rpoE and acyP, as well as rhaD and rhaR, with varying efficiency (Fig. 8A). However, no binding was detected between His_6_-PhaR and PguaB (Fig. 8A).
DISCUSSION
PhaR’s dual role as a PHB sensor and gene regulator is likely an ancient, conserved trait
The role of PhaR in carbon flow partitioning in S. meliloti was first proposed by Povolo and Casella (14). Subsequent studies on PhaR homologs in proteobacteria, including P. denitrificans and C. necator, revealed its function in coordinating PHB accumulation with metabolism by acting as both a transcriptional regulator and PHB sensor (8, 51). This conserved function across species is underscored by a remarkable conservation in their predicted protein structures, even with variable amino acid sequence identity (see Fig. S3, structural alignment of Alphafold structures). Despite these insights, a comprehensive analysis of the PhaR regulon remains lacking. Here, we investigated PhaR’s role in PHB sensing and gene regulation in S. meliloti. Using co-expression network analysis and proteomics across mutant backgrounds, we uncovered a PHB-dependent PhaR-mediated global response. Our approach improved sensitivity over traditional differential expression analyses (52). Notably, 30%–40% of identified proteins in low P and TY media showed phaR-dependent production (ANOVA, P-adj < 0.05) (Table S2).
We confirmed PhaR’s interaction with PHB through in vitro biochemical assays and in vivo co-localization, supporting a model where PhaR switches between active (free) and inactive (PHB-bound) states. Co-expression network analysis identified 10 gene modules, with six displaying phaR-dependent regulation in a PHB-dependent manner. As expected, intermediate metabolism proteins emerged as key regulatory targets. Our findings highlight a pivotal role for PhaR as a central hub in S. meliloti which—through sensing of PHB levels—regulates central C-pathways and EPS production, both in connection with other cellular processes.
Overlap between the PhaR regulon and PHB modulon varies across species
S. meliloti PhaR was found to repress the transcription of phasins and PHB depolymerase genes by binding in the vicinity of predicted −35 and −10 promoter elements, similar to PhaR homologs from gram-negative bacteria studied so far (6, 8). The direct regulatory link between PHB and phasin expression probably arose more than once during evolution, since it also operates in PHB-producing Bacillus species, where phasin gene regulation function of PhaR is fulfilled by a non-homologous PHB- and DNA-binding protein PhaQ (53). The presence of multiple phasins is a widespread feature of PHB-producing bacteria. For example, C. necator and B. diazoefficiens possess seven and four phasins, respectively, which are expressed at different levels (12, 54–56). Such redundancy infers a complex control of granule proteome respective to PHB accumulation and growth conditions. In Cupriavidus, probably not all phasin genes are regulated by phaR, since PhaR was shown to bind in the promoter regions of phaP1 and phaP3, but not phaP2 and phaP4 (6). In S. meliloti, PhaR regulated both phaP1 and phaP2. Although S. meliloti phasins differ in size (148 and 114 amino acid residues for PhaP1 and PhaP2, respectively) and share only 28% sequence identity, their structures are highly conserved and they share a common function in PHB binding (21). Repression by PhaR was identified as the main regulatory mechanism for phaP1. However, expression of phaP2 was also modulated by other unknown factors linked to PHB production, likely the small RNA MmgR (28). The observed differences in regulation suggest a degree of functional divergence among S. meliloti phasins.
Unlike in B. diazoefficiens, in S. meliloti, PhaR targets PHB degradation genes but does not seem to directly regulate the activity of PHB biosynthetic enzymes (12, 13). The significant decrease in stored PHB upon phaR mutation under PHB-permissive conditions in low P medium (Fig. 1B) suggests incomplete PhaR sequestration by PHB. Under these conditions, residual regulatory activity of a small proportion of DNA-bound PhaR molecules may be critical for properly adjusting cellular PHB-depolymerase activity, ensuring optimal PHB accumulation levels.
Negative autoregulation by PhaR in P. denitrificans and C. necator was suggested based on the protein’s ability to bind in the promoter region of phaR, although the expression levels in the presence or the absence of phaR were not measured (8, 51). A qRT-PCR analysis in C. necator showed that the transcript abundance of phaP, but not phaR, was dependent on PHB production, making it unlikely that phaR is regulated in the same manner as phasin genes (57). In R. sphaeroides, negative autoregulation of phaR was directly observed, as the mutation in the gene increased its own transcription to about 130% of wild-type levels (7). In our study, the promoter activity of phaR was analyzed in both phaR^+^ and phaR strains, and the results suggested a weak positive autoregulation. Binding of PhaR to its own promoter region in EMSA assays was weak, similar to the situation in P. denitrificans, where binding of PhaR to the phaR promoter was reported to be approximately 10 times less efficient than binding to the phaP promoter region (8). Thus, the strength of regulation by PhaR is likely to differ between phasin gene promoters and their own promoters, suggesting that negative autoregulation of phaR homologs is probably not a conserved feature among PHB-producing bacteria.
PhaR-mediated crosstalk between EPS and PHB production
Dramatically reduced EPSI production was reported previously for S. meliloti phbC strains, unable to produce PHB (58). This effect was also observed in the calcofluor assay. Several explanations for this phenomenon have been proposed, including regulation via the ExoS-ChvI two-component system in response to increased levels of acetyl phosphate (20) or the coupled regulation of EPSI and PHB biosynthesis through an unknown mechanism (26). In this study, we clearly identified phaR as the factor responsible for this effect, as inactivation of phaR in a phbC strain restored EPSI production (Fig. 6D). His_6_-PhaR was able to bind to the promoter regions of exo genes, and PhaR repressed their transcription in vivo. Thus, PhaR can downregulate production of EPSI under conditions that do not favor PHB synthesis. Moreover, a moderate repression by PhaR of the wgaA promoter, which drives the expression of 10 wga genes involved in EPSII biosynthesis, was also demonstrated (Fig. 7C). As in S. meliloti, in C. necator, EPS and PHB production levels correlated either partially or completely, depending on the specific medium composition (59). In contrast, in the plant-associated nitrogen fixer Azospirillum brasilense, mutation of phbC led to approximately a twofold increase in EPS and capsular polysaccharide production. Notably, although a phaR homolog is annotated in the genome of A. brasiliense, it has not been functionally studied. Similarly, the phbC mutant of the extremophilic bacterium Pseudomonas extremaustralis produced more EPS than the wild type (60). Thus, the coregulation of EPS production and PHB biosynthesis might not be strictly conserved among PHB-producing species. In S. meliloti, PHB synthesis could serve as an indicator of carbon homeostasis, signaling carbon excess relative to other nutrients. In species with unlinked regulation, EPS and PHB biosynthesis may compete for carbon substrates.
PhaR targets multiple control points in central metabolism in response to C availability
The proteomic analysis revealed that PhaR has a broader role in modulating metabolism beyond regulating PHB and EPS metabolic branches. A key control point influenced by PhaR appears to be the regulation of pyruvate fate, in agreement with prior findings in R. etli (61). In R. etli, mutation of phbC leads to elevated NAD(P)H and increased organic acid excretion, alongside enhanced activities of Pdh (pyruvate dehydrogenase), GltA (citrate synthase), Pyc, and PckA (e.g., phosphoenolpyruvate carboxykinase). Dunn and collaborators proposed that the accumulation of redox power resulting from the inability to synthesize PHB in the phbC mutant post-translationally represses the activity of these key central metabolic steps. Our results, however, support the hypothesis that PhaR is a primary regulator of these enzymes. While PhaR activity as a transcriptional regulator is influenced by the presence of PHB, it operates in a PHB-independent manner. In the absence of PHB during active growth, PhaR favors the oxidative decarboxylation of pyruvate through upregulation of the pyruvate dehydrogenase complex (Pdh), while simultaneously repressing alternative conversion pathways by downregulating PpdK and Pyc. The activation of Bkd by PhaR may indirectly contribute to controlling PHB accumulation under specific growth conditions, as the degradation of branched-chain amino acids serves as a direct source of acetyl-CoA and redox equivalents. Moreover, the repression of citrate synthase (GltA) by PhaR suggests that limiting its activity may promote a greater allocation of acetyl-CoA and NADH generated from pyruvate decarboxylation toward PHB synthesis. In addition, PhaR might indirectly modulate C flux through the TCA cycle by regulating the IIA enzyme of the PTS phosphotransferase system, ManX. In Rhizobium leguminosarum, ManX controls the activity of TCA cycle enzymes by a yet unclear mechanism, likely involving protein-protein interactions (62). Derepression of manX under PHB-accumulating conditions could promote acetyl-CoA oxidation. Alternatively, under these conditions, higher levels of SMc01727 (a putative isocitrate lyase family protein) may facilitate C shunting from acetyl-CoA through the glyoxylate cycle, providing intermediates to support EPS biosynthesis via an active gluconeogenic pathway. The role of PhaR sequestration in activating Tam, whose homologs have been shown to help alleviate the toxicity of trans-aconitate formed when the cis-isomer TCA cycle intermediate accumulates (63), should be further investigated.
Previous studies reported that phbC mutants of S. meliloti strain Rm41 and R. etli were unable to grow on pyruvate, and on pyruvate or glucose as the sole carbon sources, respectively. Nevertheless, the corresponding double phbC phaR mutants regained this ability (10, 26). The repression of the gluconeogenic gene ppdK and the initial steps of the Entner-Doudoroff pathway by PhaR (Table 2; Fig. 8) provides a plausible explanation for the growth deficiencies observed in the phbC mutants. Activation of the upper segment of the ED pathway might not necessarily indicate that PhaR promotes the net catabolism of hexoses. Instead, it could facilitate a high C flux through a cyclic ED pathway, a mode of function previously reported in S. meliloti (64).
We found no overlap between the PhaR regulon and the genes reported by D’Alessio and collaborators to exhibit altered expression in mutants defective in PHB biosynthesis grown under PHB-permissive conditions (22). In S. meliloti, promoters containing a conserved binding motif for a Fnr-type transcriptional regulator (i.e., FixK proteins)—primarily located on the pSymA plasmid—are influenced by PHB accumulation under N-limiting, aerobic conditions (22). In B. diazoefficiens, FixK_2_ operates within a regulatory cascade involving PhaR under microaerobic conditions (12, 13). Our findings suggest that, unlike in related rhizobia, the link between the expression of *fixK-*associated genes and the presence of PHB is not mediated by PhaR.
PhaR’s influence may reach further than previously recognized
PhaR’s role may extend beyond its currently understood functions. Deeper phenotypic characterization is required to elucidate the significance of multiple regulated genes (Table 2), such as the genes encoding chemotaxis-related proteins McpT and McpZ (65), the manganese transport system substrate-binding protein SitA (66), the (S)-2-haloacid dehalogenase Dhe (67), among others. Moreover, several strongly regulated targets, some of which have been confirmed to be directly controlled by PhaR at gene expression level, remain functionally uncharacterized. These include the small hypothetical proteins SMc03998 and SMc02051, the putative two-component sensor histidine-kinase SMb20609, the putative pilin glycosylation protein SMb21248, and the conserved hypothetical proteins SMc01834 and SMb20727, making it difficult to fully understand the extent of PhaR-mediated regulation. In some cases, complex mechanisms might operate where the regulation observed at the transcriptional level inversely correlates with the net effect measured at the protein level (e.g., the sugar ABC transporter ATP-binding protein SMc03815).
PhaR and its role during symbiosis
Mutation of phaR in Sm2011 did not lead to any significant changes in symbiotic performance, in contrast to the results observed for S. meliloti Rm41 (14), where phaR mutation resulted in compromised symbiosis with the host plant Medicago sativa. The nodule number and plant dry weight increased in plants inoculated with the Rm41 phaR mutant, although a large part of the nodules appeared colorless, and acetylene reduction activity was dramatically diminished (14).
Given the critical role of EPS production during rhizobial infection of the host plant, PHB accumulation in the N-limiting, C-rich rhizosphere may not merely fuel bacterial division and progression along the infection thread, as has long been postulated. Instead, it may indirectly activate EPS biosynthesis through PhaR sequestration, thereby influencing rhizobial competitiveness rather than infectivity. Regulation by phaR was also observed in nodule bacteria and bacteroids, as evidenced by the analysis of PhaP1-EGFP fluorescence in fresh nodule sections. This indicates that phaR is expressed and functions as a transcriptional repressor, even during the symbiotic differentiation of the bacteria. Under laboratory conditions, overexpression of phaP1 and deregulation of other PhaR target targets in vegetative and symbiotic bacteria did not significantly affect infection or nitrogen fixation. However, in the natural environment, where constant inter- and intra-species competition occurs, unadjusted metabolism in the absence of PhaR would likely impair bacterial fitness, negatively affecting overall symbiotic efficiency.
An integrated model of PhaR’s dual role as metabolic sensor and regulator
Figure 9 provides a schematic representation of PhaR’s regulon mapped onto the metabolic pathways. PHB accumulation triggered by non-C nutrient limitation promotes a global proteome adjustment through sequestration of the transcriptional regulator PhaR to the PHB granule surface. This sequestration induces the expression of the direct PhaR targets phasins and PHB depolymerases, enabling controlled PHB accumulation. Although PHB biosynthetic genes are not directly repressed, the production of PHB precursors, such as acetyl-CoA and NAD(P)H, is likely reduced through the deactivation of their primary metabolic sources, including pyruvate dehydrogenase and branched-chain amino acid degradation. In this context, an increased gluconeogenic flux seems required to offer pyruvate alternative fates other than its oxidative decarboxylation. Notably, gluconeogenesis may channel C toward the synthesis of alternative storage polymers, such as EPS, whose biosynthetic pathway is directly activated by PhaR sequestration. Furthermore, acetyl-CoA generated by PhaR-promoted turnover of PHB might be spared from complete oxidation. It is tempting to speculate that the direct activation of citrate synthase and the indirect regulation of TCA cycle enzymes via ManX contribute to balancing fluxes between the TCA cycle and glyoxylate shunt. Metabolic flux analyses will be key to addressing this.
Proposed model of PhaR- and PHB-dependent gene regulation of central carbon pathways in S. meliloti. When PHB accumulates, PhaR is sequestered by PHB granules. Under these conditions, genes that are repressed by PhaR (clustered in modules 1 to 3, identified by ANOVA comparison of phaR vs phbC phaR, P-adj < 0.05; phaZ is also included based on EMSA and promoter activity assays) become activated (shown in red). Conversely, genes activated by PhaR (clustered in modules 4 to 6, phaR vs phbC phaR, P-adj <0.05) are repressed (shown in blue). Major metabolic pathways are labeled in green. Rounded rectangles represent metabolites, while squared rectangles indicate enzyme names. Dashed lines denote multiple metabolic reactions, while solid lines represent single reactions. UDP-Gal, UDP-galactose; UDP-Glu, UDP-glucose; G1P, glucose-1-phosphate; G6P, glucose-6-phosphate; F6P, fructose-6-phosphate; F1,6bP, fructose-1,6-bisphosphate; PGL, D-glucono-1,5-lactone-6P; 6PG, 6-P-gluconate; KDPG, 2-keto-3-deoxy-6-phosphogluconate; G3P, glyceraldehyde-3-P; PEP, phosphoenolpyruvate; OxAc, oxalacetate, aKG, α-ketoglutarate; 3-HB, 3-hydroxybutyrate; 3-HB-CoA, 3-hydroxybutyryl-CoA; AcAc, acetoacetate; AcAc-CoA, acetoacetyl-CoA; 2-MB-CoA, (S)-2-methyl-butanoyl-CoA.
Implications for metabolic engineering and biotechnology
Our systems-level understanding of the PhaR regulon provides a clear framework for designing advanced metabolic switches to optimize PHB production. This strategy involves placing an engineered version of the phaR gene under the control of an inducible promoter to separate the growth and production phases. A particularly potent version of this switch would express only the DNA-binding domain of PhaR, making the regulator untiterable and thus preventing its inactivation by accumulating PHB granules. Upon induction during the production phase, this engineered PhaR would execute a coordinated metabolic program to maximize yield. It would activate key precursor supply pathways, such as the pdh and bkd operons, to boost the availability of acetyl-CoA. Simultaneously, it would repress the PHB depolymerase genes, preventing the breakdown of the accumulated polymer. By also repressing competing pathways like EPS biosynthesis, this approach has the potential to improve the overall carbon-to-product conversion efficiency. This regulator-centric strategy of using an engineered PhaR to globally rewire metabolism could be a promising, more holistic, and potent method for cellular engineering than traditional single-gene knockout strategies.
The reference list from the paper itself. Each links out to its DOI / PubMed record.
- 1Jendrossek D, Pfeiffer D. 2014. New insights in the formation of polyhydroxyalkanoate granules (carbonosomes) and novel functions of poly(3-hydroxybutyrate). Environ Microbiol 16:2357–2373. doi:10.1111/1462-2920.1235624329995 · doi ↗ · pubmed ↗
- 2Jendrossek D. 2009. Polyhydroxyalkanoate granules are complex subcellular organelles (carbonosomes). J Bacteriol 191:3195–3202. doi:10.1128/JB.01723-0819270094 PMC 2687172 · doi ↗ · pubmed ↗
- 3Trainer MA, Charles TC. 2006. The role of PHB metabolism in the symbiosis of rhizobia with legumes. Appl Microbiol Biotechnol 71:377–386. doi:10.1007/s 00253-006-0354-116703322 · doi ↗ · pubmed ↗
- 4Rehm BHA. 2003. Polyester synthases: natural catalysts for plastics. Biochem J 376:15–33. doi:10.1042/bj 2003125412954080 PMC 1223765 · doi ↗ · pubmed ↗
- 5York GM, Stubbe J, Sinskey AJ. 2002. The Ralstonia eutropha Pha R protein couples synthesis of the Pha P phasin to the presence of polyhydroxybutyrate in cells and promotes polyhydroxybutyrate production. J Bacteriol 184:59–66. doi:10.1128/JB.184.1.59-66.200211741844 PMC 134771 · doi ↗ · pubmed ↗
- 6Pötter M, Müller H, Steinbüchel A. 2005. Influence of homologous phasins (Pha P) on PHA accumulation and regulation of their expression by the transcriptional repressor Pha R in Ralstonia eutropha H 16. Microbiology (Reading, Engl) 151:825–833. doi:10.1099/mic.0.27613-015758228 · doi ↗ · pubmed ↗
- 7Chou ME, Chang WT, Chang YC, Yang MK. 2009. Expression of four pha genes involved in poly-β-hydroxybutyrate production and accumulation in Rhodobacter sphaeroides FJ 1. Mol Genet Genomics 282:97–106. doi:10.1007/s 00438-009-0448-419404680 · doi ↗ · pubmed ↗
- 8Maehara A, Taguchi S, Nishiyama T, Yamane T, Doi Y. 2002. A repressor protein, Pha R, regulates polyhydroxyalkanoate (PHA) synthesis via its direct interaction with PHA. J Bacteriol 184:3992–4002. doi:10.1128/JB.184.14.3992-4002.200212081972 PMC 135160 · doi ↗ · pubmed ↗