Prediction of Hepatocellular Carcinoma After Direct‐Acting Antiviral Therapy Using Agile 3+ and End‐of‐Treatment Alpha‐Fetoprotein Levels in Patients With Hepatitis C
Akifumi Kuwano, Masayoshi Yada, Kosuke Tanaka, Taikan Hamomoto, Kazuki Kurosaka, Hideo Suzuki, Kenta Motomura

TL;DR
This study shows that combining Agile 3+ scores and alpha-fetoprotein levels after treatment can help predict the risk of liver cancer in hepatitis C patients who achieved a virus-free state.
Contribution
A new scoring system combining Agile 3+ and end-of-treatment alpha-fetoprotein levels is proposed for predicting hepatocellular carcinoma risk after DAA therapy.
Findings
15 out of 337 patients (4.5%) developed hepatocellular carcinoma during follow-up.
Patients with a score of ≥1 had significantly higher HCC risk (p < 0.001).
Agile 3+ score ≥0.9398 and EOT-AFP ≥3.8 ng/mL were independent predictors of HCC.
Abstract
Direct‐acting antivirals (DAAs) have dramatically improved sustained virological response (SVR) rates in patients with hepatitis C virus (HCV) infection. However, the risk of hepatocellular carcinoma (HCC) remains even after achieving SVR. We previously reported that alpha‐fetoprotein (AFP) levels at the end of treatment (EOT) were associated with the occurrence of HCC after achieving sustained virologic response (SVR). Here, to improve predictive accuracy by incorporating the Agile 3+ score among 502 patients who received DAA therapy for HCV infection between September 2017 and July 2024, we excluded those who developed HCC within 1 year of treatment and included 337 patients with chronic hepatitis or compensated cirrhosis, who had no prior HCC and underwent transient elastography before treatment. A scoring system was developed by assigning 1 point for Agile 3+ score ≥ 0.9398 and 1…
Genes, proteins, chemicals, diseases, species, mutations and cell lines named across the full text — each resolved to its canonical identifier and authoritative record.
Click any figure to enlarge with its caption.
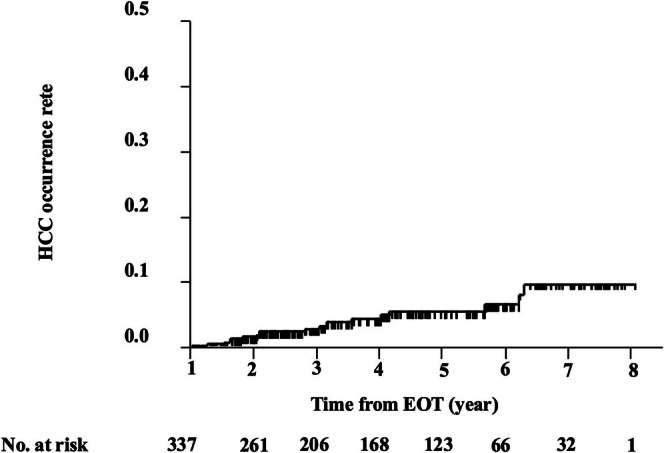 FIGURE 1
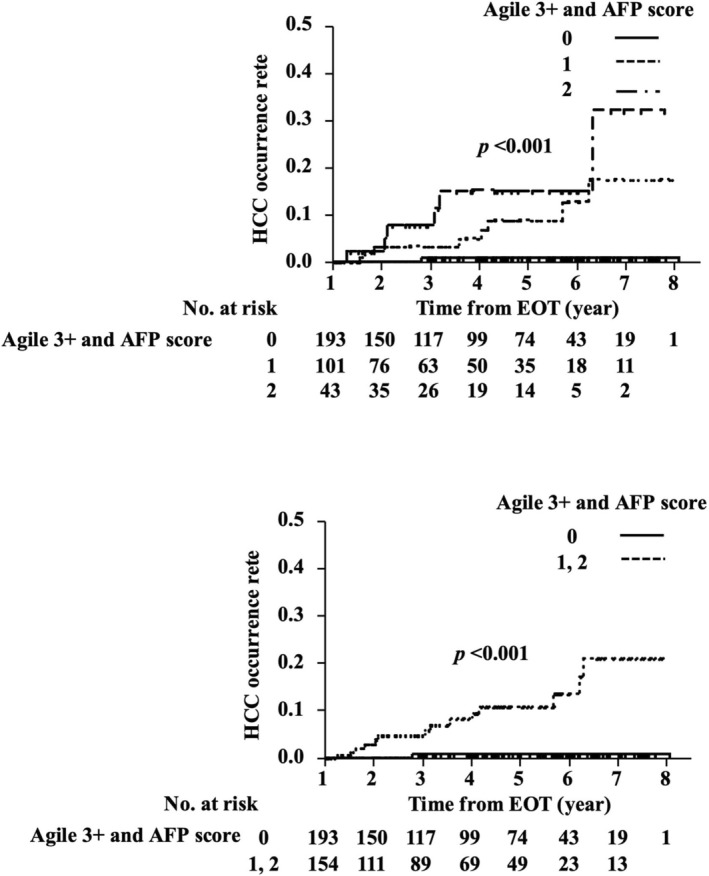 FIGURE 2
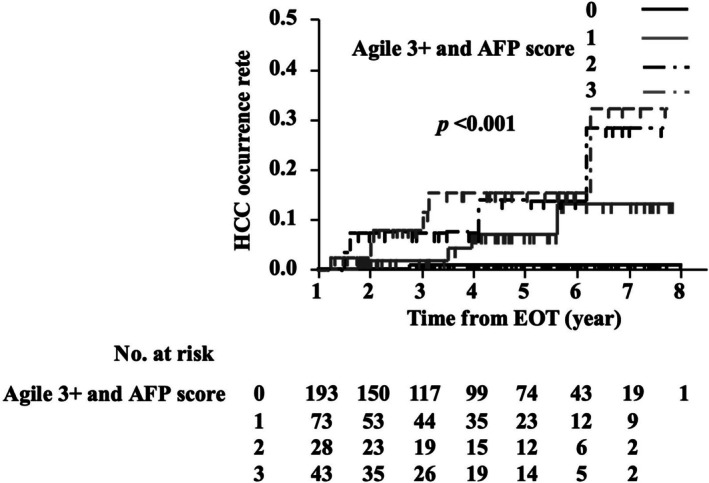 FIGURE 3
| Characteristic |
|
|---|---|
|
| 337 |
| Age (years) | 62 (53–72) |
| Age > 70 years | 110 (32.6%) |
| Male/female | 195/142 |
| BMI | 22.8 (20.5–25.6) |
| LC | 66 (19.6%) |
| MASLD | 58 (17.2%) |
| ALD | 52 (15.4%) |
| DM | 60 (17.8%) |
| Treatment | |
| SOF + RBV | 24 (7.1%) |
| SOF/LDV | 40 (12.0%) |
| EBR + GZR | 28 (8.3%) |
| GLE/PIB | 245 (72.6%) |
| Genotype 1B/2A/2B | 145/125/67 |
| HCV RNA (log IU/mL) | 6.2 (3.4–6.9) |
| CAP | 218.0 (189.8–259.0) |
| LSM | 6.6 (4.8–10.7) |
| Blood test at SOT | |
| Plt (×104/mm3) | 17.8 (13.6–23.4) |
| TB (mg/dL) | 0.7 (0.6–1.0) |
| AST (IU/L) | 41.0 (25.0–73.3) |
| ALT (IU/L) | 39.0 (22.0–83.3) |
| Alb (g/dL) | 4.0 (3.8–4.3) |
| GGT (IU/L) | 38.0 (20.8–89.3) |
| TC (mg/dL) | 169.0 (147.0–193.0) |
| TG (mg/dL) | 100.0 (74.0–135.0) |
| AFP (ng/mL) | 3.5 (2.3–6.7) |
| FIB‐4 index | 2.48 (1.39–3.91) |
| Agile 3+ score | 0.760 (0.513–0.925) |
| Blood test at EOT | |
| Plt (×104/mm3) | 19.3 (14.8–23.5) |
| TB (mg/dL) | 0.9 (0.6–1.2) |
| AST (IU/L) | 20.0 (17.0–28.0) |
| ALT (IU/L) | 15.0 (11.0–23.0) |
| Alb (g/dL) | 4.1 (3.9–4.3) |
| GGT (IU/L) | 20.0 (14.0–29.5) |
| TC (mg/dL) | 178.5 (152.0–200.0) |
| TG (mg/dL) | 98.5 (70.0–140.0) |
| AFP (ng/mL) | 2.9 (1.9–4.7) |
| FIB‐4 index | 1.83 (1.23–2.77) |
| aMAP scores | 68.1 (61.9–72.9) |
| Time from EOT (years) | 3.97 (2.05–5.78) |
| Characteristic | HCC occurrence | No HCC occurrence |
|
|---|---|---|---|
|
| 15 | 322 | |
| Age (years) | 63 (55–73) | 61.5 (52.8–72.0) | 0.58 |
| Age > 70 (years) | 6 (40.0%) | 104 (32.3%) | 0.54 |
| Male/female | 12/3 | 183/139 | 0.06 |
| BMI | 23.9 (22.0–25.3) | 22.7 (20.4–25.6) | 0.71 |
| LC | 10 (66.7%) | 56 (17.4%) | < 0.001 |
| MASLD/ALD | 9 (60.0%) | 101 (31.4%) | 0.03 |
| DM | 4 (26.7%) | 56 (17.4%) | 0.38 |
| CAP (dB) | 235.0 (190.0–254.0) | 218.0 (189.0–259.5) | 0.91 |
| LSM (kPa) | 14.8 (7.6–35.3) | 6.4 (4.8–10.3) | < 0.001 |
| Blood test results at SOT | |||
| Plt (×104/mm3) | 10.0 (8.1–18.2) | 17.9 (13.8–23.7) | < 0.001 |
| TB (mg/dL) | 0.9 (0.7–1.3) | 0.7 (0.6–1.0) | < 0.001 |
| AST (IU/L) | 79.0 (24.0–109.0) | 39.5 (25.0–71.3) | 0.07 |
| ALT (IU/L) | 54.0 (28.0–128.0) | 38.5 (21.0–76.0) | 0.17 |
| GGT (IU/L) | 138.0 (32.0–196.0) | 37.0 (20.0–85.3) | 0.004 |
| Alb (g/dL) | 3.9 (3.6–4.0) | 4.1 (3.8–4.3) | 0.03 |
| TC (mg/dL) | 164.0 (149.0–178.0) | 169.0 (146.0–194.0) | 0.54 |
| TG (mg/dL) | 101.0 (76.0–241.4) | 100.0 (74.0–135.0) | 0.82 |
| AFP (ng/mL) | 6.6 (3.7–19.6) | 3.3 (2.3–6.1) | 0.53 |
| FIB‐4 index | 4.30 (2.84–7.76) | 2.40 (1.38–3.80) | < 0.001 |
| Agile 3+ score | 0.995 (0.825–0.993) | 0.748 (0.505–0.920) | < 0.001 |
| Blood test results at EOT | |||
| Plt (×104/mm3) | 10.4 (7.9–23.5) | 19.4 (15.1–23.6) | 0.007 |
| TB (mg/dL) | 1.15 (0.88–1.55) | 0.8 (0.6–1.2) | 0.23 |
| AST (IU/L) | 24.0 (20.0–44.0) | 20.0 (16.5–28.0) | 0.003 |
| ALT (IU/L) | 16.0 (12.0–45.0) | 14.0 (11.0–22.0) | 0.008 |
| Alb (g/dL) | 3.9 (3.7–4.1) | 4.1 (3.9–4.3) | 0.25 |
| GGT (IU/L) | 44.0 (20.0–111.0) | 19.0 (14.0–29.0) | < 0.001 |
| TC (mg/dL) | 168.0 (151.8–179.0) | 180.0 (152.0–201.0) | 0.34 |
| TG (mg/dL) | 111.0 (73.0–175.8) | 97.0 (69.5–140) | 0.44 |
| AFP (ng/mL) | 4.4 (3.4–9.2) | 2.8 (1.9–4.6) | 0.008 |
| FIB‐4 index | 2.67 (1.50–5.00) | 1.82 (1.20–2.74) | 0.001 |
| aMAP scores | 72.1 (65.7–77.4) | 68.0 (61.5–72.6) | 0.01 |
| Time from EOT (years) | 3.03 (1.81–4.14) | 4.03 (2.07–5.81) | 0.15 |
| Factor | HR | 95% CI |
|
|---|---|---|---|
| EOT‐AFP ≥ 3.8 (ng/mL) | 4.11 | 1.40–12.06 | 0.001 |
| Agile 3+ score ≥ 0.9398 | 7.40 | 2.53–21.68 | < 0.001 |
| Agile 3+ and AFP scores | |||
| 0 | Ref | ||
| 1 | 15.47 | 1.93–123.74 | 0.01 |
| 2 | 29.12 | 3.50–242.31 | 0.002 |
| ≥ 1 | 19.34 | 2.54–147.17 | 0.004 |
| Factor | Univariate | Multivariate | ||||
|---|---|---|---|---|---|---|
| HR | 95% CI |
| HR | 95% CI |
| |
| Age ≥ 70 years | 1.36 | 0.48–3.81 | 0.56 | |||
| Sex: male | 4.10 | 1.15–14.61 | 0.03 | 3.33 | 0.89–12.43 | 0.07 |
| LC | 7.63 | 2.60–22.36 | < 0.001 | 2.31 | 0.66–8.02 | 0.19 |
| GGT (IU/L) at EOT | 1.01 | 1.00–1.01 | 0.02 | 1.00 | 1.00–1.01 | 0.02 |
| FIB‐4 index at EOT > 3.25 | 2.93 | 1.04–8.24 | 0.04 | 0.99 | 0.31–3.14 | 0.99 |
| Agile 3+ and AFP score ≥ 1 | 19.34 | 2.54–147.17 | 0.004 | 12.65 | 1.38–115.49 | 0.02 |
Peer Reviews
No public reviews on file for this paper yet. If you reviewed it on a platform where reviews are public (OpenReview, ICLR, NeurIPS, ICML), you can paste yours below so the community can read it here.
Videos
No videos yet. Explain this paper in a talk, walkthrough, or lecture? Add one.
Taxonomy
TopicsHepatitis C virus research · Liver Disease Diagnosis and Treatment · Hepatitis B Virus Studies
Hepatitis C virus (HCV) infection remains a major global health concern and a leading cause of hepatocellular carcinoma (HCC) [1]. The advent of direct‐acting antiviral agents (DAAs) has revolutionized HCV treatment, achieving sustained virological response (SVR) rates exceeding 95% in most patient populations [2]. However, despite successful viral eradication, the risk of hepatocarcinogenesis persists [3]. A multicenter study reported a 3‐year cumulative incidence of HCC of 4.9% following DAA therapy [4]. Several recent studies have identified risk factors for HCC development after SVR, including elevated serum α‐fetoprotein (AFP) levels, low platelet count, hypoalbuminemia, older age, and a higher fibrosis‐4 (FIB‐4) index [5, 6, 7, 8, 9].
Sano et al. further reported that metabolic dysfunction‐associated steatotic liver disease (MASLD) is a significant risk factor for HCC in elderly patients with HCV eradication [10]. Additionally, obesity and heavy alcohol consumption have been associated with increased post‐SVR HCC risk [11].
The Agile 3+ score is a composite noninvasive test designed to detect advanced fibrosis in patients with MASLD or alcohol‐related liver disease (ALD) [12, 13]. This score integrates liver stiffness measurement (LSM) via transient elastography (TE) with routine laboratory and clinical parameters, including platelet count, aspartate aminotransferase (AST), alanine aminotransferase (ALT), age, sex, and diabetes mellitus (DM) status, to generate a continuous risk score ranging from 0 to 1. In patients with metabolic MASLD, the Agile 3+ score demonstrated superior diagnostic performance over FIB‐4 (AUC 0.86 vs. 0.79). Similarly, in ALD, the Agile 3+ score outperformed FIB‐4 (AUC 0.92 vs. 0.80) [12]. These findings indicate that the Agile 3+ score more accurately distinguishes patients with and without advanced fibrosis, making it a more precise noninvasive diagnostic tool than FIB‐4 in both MASLD and ALD populations. While its utility in fibrosis staging is well established, the prognostic value of the Agile 3+ score for predicting HCC after HCV eradication has remained unclear.
Serum AFP levels at the end of treatment (EOT) have also been reported as predictive markers for HCC risk after SVR [14, 15]. In our previous study, we demonstrated that an EOT‐AFP level greater than 3.8 ng/mL was significantly associated with increased HCC incidence following treatment [16]. However, LSM, which reflects the severity of hepatic fibrosis, was not included in that analysis.
In the present study, we aimed to evaluate the association between the Agile 3+ score and long‐term HCC risk following DAA‐induced SVR. Furthermore, we developed a newly described scoring model combining the Agile 3+ score with EOT‐AFP levels to enhance HCC risk stratification in patients with chronic hepatitis C who achieved SVR.
Methods
1
Study Design and Population
1.1
This retrospective cohort study was conducted at Aso Iizuka Hospital. The present study was conducted following the guidelines of the Declaration of Helsinki and was approved by the Ethics Committee of Aso Iizuka Hospital (approval No. 17115). Written informed consent for participation in the study was obtained from all patients prior to DAA treatment. We reviewed the medical records of 502 patients with chronic hepatitis C who received DAA therapy between September 2017 and September 2024. Patients were included if they met the following criteria: (1) achieved SVR, (2) had no prior history of HCC before initiating DAA therapy, (3) underwent TE evaluation before treatment, and (4) had either chronic hepatitis or compensated cirrhosis. Exclusion criteria were: (1) coinfection with hepatitis B virus or human immunodeficiency virus, or the presence of other liver diseases such as primary biliary cholangitis or autoimmune hepatitis; (2) prior history of HCC or failure to achieve SVR12 after DAA treatment; (3) decompensated cirrhosis; and (4) HCC occurrence within 1 year after the EOT. LC was diagnosed based on liver histology or transient elastography or the presence of gastro‐esophageal varices. After applying these criteria, a total of 337 patients were eligible for analysis. Follow‐up started on the date of EOT. Patients were followed until the earliest of HCC, death, liver transplantation, and loss to follow‐up. Non‐HCC cases were censored at the last HCC‐free date.
MASLD and ALD
1.2
MASLD was defined as the presence of hepatic steatosis (controlled attenuation parameter (CAP) ≥ 288 dB) in combination with at least one metabolic risk factor. ALD was defined as steatosis plus an average daily alcohol intake exceeding 50 g for women or 60 g for men, together with at least one metabolic risk factor. Metabolic risk factors were determined based on the updated consensus criteria and included: systolic/diastolic blood pressure ≥ 130/85 mmHg or current use of antihypertensive medication; body mass index (BMI) ≥ 23 kg/m^2^ or waist circumference > 94 cm in men or > 80 cm in women; fasting plasma glucose ≥ 100 mg/dL, hemoglobin A1_c_ ≥ 5.7%, or use of antidiabetic medication; serum triglyceride level ≥ 150 mg/dL or use of lipid‐lowering agents; and high‐density lipoprotein (HDL) cholesterol level < 40 mg/dL in men or < 50 mg/dL in women, or use of lipid‐lowering agents [17].
DAA Treatment
1.3
Of the 338 patients, 24 were treated with sofosbuvir and ribavirin for 12 weeks; 40 were treated with sofosbuvir and ledipasvir for 12 weeks; 28 received elbasvir and grazoprevir for 12 weeks; and the remaining 246 patients were treated with glecaprevir and pibrentasvir for 8 to 12 weeks (Table 1).
Follow‐Up and Outcomes
1.4
The primary endpoint was the development of HCC more than 1 year after achieving SVR. HCC surveillance was conducted every 3 to 6 months following DAA treatment, using serum AFP measurements and imaging modalities such as ultrasonography, CT, and magnetic resonance imaging. The median duration of follow‐up was 3.97 years, with an interquartile range (IQR) of 2.05 to 5.78 years.
HCV RNA
1.5
HCV RNA was isolated from 200 μL of serum using the miRNeasy Serum/Plasma Kit (Qiagen, Hilden, Germany) following the manufacturer's protocol. Viral RNA levels were quantified utilizing a commercially available TaqMan‐based real‐time PCR assay (COBAS AmpliPrep/COBAS TaqMan HCV Test, Version 2; Roche Molecular Diagnostics, Pleasanton, CA, USA), which has a lower limit of quantification of 1.6 log_10_ IU/mL and a detection threshold of 1.2 log_10_ IU/mL, as specified by the manufacturer. Genotyping of HCV was carried out using the Versant HCV Genotype 2.0 Line Probe Assay (LiPA 2.0; Siemens Healthineers, Erlangen, Germany). Additionally, viral sequencing was employed to differentiate between genotypes 1a, 1b, 2, 3, 4, and 6, in line with the manufacturer's instructions.
SVR was defined as undetectable serum HCV RNA levels, measured at least 12 weeks after completion of therapy and below the lower detection limit of the assay [18].
FIB‐4 Index
1.6
The FIB‐4 index was used to clinically assess the degree of liver fibrosis both before and after DAA therapy. It was calculated using the following formula: FIB‐4 index = [AST (IU/L) × age (years)]/[platelet count (10^9^/L) × √ALT (IU/L)] [19].
Agile 3+ Score
1.7
The Agile 3+ score comprises six clinical and laboratory factors: LSM (kPa), age, sex, DM status, AST, and platelet count [20]. The score is scaled from 0 to 1 and was developed to enhance the diagnostic accuracy for advanced fibrosis in individuals with MASLD or ALD. TE was conducted using a FibroScan (Echosens, Paris, France) transient elastography measurement device, applying either the M‐ or XL‐probe depending on patient characteristics. CAP and LSM values were obtained through FibroScan. Given the possibility of measurement errors due to subcutaneous fat when using the M‐probe in obese patients, the XL‐probe was preferentially employed in such cases. Patients were examined while they were supine with the right arm maximally abducted to expose the right liver lobe. Measurements were considered valid if there were at least 10 readings, with a ≥ 60% success rate and an interquartile range < 30%. The median of these valid measurements was used for analysis.
Age‐Male‐Albumin–Bilirubin–Platelets (aMAP) Score
1.8
aMAP scores were calculated using data for age, gender, serum total bilirubin, serum albumin, and platelet count obtained at a pretreatment examination, as follows: aMAP risk score = ({0.06 × age + 0.89 × gender (male: 1, female: 0) + 0.48 × (log_10_ serum total bilirubin [μmol/L] × 0.66) + (serum albumin [g/L] × −0.085) −0.01 × platelet count (10^3^/mm^3^)} + 7.4)/14.77 × 100 [21].
Statistical Analysis
1.9
The data are presented as median [IQR] (Tables 1 and 2). Cumulative incidence of HCC was estimated using a Kaplan–Meier method and compared across risk score groups using a log‐rank test. The prognostic value of the composite score was assessed using univariate and multivariate Cox proportional hazards models. Hazard ratios (HRs) and 95% confidence intervals (CIs) were calculated. Receiver operating characteristic (ROC) curve analysis was used to determine the optimal cutoff point for the Agile 3+ score. We assessed discrimination of two prespecified binary predictors using Harrell's concordance index (C‐index) for right‐censored data with ties counted as 0.5. All p‐values were derived from two‐tailed tests, and differences with p < 0.05 were considered significant. All statistical analyses were performed using JMP Pro software (version 17; SAS Institute Inc., Cary, NC).
Results
2
Patient Characteristics
2.1
The baseline characteristics of the study population are presented in Table 1. A total of 338 patients were enrolled, with a median age of 62 years (IQR, 52–72 years), and 110 individuals (32.6%) were aged over 70. The cohort included 195 men and 142 women. Their median BMI was 22.8 kg/m^2^. Liver cirrhosis was identified in 66 patients (19.6%). Before initiating DAA therapy, the median CAP was 218.5 dB (IQR, 189.8–259.0 dB), and the median LSM was 6.6 kPa (IQR, 4.8–10.7 kPa).
Table 2 displays the post‐DAA treatment characteristics of patients stratified by HCC development: the HCC group (n = 15), the no HCC group (n = 322). Median age did not differ significantly between groups (63.0 [IQR, 55.0–73.0] vs. 61.5 [IQR, 52.8–72.0]) years (p = 0.58), nor did the proportion of patients aged over 70 years (40.0% vs. 32.3%, p = 0.54). However, liver cirrhosis was significantly more frequent in the HCC group (66.7% vs. 17.4%, p < 0.001). The median CAP, reflecting hepatic steatosis, was similar in both groups (235.0 vs. 218.0 dB, p = 0.91). Conversely, LSM, a marker of liver fibrosis, was significantly higher in the HCC group (14.8 vs. 6.35 kPa, p < 0.001), indicating more severe fibrosis. Additionally, the HCC group exhibited significantly lower platelet counts (10.0 vs. 17.9 × 10^4^/mm^3^, p = 0.001), elevated total bilirubin (0.9 vs. 0.7 mg/dL, p < 0.001), and decreased serum albumin levels (3.9 vs. 4.1 g/dL, p = 0.03) at the start of treatment (SOT). The FIB‐4 index at SOT was also markedly higher in this group (4.30 vs. 2.40, p < 0.001). Agile 3+ score remained significantly elevated (0.9445 vs. 0.748, p = 0.006). Similar findings were observed at EOT. The HCC group continued to show lower platelet counts (10.4 vs. 19.4 × 10^4^/mm^3^, p = 0.007), higher AST (24.0 vs. 20.0 IU/L, p = 0.003) and ALT (16.0 vs. 14.0 IU/L, p = 0.008) levels, and increased AFP levels (4.4 vs. 2.8 ng/mL, p = 0.008), the FIB‐4 index at EOT (2.67 vs. 1.82, p = 0.001) and the aMAP scores (72.1 vs. 68.0, p = 0.01). There was no significant difference in median follow‐up duration from the EOT between the two groups (3.0 vs. 4.0 years, p = 0.15).
Cumulative Incidence Rate of HCC
2.2
During the observation period, 15 patients (4.5%) developed HCC more than 1 year after completing DAA therapy. The cumulative incidence of HCC from the EOT was as follows: 1.4% at 2 years, 2.6% at 3 years, 4.7% at 4 years, 5.3% at 5 years, 6.3% at 6 years, and 9.6% at 7 years (Figure 1).
Cumulative incidence of HCC from the end of HCV eradication using DAA treatment. DAA, direct‐acting antiviral; EOT, end of treatment; HCC, hepatocellular carcinoma; HCV, hepatitis C virus.
Agile 3+ With AFP Risk Score and HCC Development
2.3
The optimal cutoff value for the Agile 3+ score, as determined by ROC curve analysis, was 0.9398 (area under the curve (AUC) 0.75). An Agile 3+ score ≥ 0.9398 was assigned 1 point, and an Agile 3+ score < 0.9398 ng/mL was assigned 0 points. Based on previous studies, a threshold of ≥ 3.8 ng/mL was used to define elevated EOT‐AFP (16). Patients with AFP ≥ 3.8 ng/mL were assigned 1 point, and those with AFP < 3.8 ng/mL were assigned 0 points. The total risk score (Agile 3+ and AFP scores) was calculated as the sum of the Agile 3+ score point and the EOT‐AFP score point, ranging from 0 to 2 (Score 0: n = 193 (57.1%), Score 1: n = 102 (30.1%), Score 2: n = 43 (12.7%)). The combination of EOT‐AFP and the Agile 3+ score demonstrated a stronger association with HCC risk than either factor alone. Specifically, while EOT‐AFP ≥ 3.8 ng/mL and Agile 3+ score ≥ 0.9398 were individually associated with increased risk (HR = 4.11 and 7.40, respectively), the combined score (Agile 3+ and AFP scores ≥ 1) showed an even higher hazard ratio (HR = 19.34, 95% CI 2.54–147.17, p = 0.004), suggesting that integrating both parameters may enhance predictive performance (Table 3).
Kaplan–Meier analysis revealed a significantly higher cumulative incidence of HCC in patients with a score of ≥ 1 compared with that in patients with a score of 0 (log‐rank test, p < 0.001) (Figure 2). We prespecified a unit‐weighted composite (1 point each for Agile 3+ > 0.9398 and EOT‐AFP > 3.8 ng/mL) to favor simplicity and transportability. In a sensitivity analysis assigning 2 points to Agile 3+, discrimination and calibration were unchanged, so we retained unit weights as the primary model (Figure 3). The weighted specification (Agile 3+ = 2 points) yielded no meaningful improvement and no clear separation between 2‐ and 3‐point strata. Modeled as continuous variables, the C‐index was 0.784 (95% CI, 0.680–0.875) for the Agile 3–AFP score and 0.721 (95% CI, 0.582–0.852) for aMAP; the difference was not statistically significant (p = 0.570), indicating comparable discrimination.
Kaplan–Meier analysis of the cumulative HCC occurrence from the end of HCV eradication, stratified based on Agile 3+ scores (≥ 0.9398: 1 point) and AFP level scores associated with HCC occurrence. AFP, α‐fetoprotein; DAA, direct‐acting antiviral; HCC, hepatocellular carcinoma; HCV, hepatitis C virus.
Kaplan–Meier analysis of the cumulative HCC occurrence from the end of HCV eradication, stratified based on Agile 3+ scores (≥ 0.9398: 2 points) and AFP level scores associated with HCC occurrence. AFP, α‐fetoprotein; DAA, direct‐acting antiviral; HCC, hepatocellular carcinoma; HCV, hepatitis C virus.
Risk Factors for HCC Occurrence Following DAA Treatment
2.4
In the univariate analysis, male sex (HR 4.10, 95% CI 1.15–14.61, p = 0.03), liver cirrhosis (HR 7.63, 95% CI 2.60–22.36, p < 0.001), γ‐glutamyl transferase (GGT) at EOT (HR 1.01, 95% CI 1.00–1.01, p = 0.02), FIB‐4 index > 3.25 at EOT (HR 2.93, 95% CI 1.08–8.24, p = 0.04), and Agile 3‐AFP score ≥ 1 (HR 19.34, 95% CI 2.54–147.17, p = 0.004) were significantly associated with HCC development following DAA therapy (Table 4). Covariates (age ≥ 70 years, sex, liver cirrhosis, GGT, and FIB‐4) were selected based on prior reports of post‐SVR HCC risk and biological plausibility as core confounders [21, 22]. In the multivariate analysis, Agile 3‐AFP score ≥ 1 (HR 12.65, 95% CI 1.38–115.49, p = 0.02) and GGT (HR 1.00, 95% CI 1.00–1.01, p = 0.02) remained independent predictors of HCC occurrence, while liver cirrhosis and FIB‐4 index > 3.25 were no longer statistically significant (Table 4).
Agile 3‐ AFP‐ GGT Scores
2.5
We constructed Agile 3‐AFP‐GGT score by adding 1 point for EOT‐GGT ≥ 67 IU/L (ROC‐derived cut‐off) to Agile 3‐AFP score. In analyses treating both predictors, the C‐index was 0.809 (95% CI 0.690–0.906) for Agile 3‐AFP‐GGT score and 0.784 (95% CI 0.680–0.875) for Agile 3‐AFP score. There was no statistical significance between both models (p = 0.740).
Discussion
3
In the present study, we demonstrated that a scoring model combining the baseline Agile 3+ score with serum AFP levels at EOT effectively stratified the risk of HCC in patients with chronic hepatitis C who achieved SVR following DAA therapy. Notably, patients with a total score of one or higher showed significantly increased HCC incidence, suggesting that this simple two‐factor model may be a practical tool for post‐SVR surveillance.
Previous studies have identified several risk factors for HCC after SVR, including advanced fibrosis, older age, male sex, and elevated AFP levels [23, 24, 25]. Our group previously reported that an EOT‐AFP level ≥ 3.8 ng/mL is associated with increased HCC risk [16]. However, LSM, a key noninvasive marker of fibrosis, was not included in that model [26, 27]. The Agile 3+ score incorporates LSM along with other clinical variables into a composite index and has shown robust diagnostic performance in MASLD and ALD populations [12]. There have been reports indicating that non‐alcoholic fatty liver disease and ALD are associated with an increased risk of HCC even after achieving SVR in patients with HCV infection [28, 29, 30].
To our knowledge, this is one of the first studies to evaluate the prognostic value of the Agile 3+ score for HCC development after DAA therapy in HCV‐infected patients. We found that an Agile 3+ score calculated before DAA initiation was significantly associated with subsequent HCC occurrence, with an optimal cutoff value of 0.9398. This threshold is notably higher than previously validated cutoffs for advanced fibrosis in MASLD populations, where scores > 0.675 define a high‐risk group [12].
Several factors may explain this discrepancy. First, the Agile 3+ score was initially developed and validated in nonviral liver diseases, particularly MASLD and ALD. Its application to HCV‐related liver disease has not been formally validated. Therefore, using the same cutoffs without recalibration may be inappropriate. Second, the score was calculated before antiviral treatment, a time when ALT and LSM are often elevated owing to ongoing inflammation. Because both parameters contribute to the Agile 3+ score, inflammatory activity may have led to overestimation of fibrosis severity. Third, the elevated Agile 3+ score may reflect not only fibrosis but also immune activation or hepatic injury factors that may play mechanistic roles in hepatocarcinogenesis. Thus, the score may represent a composite marker of both fibrotic and inflammatory burden, rather than fibrosis alone.
Taken together, our findings suggest that while the Agile 3+ score may be a useful predictor of HCC risk in HCV patients, its interpretation, particularly when calculated before treatment, should be approached with caution. Future prospective studies are needed to validate disease‐specific cutoffs and the optimal timing of score assessment.
Our results also emphasize that fibrosis‐related factors remain relevant even after viral eradication. Elevated LSM and metabolic risk factors such as DM may indicate persistent liver injury or latent carcinogenic potential. EOT‐AFP, in turn, may reflect biological activity associated with undetected dysplastic nodules or tumor‐promoting microenvironments. Combining structural (fibrosis) and functional (AFP) parameters likely improves risk prediction beyond either alone.
The FIB‐4 index, a well‐established noninvasive marker of liver fibrosis based on age, AST, alanine aminotransferase (ALT), and platelet count, has been extensively validated for predicting HCC in patients with chronic HCV infection. Several studies have reported that an FIB‐4 index ≥ 3.25 is associated with increased post‐SVR HCC risk [31, 32]. However, in our multivariate analysis including both the FIB‐4 index and the Agile 3+ with AFP score, only the Agile 3+ with AFP score remained as an independent predictor of HCC.
Clinically, this model offers a convenient and noninvasive approach to identify high‐risk individuals who may benefit from intensified HCC surveillance. Its binary scoring system (0–2 points) is easy to apply and relies solely on standard pre‐ and post‐treatment assessments. In the group with an Agile 3‐AFP score of 0, only one case of HCC was observed, suggesting that extending or even discontinuing surveillance may be considered. In this study, the Agile 3–AFP scores and aMAP scores showed comparable discrimination under continuous modeling. aMAP has the advantages of broad familiarity and routinely available variables with low missingness. Conversely, the Agile 3–AFP scores are mechanistically tailored to the HCV‐SVR context and may aid risk stratification in this population. In multivariable analysis, GGT emerged as an independent risk factor for HCC. However, adding GGT to the Agile 3–AFP score did not yield a statistically significant improvement in the C‐index; therefore, we adopted the simpler Agile 3–AFP score for the present study.
Several limitations should be acknowledged. First, this was a single‐center, retrospective study with a limited number of HCC cases. Validation in larger, multicenter cohorts is needed. Second, we were unable to incorporate post‐treatment LSM data, which may provide further prognostic insight regarding fibrosis regression. Ideally, the Agile 3+ score measured after SVR would offer a more accurate reflection of residual fibrotic burden and associated HCC risk. However, because of missing values, post‐treatment analysis was not feasible in our cohort. Third, the model assigns equal weight to both components. While this enhances simplicity, future studies should consider weighted scores to improve discriminative performance.
In conclusion, our study highlights the potential utility of a combined Agile 3+ score and EOT‐AFP score in predicting long‐term HCC risk after DAA therapy. This simple model may support risk‐adapted surveillance strategies in patients with SVR. Further research incorporating longitudinal post‐treatment data is warranted to optimize its clinical application.
Consent
The authors have nothing to report.
Conflicts of Interest
The authors declare no conflicts of interest.
The reference list from the paper itself. Each links out to its DOI / PubMed record.
- 1Polaris Observatory HCV Collaborators , “Global Prevalence and Genotype Distribution of Hepatitis C Virus Infection in 2015: A Modelling Study,” Lancet Gastroenterology & Hepatology 2, no. 3 (2017): 161–176, 10.1016/S 2468-1253(16)30181-9.28404132 · doi ↗ · pubmed ↗
- 2AASLD‐IDSA HCV Guidance Panel , “Hepatitis C Guidance 2018 Update: AASLD‐IDSA Recommendations for Testing, Managing, and Treating Hepatitis C Virus Infection,” Hepatology 67, no. 4 (2018): 1473–1512, 10.1093/cid/ciy 585.PMC 719089230215672 · doi ↗ · pubmed ↗
- 3F. Kanwal , J. Kramer , S. M. Asch , M. Chayanupatkul , Y. Cao , and H. B. el‐Serag , “Risk of Hepatocellular Cancer in HCV Patients Treated With Direct‐Acting Antiviral Agents,” Gastroenterology 153, no. 4 (2017): 996–1005, 10.1053/j.gastro.2017.06.012.28642197 · doi ↗ · pubmed ↗
- 4H. Toyoda , A. Hiraoka , H. Uojima , et al., “Characteristics and Prognosis of De Novo Hepatocellular Carcinoma After Sustained Virologic Response,” Hepatology Communications 5, no. 7 (2021): 1290–1299, 10.1002/hep 4.1716.34278176 PMC 8279467 · doi ↗ · pubmed ↗
- 5M. Guarino , A. Sessa , V. Cossiga , et al., “Direct‐Acting Antivirals and Hepatocellular Carcinoma in Chronic Hepatitis C: A Few Lights and Many Shadows,” World Journal of Gastroenterology 24, no. 24 (2018): 2582–2595, 10.3748/wjg.v 24.i 24.2582.29962815 PMC 6021774 · doi ↗ · pubmed ↗
- 6F. Kanwal , J. R. Kramer , S. M. Asch , Y. Cao , L. Li , and H. B. El‐Serag , “Long‐Term Risk of Hepatocellular Carcinoma in HCV Patients Treated With Direct Acting Antiviral Agents,” Hepatology 71, no. 1 (2020): 44–55, 10.1002/hep.30823.31222774 · doi ↗ · pubmed ↗
- 7A. G. Singal , J. K. Lim , and F. Kanwal , “AGA Clinical Practice Update on Interaction Between Oral Direct‐Acting Antivirals for Chronic Hepatitis C Infection and Hepatocellular Carcinoma: Expert Review,” Gastroenterology 156, no. 8 (2019): 2149–2157, 10.1053/j.gastro.2019.02.046.30878469 PMC 6529246 · doi ↗ · pubmed ↗
- 8A. Lleo , A. Aglitti , A. Aghemo , et al., “Predictors of Hepatocellular Carcinoma in HCV Cirrhotic Patients Treated With Direct Acting Antivirals,” Digestive and Liver Disease 51, no. 2 (2019): 310–317, 10.1016/j.dld.2018.10.014.30473220 · doi ↗ · pubmed ↗